The H i Column Density Distribution Function at : the Connection to Damped Ly Statistics
Abstract
We present a measurement of the H i column density distribution function [] at the present epoch for column densities . These high column densities compare to those measured in damped Ly lines seen in absorption against background quasars. Although observationally rare, it appears that the bulk of the neutral gas in the Universe is associated with these damped Ly systems. In order to obtain a good anchor point at we determine in the local Universe by using 21cm synthesis observations of a complete sample of spiral galaxies. We show that for damped Ly systems has changed significantly from high to the present and that change is greatest for the highest column densities. The measurements indicate that low surface brightness galaxies make a minor contribution to the cross section for H i, especially for .
1 Kapteyn Astronomical Institute, P.O. Box 800, 9700 AV
Groningen, The Netherlands
zwaan, fbriggs@astro.rug.nl
2
National Radio Astronomy Observatory, P.O. Box 0, Socorro, NM 87801,
U.S.A.
mverheij@aoc.nrao.edu
Keywords: galaxies: ISM — galaxies: evolution — quasars: absorption lines
1 Introduction
High column density absorbers seen in the spectra of background QSOs are referred to as Damped Ly (DL) systems if the observed H i column density exceeds the value of . The DL absorption lines are on the square-root part of the curve of growth where damping wings dominate the profile and column densities can be determined accurately by fitting the line profiles. Wolfe (1995) argues that these systems at high redshifts are gas-rich disks in the process of contracting to present-day spiral galaxies. This idea is supported by the fact that the characteristic velocity profiles of metal lines and Lyman series lines in DL systems are similar to those of sightlines through spiral galaxies at . More recently, detailed modeling of DL absorption profiles by Prochaska & Wolfe (1998) has shown that the DL systems are consistent with rapidly rotating, thick disks. Note however that alternative models, like protogalactic clumps coalescing into dark matter halos (Haehnelt et al. 1997, Khersonsky & Turnshek 1996), can also explain the kinematics. The cosmological mass density of neutral gas in DL systems at high redshift is comparable to the mass density of luminous matter in galaxies at (e.g. Lanzetta et al. 1995).
One of the best known statistical results of the study of QSO absorption line systems is the column density distribution function (CDDF) of neutral hydrogen. The function describes the chance of finding an absorber of a certain H i column density along a random line of sight per unit distance. An observational fact from high- Ly studies is that the differential CDDF [] can be described by a single power law of the form , where over ten orders of magnitude in column density (e.g. Tytler 1987, Hu et al. 1995) from (Ly forest) to (DL).
An integration over the distribution function gives the total cosmological neutral gas density as a function of redshift. The H i gas density relates to as and it is readily seen that if and . This implies that although the high column density systems are observationally rare, they contain the bulk of the neutral gas mass in the Universe. Because so few DL systems are known (), the uncertainties on and the CDDF for high column densities are large, especially if the measurements are split up into different redshift bins. But following the CDDF as a function of redshift is certainly very important in constraining models of complicated physical processes like star formation or gas feedback to the interstellar medium.
There are several reasons why the determination of at the present epoch is difficult. Due to the expansion of the Universe the expected number of absorbers along a line of sight decreases with decreasing redshift, the Ly line is not observable from the ground for redshifts smaller than 1.65, and starlight and dust in the absorbing foreground galaxies hinder the identification of the background quasars. Gravitational lensing may also play a role as it can bring faint quasars into the sample which otherwise would not have been selected (e.g. Smette et al. 1997).
At the present epoch the largest repositories of neutral gas are clearly galaxies. No instance of a free-floating H i cloud not confined to the gravitational potential of a galaxy has yet been identified. It is therefore justified to use our knowledge of the local galaxy population to estimate the shape and normalization of the CDDF.
2 How to determine at ?
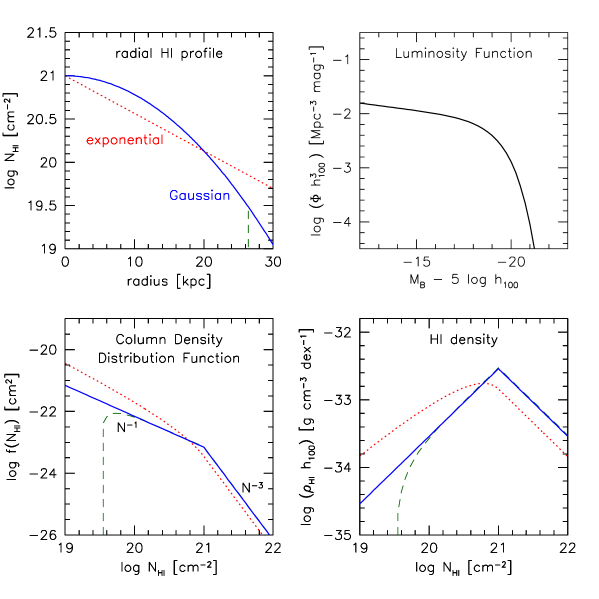
A simple but illustrative and instructive method is to take the analytical approach. This is illustrated in Figure 1. Here we represent the radial distribution of the neutral hydrogen gas in galaxies by both an exponential and a Gaussian model. The differential cross sectional area of an inclined ring with a column density in the range to is given by , where is the radius at which a column density is seen, and is the inclination of the ring. We assume that the luminosity function of the local galaxy population can be described by a Schechter function as indicated in the upper right panel of figure 1. The local can be derived from and the area function by taking the integral
| (1) |
where the subscript indicates an average over all inclinations. To evaluate this integral, the area function, or more generally the radial H i distribution, needs to be related to . Here we adopt the relation (following Rao & Briggs 1993) and assume that the central gas surface density in disks is not dependent on morphological type or luminosity. The resulting for both models is shown in the lower left panel. The integral H i gas density in as a function of column density is shown in the lower right panel. This function can be calculated with , where is the mass of the hydrogen atom.
The Gaussian models yield a CDDF of the form , where for smaller than the maximum column density seen in a face-on disk () and for the higher values of . The exponential model gives a smoother function. The logarithmic slope is approximately around , slowly changing to at higher column densities. In fact, it was shown already by Milgrom (1988) that for for any radial surface density distribution. The lower right panel clearly illustrates that an overwhelming part of the total H i mass in the local Universe is associated with column densities close to .
In addition to these simple models we also show the effect of disk truncation on the CDDF. The thin dashed line illustrates a Gaussian disk truncated at , the level below which photo-ionization by the extragalactic UV-background is normally assumed to be important (e.g. Corbelli & Salpeter 1993, Maloney 1993). It appears that this truncation only seriously affects the CDDF below . No significant changes occur at higher column densities.
A more reliable method than this analytical approach is to determine by using observed H i distributions. 21cm maps of nearby galaxies routinely reach sensitivity limits comparable to column densities that typify DL absorbers. It therefore seems natural to calculate , simply by adding cross sectional areas as a function of for a large sample of galaxies for which 21cm synthesis observations are available. However, this approach is complicated by the fact that there is an enormous variation in sensitivity and angular resolution of the 21cm maps, and the problem of choosing a fair and complete sample of galaxies. Most galaxies that have been studied extensively in the 21cm line were selected on having either a large H i diameter, so that the rotation curve can be sampled out to large galactocentric radii, or on having peculiarities such as polar rings or warps. Thus, most samples for which 21cm synthesis data exist are not representative of the galaxy population of the local Universe and would likely be biased against dwarf and low surface brightness galaxies.
3 The Ursa Major Cluster
The Ursa Major cluster of galaxies, studied extensively by Verheijen (1997), forms an ideal sample for an unbiased study of the column density distribution function. The Ursa Major cluster, at a distance of 15 Mpc, is different in many respects from famous, equally distant clusters like Virgo and Fornax. Ursa Major’s member galaxies show no concentration towards a central condensation and their velocity dispersion is exceptionally low, approximately 150 km/s. The estimated crossing time is half a Hubble time and hence the galaxies do not seem to be seriously affected by tidal interactions. In addition to this, there is a predominance of late type galaxies and the morphological mix of galaxies is indistinguishable from that in the field. This combination of properties implies that the Ursa Major cluster is in fact an overdensity of galaxies and not comparable to classical clusters of galaxies. This justifies the use of the Ursa Major cluster for the study of the shape of the CDDF of neutral hydrogen in the local Universe.
The Ursa Major cluster as defined by Tully et al. (1996) comprises a volume of 80 Mpc3, within which 80 galaxies are identified to date. For a complete sample of 62 galaxies intrinsically brighter than the Small Magellanic Cloud () 21cm synthesis observations have been performed with the WSRT111The WSRT is operated by the Netherlands Foundation for Research in Astronomy (NFRA/ASTRON), with financial support by the Netherlands Organization for Scientific Research (NWO). H i has been detected by the WSRT in 49 galaxies. Details on observations and data reduction are described in Verheijen (1997).
An obvious advantage of using the UMa sample for this study is that all the member galaxies are at approximately the same distance. Therefore, the spatial resolution of the synthesis observations are constant for the whole sample. This simplifies the problem of assessing the influence of resolution on the determination of the CDDF and the comparison with the CDDF at high redshift.
The shape of the column density distribution function is determined by counting in each H i map the number of pixels per logarithmic bin of 0.1 dex in column density. The solid angle covered by pixels of a certain column density is then determined by multiplying the number of pixels with the angular pixel size which varies slightly from galaxy to galaxy.
The disadvantage of using a galaxy sample taken from a clear cosmic overdensity is that the CDDF is not automatically normalized. If we would naively assume that the Ursa Major cluster is a representative part of the nearby Universe, we would overestimate the normalization of the CDDF by roughly a factor of 12. This factor is obtained by comparing the H i mass function of the cluster with that of the field galaxy population (Zwaan et al. 1997). The shape of the Ursa Major mass function is indistinguishable from that of the field, but the normalization, , is larger by a factor of . Ideally, one would use a sample of galaxies with well understood selection criteria so that the normalization would occur automatically. Unfortunately, there are no such samples available for which H i synthesis observations with sufficient angular resolution have been performed. The HIPASS survey, a blind 21cm survey of the whole southern sky, will eventually yield a suitable galaxy sample for this purpose, if a representative subsample is followed up with the ATCA to obtain high spatial resolution maps.
There are several methods for normalizing the UMa CDDF. By assuming a local luminosity function (LF) or H i mass function (HIMF), each galaxy could be given a weight according to its absolute magnitude or H i mass. However, this method introduces extra uncertainty in the derived CDDF, due to uncertainties in the exact shape and normalization of the LF and the HIMF. Our preferred method of normalizing the CDDF is to scale the complete function, not the individual contributors to it. This can be achieved by scaling the integral H i mass density that is contained under the CDDF:
| (2) |
By means of a blind 21cm survey Zwaan et al. (1997) determined , a result that is in excellent agreement with earlier estimates based on optically selected galaxies. Note that dependencies on disappear in the final specification of the CDDF.
4 The Column Density Distribution Function
Figure 2 shows the CDDF determined from the 21cm observations of the Ursa Major sample. From left to right the function is shown for three different resolutions of the H i maps: , , and . The solid line is the determined CDDF; the dashed lines indicate the quality of the measured column densities. Each pixel in the H i maps has an estimate of the signal to noise level assigned to it. In the determination of the CDDF we calculated an average S/N level for each bin in column density by averaging the S/N ratios for the individual pixels. The dashed lines show the average errors on the column densities and should be interpreted as horizontal errorbars. Nonetheless, they clearly overestimate the real uncertainties on the CDDF as many pixels are used in each bin (2500 independent beams for full resolution). The lines merely serve as an indicator of the quality of the measurements at each resolution. The thin solid line represents the CDDF for a Gaussian model, where for and for higher column densities.
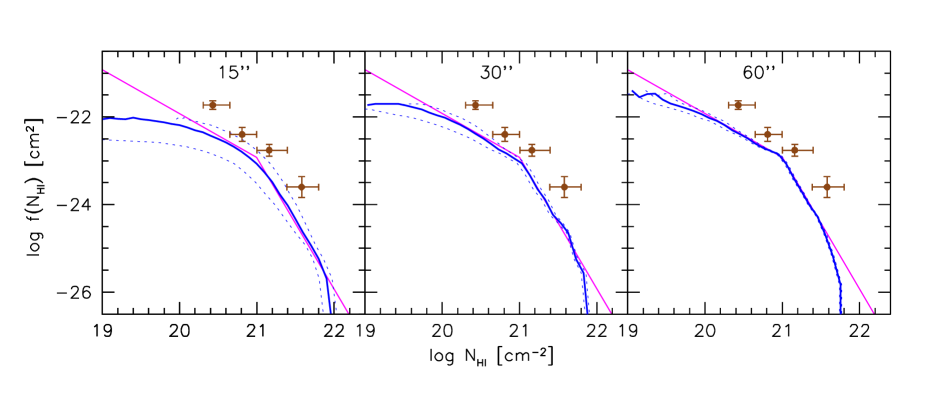
When comparing the CDDFs at different resolution, it appears that the highest resolution maps yield the smoothest CDDF. This occurs because there the measurements of column density have the lowest S/N ratios. The low resolution (but high S/N) CDDF is in excellent agreement with the Gaussian model for , but for higher column densities, the measured curve drops below the model since high column density peaks are smeared away. Going to higher resolutions leads to better agreement between the measured curve and the model for the highest , and at resolution the CDDF follows the distribution up to .
Besides beam smearing two other effects can cause a deviation from the function. Firstly, the calculations assume that the gaseous disks are infinitely thin. Observations show that the bulk of the H i indeed resides in a thin layer with axis ratio (Rupen 1991). The thin disk approximation is therefore valid for moderately inclined disks. However, the highest column densities in the models arise in highly inclined thin disks. A small degree of puffiness will prevent these high column densities from being observed. The second effect is H i self absorption. The theoretical calculation of the CDDF is based on the assumption that the optical depth of the neutral gas layer is negligible. Column densities much higher than the maximal column density in a face-on galaxy can only be seen in a highly inclined disk when the gas is optically thin. It is remarkable that the full resolution CDDF follows the line up to , well above the value where H i self absorption is normally assumed to set in. For example, Dickey & Lockman (1990) calculate that an H i cloud with and an FWHM velocity dispersion of becomes optically thick () at column densities .
Also shown in Figure 2 are the measurements of at high redshifts as determined by Storrie-Lombardi et al. (1997). We choose not to split up their high- sample in different redshift bins in order to get reasonable signal to noise. The median redshift of the total DL sample is . A value of has been used here. Lower values of would not significantly change the slope of but would decrease the normalization by approximately a factor of 2. Strong redshift evolution of the CDDF from to the present is apparent. The intersection cross-section for H i column density has decreased by a factor of 6 (factor 3 for ) from to . Higher column densities show a larger decrease, the evolution accounting for a factor of 10 (5 for ). Lanzetta et al (1995) report still stronger evolution of the higher column densities for higher redshift, although the highest column densities suffer from small number statistics and the effect is hardly seen by Storrie-Lombardi et al. (1997). The strong evolution of the higher column densities can be understood if gas consumption by star formation occurs most rapidly in regions of high neutral gas density (Kennicutt et al. 1994).
Rao & Briggs (1993) evaluated the CDDF at the present epoch by analyzing Arecibo observations of a sample of 27 galaxies with optical diameters in excess of . Double-Gaussian fits to the observed radial H i distribution were used to calculate . The disadvantage of this method is that the Gaussian fits automatically introduce the for low and for high . In the present study no modeling has been applied. The location of the change of the slope and the normalization are in excellent agreement between Rao & Briggs’ work and the Ursa Major determination.
5 Contribution of Low Surface Brightness Galaxies
It has been argued in the literature that low surface brightness (LSB) galaxies might contribute a considerable H i cross section. In particular, Linder (1998) explores a scenario in which the outskirts of galaxies are responsible for most of the cross section for low column density neutral gas (). She concludes that Ly absorber counts at low redshifts can be explained if LSB galaxies of moderate absolute luminosity with extended low density gas disks are included in the analysis. Contrary to this view, Chen et al. (1998) claim that extended disks of luminous galaxies can account for most of the observed Ly lines below . The contribution of dwarf and LSB galaxies to the cross section for high column density H i is also unclear. For instance, Rao & Turnshek (1998) show that there are no luminous spiral galaxies in the vicinity of the quasar OI 363 in which spectrum they identify two low- DL systems.
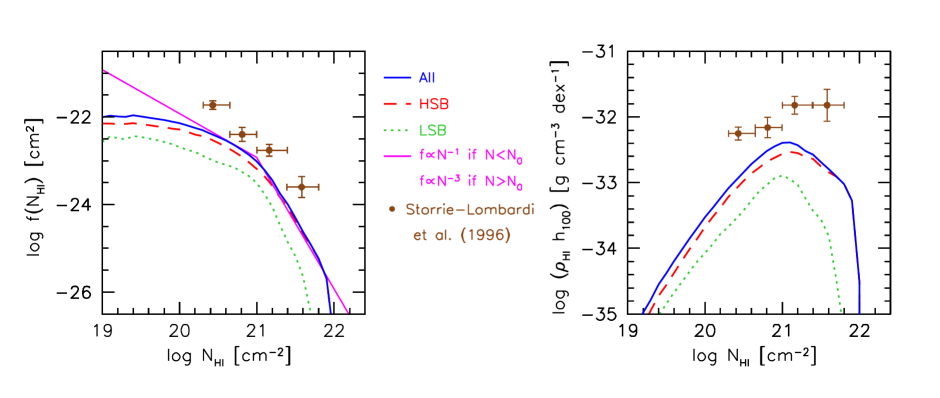
Here we evaluate the contribution of LSB galaxies to the cross section for high column density gas at . First we have to address the problem of completeness. The Ursa Major sample is essentially a magnitude limited sample. Selection effects against LSB galaxies are therefore to be expected. Tully & Verheijen (1997) discuss the completeness of the sample by plotting the observed central surface brightness against the exponential disk scale length. Theoretical approximations of the visibility limits seem to describe the boundaries of the observed sample satisfactorily. We apply the same visibility limits to the H i selected galaxy sample of Zwaan et al. (1997) to estimate what fraction of the H i mass density in the Ursa Major cluster could be missed in the present study. It appears that galaxies below the optical detection limits of our Ursa Major sample probably contain 10% of the total H i density of the cluster. Not surprisingly, most of this missed H i density resides in LSB galaxies. Following Tully & Verheijen (1997), the separation between LSB and HSB galaxies is made at an extrapolated central surface brightness of in the -band, which roughly compares to in the -band.
Figure 3 illustrates the contribution of LSB galaxies to the cross section for high column density gas, relative to the total galaxy population. We have corrected for the incompleteness by adding extra cross section for the LSB galaxies, equally over all column densities, in such a way that the mass density in these galaxies increases by an amount equal to 10% of the total H i density. The left panel shows the CDDF, the right panel shows the cosmological mass density of H i as a function of column density. The full resolution data are used. LSB galaxies do not make a significant contribution to the cross section for column densities higher than . Below that value they are responsible for approximately 25% of the cross section. The right panel shows that LSB galaxies make a minor contribution to the local neutral gas density, a conclusion very much in concordance with the results of Briggs (1997), Zwaan et al. (1997), Sprayberry (1998) and Côté et al. (1998).
6 Conclusions and Discussion
We have used the present knowledge of the nearby galaxy population to estimate the H i column density distribution function at . It is shown that undergoes strong redshift evolution from to the present, especially at the high column densities. The observed evolution in critically depends on whether the census of H i in the local Universe is complete. Surveys in H i and the optical indicate that the density of visible light and neutral gas is dominated by luminous, high surface brightness galaxies. The H i surveys routinely reach column density limits much lower than what is required to detect the counterparts of DL systems. Since H i mass functions published to date typically lose sensitivity below , the region of parameter space still open to hide a large amount of high column density gas is that of low H i masses. Observations to measure the space density of these small H i masses (H i clouds and extreme LSB dwarf galaxies) and to evaluate to what extent they contribute to the H i density and the CDDF of the local Universe are important next steps.
References
Briggs, F.H. 1997, ApJ, 484, 618
Chen, H.-W. Lanzetta, K.M., Webb, J.K., & Barcons, X. 1998, ApJ, 498, 77
Corbelli, E.& Salpeter, E. E. 1993, ApJ, 419, 104
Côté, S, Broadhurst, T., Loveday, J., & Kolind, S. 1998, astro-ph/9810470
Dickey, J.M. & Lockman, F.J. 1990, ARA&A, 28, 215
Haehnelt, M.G., Steinmetz, M., & Rauch, M. 1998, ApJ 495, 647
Hu, E.M., Kim, T.-S., Cowie, L.L., Songaila, A., & Rauch, M. 1995, AJ, 110, 1526
Kennicutt, R.C. 1998, ApJ, 498, 541
Khersonsky, V.K. & Turnshek, D.A. 1996, ApJ, 471, 657
Lanzetta, K.M., Wolfe, A.M., & Turnshek, D.A 1995, ApJ, 440, 435
Linder, S.M. 1998, ApJ, 495, 637
Maloney, P. 1993, ApJ, 414, 41
Milgrom, M. 1988, A&A, 202, L9
Prochaska, J.X. & Wolfe, A.M. 1997, ApJ, 487, 73
Rao, S., & Briggs, F. H. 1993, ApJ, 419, 515
Rupen, M.P. 1991, AJ, 102, 48
Smette, A., Claeskens, J.F., & Surdej, J. 1997, NewA, 2, 53
Sprayberry, D. 1998 these proceedings
Storrie-Lombardi, L.J., Irwin, M.J., & McMahon, R.G. 1996, MNRAS, 282, 1330
Tully, R.B., Verheijen, M.A.W., Pierce, M.J., Huang, J.S., & Wainscoat, R.J. 1996, AJ, 112, 2471
Tully, R.B. & Verheijen, M.A.W. 1997, ApJ, 484, 145
Tytler, D. 1987, ApJ, 321, 49
Verheijen, M.A.W. 1997, Ph.D. thesis, Univ. Groningen
Wolfe 1995, in QSO Absorption Lines, ed. G. Meylan
Zwaan, M.A., Briggs, F.H., Sprayberry, D., & Sorar, E. 1997, ApJ, 490, 173