Cosmic-Ray Positrons: Are There Primary Sources?
PSU-PAL-99-1
Stéphane Coutu,∗111Corresponding author: coutu@phys.psu.edu Steven W. Barwick,† James J. Beatty,∗ Amit Bhattacharyya,‡ Chuck R. Bower,‡ Christopher J. Chaput,§222Present address: Stanford Linear Accelerator, Stanford, California 94309, USA Georgia A. de Nolfo,∗333Present address: Department of Physics, Downs Laboratory, California Institute of Technology, Pasadena, California 91125, USA Michael A. DuVernois,∗ Allan Labrador,# Shawn P. McKee,§ Dietrich Müller,# James A. Musser,‡ Scott L. Nutter,⋆ Eric Schneider,† Simon P. Swordy,# Gregory Tarlé,§ Andrew D. Tomasch§ & Eric Torbet#444Present address: School of Natural Sciences, Institute for Advanced Study, Princeton, New Jersey 08540, USA
∗Departments of Physics and of Astronomy and Astrophysics, Davey Laboratory, Pennsylvania State University, University Park, Pennsylvania 16802, USA
†Department of Physics, University of California at Irvine, Irvine, California 92717, USA
‡Department of Physics, Swain Hall West, Indiana University, Bloomington, Indiana 47405, USA
§Department of Physics, Randall Laboratory, University of Michigan, Ann Arbor, Michigan 48109-1120, USA
#Enrico Fermi Institute and Department of Physics, University of Chicago, Chicago, Illinois 60637, USA
⋆Department of Physical Sciences, Eastern New Mexico University, Portales, New Mexico 88130, USA
Abstract
Galactic cosmic rays consist of primary and secondary particles. Primary cosmic rays are thought to be energized by first order Fermi acceleration processes at supernova shock fronts within our Galaxy. The cosmic rays that eventually reach the Earth from this source are mainly protons and atomic nuclei, but also include electrons. Secondary cosmic rays are created in collisions of primary particles with the diffuse interstellar gas. They are relatively rare but carry important information on the Galactic propagation of the primary particles. The secondary component includes a small fraction of antimatter particles, positrons and antiprotons. In addition, positrons and antiprotons may also come from unusual sources and possibly provide insight into new physics. For instance, the annihilation of heavy supersymmetric dark matter particles within the Galactic halo could lead to positrons or antiprotons with distinctive energy signatures. With the High-Energy Antimatter Telescope (HEAT) balloon-borne instrument, we have measured the abundances of positrons and electrons at energies between 1 and 50 GeV. The data suggest that indeed a small additional antimatter component may be present that cannot be explained by a purely secondary production mechanism. Here we describe the signature of the effect and discuss its possible origin.
PACS codes: 95.30.Cq, 95.85.Ry, 96.40.Cd, 96.40.De
Keywords: cosmic ray sources, positrons, electrons, supersymmetric dark matter, giant molecular clouds
1 Introduction
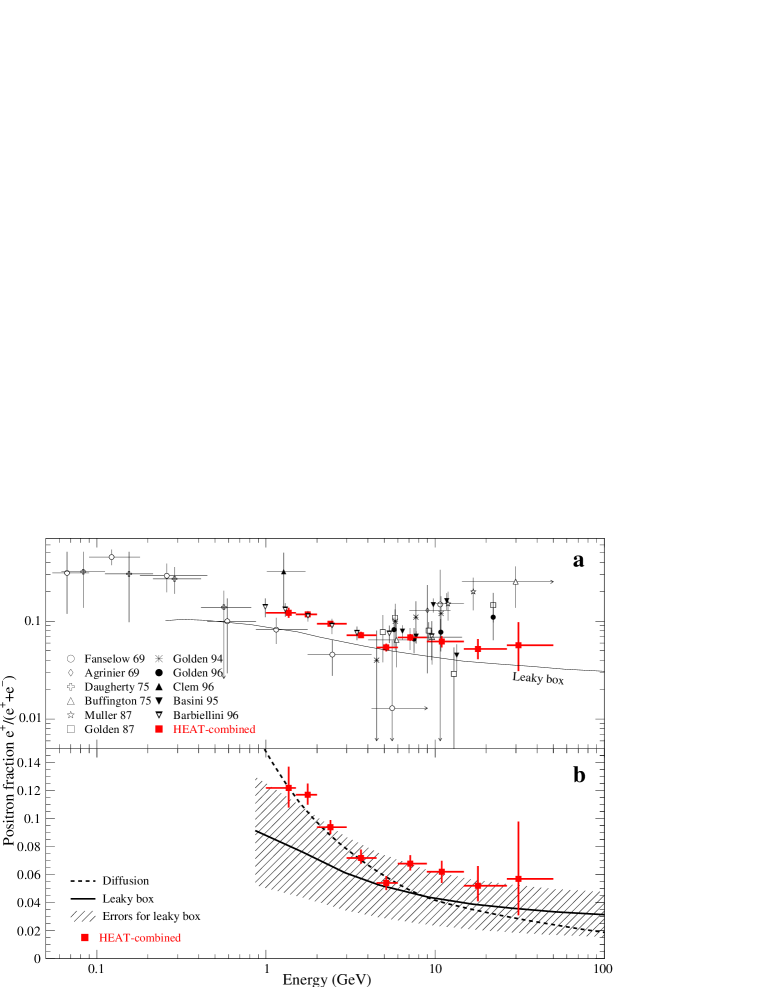
Over the last 30 years, a number of efforts have been aimed at the study of cosmic-ray electrons and positrons with balloon-borne instruments. At energies between about 1 and 10 GeV, early measurements [buf:pos (1, 2)] found that the “positron fraction” e+/(e++e-) is essentially in agreement with a prediction [pro:pos (3)] where all positrons are assumed to be of secondary origin, and propagate according to the prescription of the simple “leaky-box” model of the Galaxy. This is illustrated in Figure 1a, which shows a compilation of measurements [buf:pos (1, 2, 4)-bar:apjl (13)] of the positron fraction as a function of energy between 0.05 GeV and 50 GeV. The leaky-box prediction is shown as a solid curve. At energies around 10 GeV and above, as shown in Figure 1a, several measurements [agr:pos (4, 6, 7)] reported a significant excess of positrons over the fraction expected from secondary sources. This spurred a number of interpretations, ranging from inefficient production of primary electrons at high energies [bou:pos (14, 15)], to hypothetical new sources of positrons [aha:pos (16)-tyl:pos (23)].
The HEAT balloon-borne instrument was designed and optimized to improve the accuracy with which cosmic-ray electrons and positrons at energies from about 1 to 50 GeV can be detected. The instrument and its performance during two balloon flights in 1994 and 1995, respectively, are described in detail elsewhere [bar:apjl (13, 24)-bar:prl (26)]. A compilation of positron fraction measurements is shown in Figure 1a, where the HEAT results from the two flights combined are shown as filled squares. The overall proton rejection factor achieved was nearly 105. Backgrounds due to atmospheric secondary electrons and positrons were estimated by Monte-Carlo techniques, and compared with measured growth curves [heat:apj (24)]. Such backgrounds amounted to 1-2%, and 20-30% of the total electron and positron signals, respectively. The uncertainty in the secondary corrections translated in a systematic uncertainty of in the positron fraction, comparable to the statistical uncertainty; however, any systematic error in the correction would affect all data similarly, resulting in an overall normalization shift in the positron fraction distribution, preserving any structure observed.
2 Secondary Production
The HEAT results shown in Figure 1a did not confirm the previously-reported rise in the positron fraction starting at about 10 GeV. However, the data deviate from the predictions of a purely secondary production mechanism in two ways. First, at energies below about 5 GeV the positron fraction was in excess of the expectations. For this low-energy energy region, another recent measurement [bar:cap (12)] also reported a positron fraction that was significantly higher than measured in the 1960’s and 1970’s. A possible explanation of this effect would come from a solar modulation mechanism that depends on the charge sign of the particle and changes from one solar cycle to the next [cle:pos (10)].
The second feature of the HEAT results is an indication of some structure in the energy dependence of the positron fraction above 7 GeV. This cannot be easily explained in terms of conventional secondary production mechanisms. As shown in Figure 1b, a slight enhancement in the positron fraction between about 7 and 20 GeV is observed, which may suggest a primary source of high-energy positrons. This feature appears in the HEAT data from each flight taken separately. Figure 1b shows two predictions for interstellar secondary production in the energy region of interest. First, the leaky-box prediction [pro:pos (3)] is shown as a solid red curve. A band of uncertainty in this prediction due to the various uncertainties on the parameters of the model and that of the overall normalization is indicated (hatched area). In this model, the spectrum of cosmic-ray positrons from secondary sources is calculated in the leaky-box approximation from:
| (1) |
where is the mean cosmic-ray age at energy , related to the rigidity-dependent mean Galactic escape length, is the mean density of interstellar nuclei, is the rate of production of positrons in interstellar nuclear interactions, and is the rate of energy loss from synchrotron, inverse Compton, bremsstrahlung, and ionization processes. The positron fraction is obtained by dividing the predicted positron spectrum by the measured all-electron spectrum. A more recent calculation [str:pos (27)], shown as a dashed curve in Figure 1b, uses a more realistic Galactic diffusion model to predict the positron fraction from secondary production. Qualitatively, it predicts the same behavior, a smooth, monotonic decrease of the positron fraction without spectral features. The HEAT data cannot be well fit by the secondary-production curves of Figure 1b. The confidence level for the leaky-box prediction is essentially zero (=96.5 for 9 degrees of freedom), while that for the diffusion prediction is 0.9% (after adjustments to take into account statistical runs in the data [roe:pro (28)]). Although the band of uncertainty in the predictions is wide, all smooth curves within it yield a similarly poor agreement with the data. If the structure seen in the data is real, it would indicate the onset of something new, such as an exotic source of high-energy positrons. Here we consider several possible models.
3 Sources of Primary Cosmic-Ray Positrons
3.1 Annihilating Dark Matter WIMPs
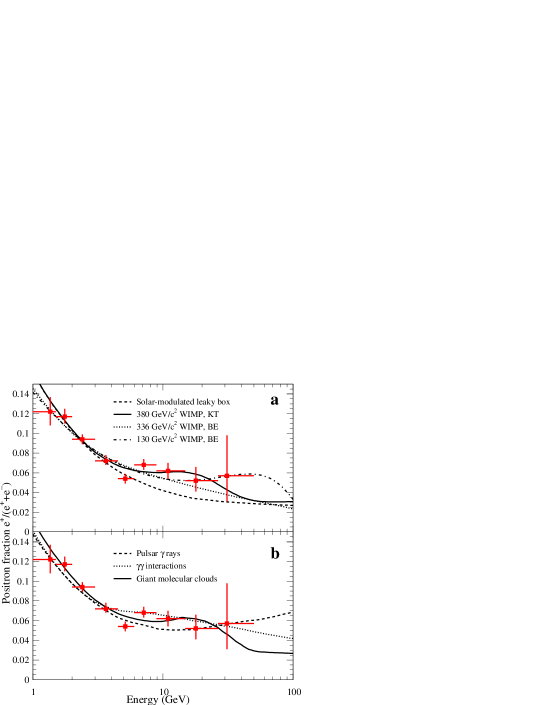
First, it has been proposed that annihilating Galactic-halo dark-matter WIMPs (Weakly-Interacting Massive Particles) are a source of high-energy positrons [tur:ind (20, 22, 23, 29, 30)]. As most dark matter candidates are Majorana particles, direct annihilation into e+e- pairs is suppressed. In order to account for an observable e+e- line, a large total WIMP annihilation cross-section is required. The WIMP density would then likely be low and not a major contributor to the present-day cosmological mass density [tyl:pos (23)]. One exception is a model by Kamionkowski and Turner (hereafter referred to as KT) [tur:ind (20)] in which WIMPs with mass m greater than 80 GeV/c2 or 91 GeV/c2 can annihilate through resonant production of W+W- or Z0Z0 pairs. The resulting electrons and positrons are propagated in a leaky-box model. The model predicts enhancements in the positron fraction near energies of m/2 (due to direct decays of the gauge bosons into e±), and m/20 (continuum radiation due to more complex decay chains through intermediate production of , , quarks, etc.). If the experimental feature we observe is real, it could be a signature for the low-energy continuum radiation peak at around m/20. Figure 2a shows a comparison of the positron fraction we have measured with the HEAT instrument and a model prediction including a WIMP-annihilation contribution. On the figure, the dashed curve is a baseline secondary production distribution. To this baseline, we add a contribution from annihilating dark matter neutralinos [tur:ind (20)] of various masses, with an amplitude factor left as a fit parameter. This amplitude factor is highly uncertain in the model, owing to a combination of large uncertainties in the WIMP annihilation details and the astrophysical parameters. The best-fit curve is shown as a solid line in Figure 2a, and occurs for a neutralino mass of 380 GeV/c2. The best-fit WIMP source strength is 1.8 times greater than the estimated amplitude of the effect in the model, well within the uncertainties in the prediction. The fit results are summarized in Table 1. The resulting confidence level of 74% is markedly better than for fits to strictly secondary production models.
In recent work by Baltz and Edsjö (hereafter referred to as BE) [bal:ind (30)], positron production by annihilating dark matter neutralinos is revisited, and a large fraction of the Minimal Supersymmetric Standard Model (MSSM) parameter space is sampled. Again, decays and/or hadronization of the annihilation products are simulated, and positron fluxes calculated, but a more complex diffusion model than in the KT scenario is used for the propagation of the electrons and positrons. Here again, the predicted enhancement in the positron fraction is allowed to be renormalized by a factor that is obtained by fitting to the HEAT data. Two typical resulting best fit curves are shown in Figure 2a, as dotted and dot-dash curves for 336 or 130 GeV/c2 neutralinos, respectively (for details of assumed MSSM parameters for these and other models, see [bal:ind (30)]), and the fit results are summarized in Table 1. Once again, an improvement is obtained compared to secondary models, but the resulting confidence levels of 22% and 42% are not as high as the best-fit KT model; this is mainly a result of the different propagation model used.
3.2 Pair Creation Near Discrete Sources
Second, primary positrons could arise when e+e- pairs are created by electromagnetic processes, for instance through the conversion of high-energy rays in the polar cap region of Galactic radio pulsars [har:pos (19)]. In this model, the positron production rate of equation (1) is replaced by:
| (2) |
where is given in terms of the Galactic pulsar birth rate (in units of 30 yr), the effective time during which the pulsar emits rays (in units of yr), the ratio of positrons escaping the pulsar per ray produced, and the total interstellar mass (in units of solar masses), by:
| (3) |
By enhancing the baseline positron fraction from secondary sources with this kind of contribution, with left as a fit parameter, we obtain the best-fit curve shown as a dashed line in Figure 2b, with , comparable to reasonable expectations [har:pos (19)]. The fit results are summarized in Table 1. Although the resulting confidence level of 50% is larger than that for purely secondary sources, the shape of the enhancement, a slow monotonic rise with energy, is not as compatible with the data as the local-enhancement effect obtained with some WIMP-annihilation models. This model predicts that the positron fraction should rise with energy beyond 10 GeV, reaching an asymptotic value of 0.5. This could be verified with measurements extending to higher energies.
Another electromagnetic process would be the interaction of very high-energy rays with optical and/or UV radiation in the vicinity of discrete sources [aha:pos (16)], resulting in e± pair production. In this scenario, the positron production rate of equation (1) becomes:
| (4) |
where is the threshold energy for gamma rays interacting with ambient photons with characteristic energy , , is the optical depth accumulated by the gamma ray before escaping the source (a free parameter), and the numerical factor is calculated from formulas assuming a gamma-ray power-law index . By adding a primary positron component from this effect to the baseline from secondary sources, assuming various mean values for the parameter and allowing the strength of the source to remain a free parameter, we obtain the best-fit curve shown as a dotted line in Figure 2b. The best fit occurs for eV, as summarized in Table 1, which is in agreement with reasonable expectations [aha:pos (16)], and requires a relatively weak source strength. The resulting confidence level of 75% is once again better than that for purely secondary sources.
3.3 Positron Production in Giant Molecular Clouds
A third possibility is the generation of electrons and positrons in hadronic processes. In one model [dog:pos (18)], hadronic cosmic rays can enter and interact within giant molecular gas clouds, resulting in the secondary generation of mostly and , which ultimately decay into muons, and thereafter into electrons and positrons. Fermi reacceleration due to fluctuations in the magnetic field in the turbulent gas could then boost the energy of the e±. In this model, if the typical field strength in the cloud is and the minimum turbulence scale is , a characteristic magnetization momentum is defined. Particles with momentum greater than tend to escape the cloud, so that the spectrum of particles accelerated inside the cloud shows an enhancement near . For reasonable choices for the parameters in the model, it is possible to obtain GeV/c, and a positron fraction curve is obtained with an enhancement starting near 10 GeV. If we add to the baseline secondary positron fraction such a primary component from giant molecular clouds, and allow the strength of the effect to be a free parameter, the resulting best fit is the solid curve of Figure 2b. A relatively weak source is sufficient (see Table 1) to fit the data with a confidence level of 80%.
3.4 Other Positron Sources
Other primary positron sources have been suggested as well. For example, e+e- pair production in the magnetosphere of pulsars could be followed by particle acceleration to relativistic energies in the pulsar wind driven by low-frequency electromagnetic waves [chi:pos (17)]. Or else radionuclei such as 56Co ejected during a supernova blast, possibly followed by shock acceleration in the envelope [ski:pos (21)], could result in an enhanced high-energy positron population. The uncertainties in the models and in the data are such that none of these models can yet be ruled out.
4 Conclusions
In conclusion, the HEAT positron measurements indicate a subtle feature, which cannot be caused by the atmospheric corrections applied to the data or any other known systematic effect. If confirmed by future measurements, this feature could be evidence for a new exotic source of positrons, especially at energies beyond about 7 GeV. The exact nature of this source cannot be determined until higher-statistics measurements of the positron fraction near 10 GeV, as well as extensions of the measurements to energies beyond 50 GeV, become available. All models proposed and discussed here are unconventional if not contrived. Only through detailed studies of the exact shape of the spectral features in the positron fraction can we expect to determine which, if any, of the models offers the correct description.
Acknowledgements
We are grateful to M. Kamionkowski for providing us with his computer code for calculating positron-fraction enhancements from annihilating WIMPs. This work was supported by NASA and by financial assistance from our universities.
References
- (1) [1] A. Buffington, C. D. Orth, G. F. Smoot, Astrophys. J. 199 (1975) 669.
- (2) [2] J. L. Fanselow, R. C. Hartman, R. H. Hildebrand, P. Meyer, Astrophys. J. 158 (1969) 771.
- (3) [3] R. J. Protheroe, Astrophys. J. 254 (1982) 391.
- (4) [4] B. Agrinier et al., Lett. Nuovo Cimento 1 (1969) 53.
- (5) [5] J. K. Daugherty, R. C. Hartman, P. J. Schmidt, Astrophys. J. 198 (1975) 493.
- (6) [6] D. Müller, K. Tang, Astrophys. J. 312 (1987) 183.
- (7) [7] R. L. Golden et al., Astron. & Astrophys. 188 (1987) 145.
- (8) [8] R. L. Golden et al., Astrophys. J. 436 (1994) 769.
- (9) [9] R. L. Golden et al., Astrophys. J. 457 (1996) L103.
- (10) [10] J. M. Clem et al., Astrophys. J. 464 (1996) 507.
- (11) [11] G. Basini et al., Proc. of the 24th Int. Cosmic-Ray Conf. (Rome) 3 (1995) 1.
- (12) [12] G. Barbiellini et al., Astron. & Astrophys. 309 (1996) L15.
- (13) [13] S. W. Barwick et al., Astrophys. J. 482 (1997) L191.
- (14) [14] A. Boulares, Astrophys. J. 342 (1989) 807.
- (15) [15] K. K. Tang, D. Müller, Proc. of the 20th Int. Cosmic-Ray Conf. (Moscow) 2 (1987) 88.
- (16) [16] F. A. Aharonian, A. M. Atoyan, J. Phys. G 17 (1991) 1769.
- (17) [17] X. Chi, K. S. Cheng, E. C. M. Young, Astrophys. J. 459 (1996) L83.
- (18) [18] V. A. Dogiel, G. S. Sharov, Astron. & Astrophys. 229 (1990) 259.
- (19) [19] A. K. Harding, R. Ramaty, Proc. of the 20th Int. Cosmic-Ray Conf. (Moscow) 2 (1987) 92.
- (20) [20] M. Kamionkowski, M. S. Turner, Phys. Rev. D 43 (1991) 1774.
- (21) [21] J. G. Skibo, R. Ramaty, Proc. of the 23rd Int. Cosmic-Ray Conf. (Calgary) 2 (1993) 132.
- (22) [22] M. S. Turner, F. Wilczek, Phys. Rev. D 42 (1990) 1001.
- (23) [23] A. J. Tylka, Phys. Rev. Lett. 63 (1989) 840.
- (24) [24] S. W. Barwick et al., Astrophys. J. 498 (1998) 779.
- (25) [25] S. W. Barwick et al., Nucl. Instr. & Meth. 400 (1997) 34.
- (26) [26] S. W. Barwick et al., Phys. Rev. Lett. 75 (1995) 390.
- (27) [27] I. V. Moskalenko, A. W. Strong, Astrophys. J. 493 (1998) 694.
- (28) [28] B. P. Roe, Probability and statistics in experimental physics (Springer-Verlag, New York, 1992).
- (29) [29] G. Jungman, M. Kamionkowski, K. Griest, Phys. Rep. 267 (1996) 195.
- (30) [30] E. A. Baltz, J. Edsjö, Phys. Rev. D 59 (1999) 023511.
| Model | Fit parameter | Source amplitude factor | Confidence level |
|---|---|---|---|
| KT WIMPs | m GeV/c2 | 74% | |
| BE WIMPs | m GeV/c2 | 11.7 | 22% |
| BE WIMPs | m GeV/c2 | 54.6 | 42% |
| Pulsar rays | 50% | ||
| interactions | eV | 75% | |
| Giant molecular clouds | 80% |
The “source amplitude factor” is an arbitrary normalization that indicates the best-fit strength of the effect compared to the one predicted by the authors of the model.