Far-UV and deep surveys: bursting dwarfs versus normal galaxies
Abstract
Galaxy counts from bright ultraviolet (UV) and deep optical spectroscopic surveys have revealed an unexpectedly large number of very blue galaxies (vBG). The colors and luminosities of these objects indicate that they are dwarf galaxies undergoing bursts of star formation. We use a galaxy evolution model (pégase, Fioc & Rocca-Volmerange 1997, hereafter FRV) to describe this population as galaxies undergoing cyclical bursts of star formation, thereby determining the luminosity function (LF) of these galaxies.
When these bursting galaxies are added to normally evolving populations, the combination reproduces the UV number counts, color distributions and deep optical redshift distributions fairly well. Optical (including the Hubble Deep Field) and near-infrared number counts are fitted assuming an open or a flat, -dominated, Universe. The high amplitude of the angular correlation function of very blue galaxies discovered by Landy et al. (1996) is also recovered in this modelling.
The number of bursting galaxies is only a small fraction of the total number of galaxies at optical and near-infrared wavelengths, even at faintest magnitudes. In our evolution modelling, normal galaxies explain most of the blue excess in a low- Universe. The problem of the blue excess remains in a flat Universe without a cosmological constant.
Key Words.:
galaxies: evolution – galaxies: starburst – galaxies: luminosity function, mass function – ultraviolet: galaxies – cosmology: miscellaneous1 Introduction
The apparent excess of the number of galaxies at faint magnitudes in the blue, relative to predictions of non-evolving models, is a long-standing problem of cosmology (Koo & Kron 1992). Pure luminosity evolution (PLE) scenarios fitting the colors of nearby galaxies reproduce the optical and near-infrared observations for an open Universe (Guiderdoni & Rocca-Volmerange 1990; Pozetti et al. 1996; Fioc 1997) or for a flat, -dominated, one (Fukugita et al. 1990; Fioc 1997). To solve the problem of the blue excess in a flat, , Universe, various solutions were proposed as a strong number density evolution of galaxies via merging (Rocca-Volmerange & Guiderdoni 1990; Broadhurst et al. 1992), a very steep luminosity function (Driver et al. 1994) or a population of fading dwarf galaxies (Babul & Rees 1992; Babul & Ferguson 1996; Campos 1997).
Determining the distance of these galaxies is crucial to understand their nature: they should be relatively high-redshift, intrinsically bright galaxies according to PLE scenarios, and low-redshift, intrinsically faint galaxies in other cases. Despite the very faint magnitudes now reached in the optical by the Hubble Space Telescope (Hubble Deep Field (HDF), Williams et al. 1996) or in the near-infrared (e.g. Moustakas et al. 1997), and the advent of complete, deep spectroscopic surveys (Lilly et al. 1995; Cowie et al. 1996), the question of the blue excess is still open (Ellis 1997).
Far-UV studies can throw new light on this problem. By analyzing bright data at 2000 Å from the balloon experiment FOCA2000, Armand & Milliard (1994) showed that the galaxy number-magnitude counts predicted with classical optical luminosity functions and typical UV-optical colors as a function of morphology are deficient by a factor 2 relatively to the observations. Moreover, the color distribution indicates that this excess is due to very blue galaxies (). A question immediately arises: is the UV excess related to the blue excess? Gronwall & Koo (1995) introduced non-evolving populations of faint very blue galaxies, contributing significantly to faint counts in order to find the luminosity function (LF) that best fitted the observational constraints. A similar population was proposed by Pozzetti et al. (1996), but with a much smaller contribution, in order to fit the color distributions. However, very blue colors require that individual galaxies are bursting and are therefore rapidly evolving. By modelling the spectral evolution of these galaxies taking in consideration post-burst phases, Bouwens & Silk (1996) concluded that the LF adopted by Gronwall & Koo (1995) leads to a strong excess of nearby galaxies in the redshift distribution and that vBG may not be the main explanation of the blue excess. Such a conclusion was also drawn by Koo (1990).
In this paper we combine the findings of recent deep surveys with the new UV data (Sect. 2) in order to develop a model of vBG and to determine their luminosity function (Sect. 3). We then discuss their contribution to faint galaxy counts (Sects. 4 and 5), depending on the cosmology.
2 Observational evidence for very blue galaxies
In contrast with the so-called ‘normal’ galaxies of the Hubble sequence, which are supposed to form at high redshift with definite star formation timescales as in FRV, bursting galaxies evolve rapidly without clear timescales. In the red post-burst phases they might be indistinguishable from normal slowly evolving galaxies. However they can be identified during their bluest, bursting phase, allowing determining their evolution and number density.
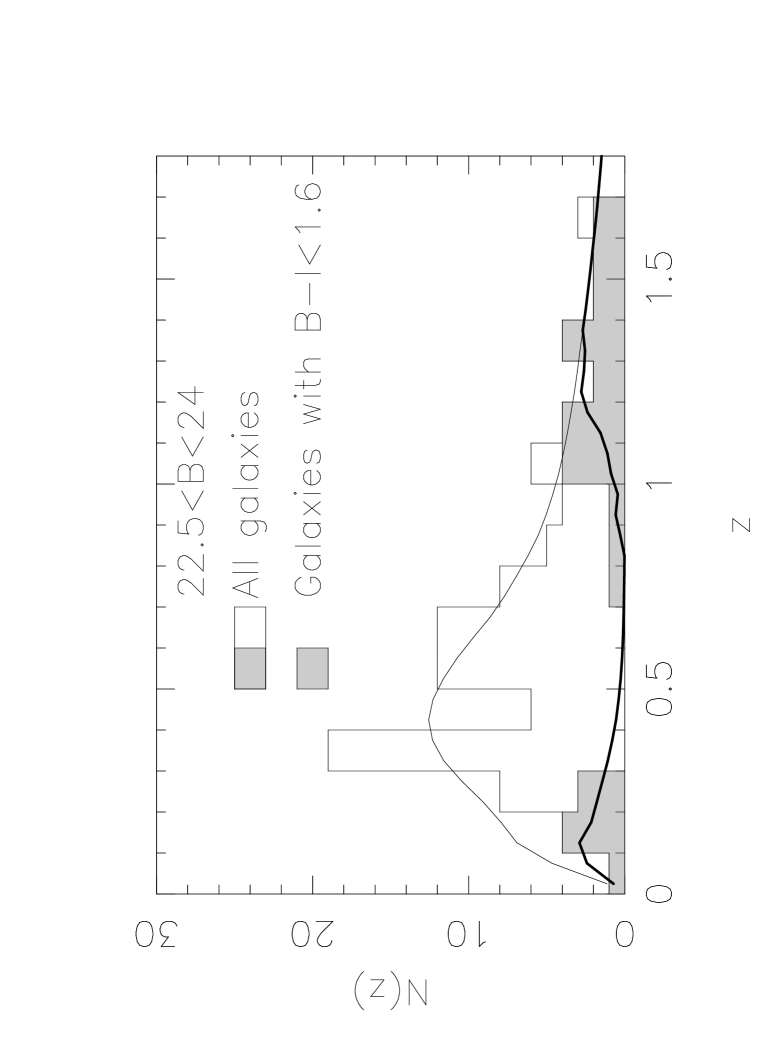
The existence of a population of galaxies much bluer than normal and classified as starbursts has been recently noted at optical wavelengths by Heyl et al. (1997, hereafter HCEB). At fainter magnitudes (), the Cowie et al. (1996) deep survey has revealed two populations of blue () galaxies (Figs. 1 and 7).

Normal star forming galaxies, as predicted by standard PLE models, are observed at high redshift (), but another clearly distinct population of blue galaxies is identified at . Some of these galaxies are very blue. This second population was previously observed in the brighter survey () of Colless et al. (1993) and was thought to be the cause of the blue excess, in the absence of high-redshift galaxies. More recently, Roche et al. (1997) observed two kinds of blue galaxies at : a population with a number density in agreement with PLE models, and a subset of vBG with small angular sizes.
The best constraint on vBG comes from the far-UV (2000 Å) bright counts observed with the balloon experiment FOCA2000 (Armand & Milliard 1994). By using a standard optical LF, the authors obtain a strong deficit of predicted galaxies in UV counts across the magnitude range () and argue in favor of a LF biased toward later-type galaxies.

In FRV, we used the LF of Marzke et al. (1994), while here we prefer to adopt the LF of HCEB as it contains a higher fraction of star-forming galaxies, favoring a better fit to the data. Even with this new LF, the star formation scenarios proposed in FRV predict the same factor of 2 deficit in UV counts (Fig. 2, dashed line) as that found by Armand & Milliard (1994). This is despite the rather high normalization of the LF to the bright multispectral galaxy counts of Gardner et al. (1996) and Bertin & Dennefeld (1996) (see the discussion in FRV). Moreover, the predicted color distributions show a clear lack of blue galaxies, notably of those with (Fig. 2, dashed lines). A 10 Gyr-old galaxy forming stars at a constant rate, would only have . Although lowering the metallicity of the models may lead to bluer colors (Fioc & Rocca-Volmerange 1998, in preparation), they will still be too red to explain the data. A population of bursting galaxies is clearly needed to explain UV counts and the Cowie et al. (1996) data.
3 Modelling very blue galaxies
3.1 Star formation scenario
Galaxies can have very blue colors either if they are very young or if they are undergoing enhanced star formation. Two kinds of models have been advanced by Bouwens & Silk (1996) to maintain a population of vBG over a wide range of redshifts. In the first one, new blue galaxies form continuously, leaving red fading remnants, whereas in the second, star formation occurs recurrently. The second scenario has both observational and theoretical support and is adopted in the following. Smecker-Hane et al. (1996) concluded to an episodic star formation rate (SFR) from the analysis of the stellar populations observed in the Carina dwarf spheroidal galaxy. Recurrent star formation may also provide an attractive explanation of the existence of various types of dwarf galaxies, as proposed by Davies & Phillips (1988): blue compact dwarfs may correspond to bursting phases and dwarf irregulars to quiescent ones. According to the stochastic self propagation star formation theory (Gerola et al. 1980), episodic star formation may be a common phenomenon (Comins 1984). Such a behavior should be more frequent in dwarf galaxies than in giant galaxies, since the probability of propagation of star formation increases with galaxy mass (Coziol 1996). The feedback of massive stars on the interstellar medium via supernovae and winds may also lead to oscillations of the SFR (Wiklind 1987; Firmani & Tutukov 1993; Li & Ikeuchi 1988). Finally, in the models where the SFR is controlled by the interactions with the environment (Lacey et al. 1993), the lower frequency of interactions of dwarf galaxies may result in an episodic star formation.
For the sake of simplicity, we assume that all bursting galaxies form stars periodically. In each period, a burst phase with a constant SFR and the initial mass function (IMF) of Rana & Basu (1992) used in FRV for normal galaxies is followed by a quiescent phase without star formation. We do not apply any extinction to these galaxies. Because they are dwarf, we expect them to have a low metallicity and, therefore, to suffer little extinction (Heckman et al. 1996). Moreover, the extinction law (Calzetti et al. 1995), the respective distributions of the dust and stars (Gordon et al. 1997) and the ability of dwarf galaxies to retain the metals expelled by dying stars (e.g. Dekel & Silk 1986), as well as the dilution factor of these ejecta in the interstellar medium, are still under debate. Neglecting the extinction is clearly a critical assumption, but also a conservative one since any extinction would redden the spectrum and force us to adopt more extreme star formation parameters to recover very blue colors. For the same reason, we do not consider the hypothesis of a low upper mass cut-off of the IMF, which has been suggested by Doyon et al. (1992), but is controversial (Lançon & Rocca-Volmerange 1996, Vacca et al. 1995). In the opposite, an IMF enriched in massive stars, either because of a flatter slope or because of a high lower mass cut-off, as advocated for some starbursts (Puxley 1991, Rieke et al. 1993), is more attractive since burst phases will be bluer. Recent studies (Calzetti 1997, Scalo 1997, Massey & Armandroff 1995) seem actually to favor a rather standard IMF, though maybe slightly flatter at high mass than the one used in FRV. Such an IMF, e.g. Salpeter (1955), may indeed provide a better fit to the UV data (Fig. 2, dotted line) than our standard IMF (Rana & Basu 1992, solid line). The Salpeter IMF however gives very similar results for other galaxy counts and even slightly overpredicts the color distribution of HDF galaxies in the blue. For this reason, and also to preserve the consistency with that of normal galaxies, we prefer in the following to adopt the Rana & Basu IMF for all galaxies.
A good agreement with observational constraints is obtained with 100 Myr-long burst phases occurring every 1 Gyr. Surprisingly, similar values were adopted by Olson & Peña (1976) to fit the colors of the Small Magellanic Cloud. One should however be aware that these values are very uncertain, depending particularly on the metallicity of stars, and are simply mean values aimed at reproducing the color distribution.
3.2 Luminosity function
Because bursting galaxies evolve very rapidly and have thus a large variety of luminosities and colors at every redshift, we distribute them in subtypes as a function of the time elapsed since the beginning of the last burst. The LF of each subtype is derived from the SFR function that we parameterize, by analogy with the LF of normal galaxies, as
The lack of vBG at in the Cowie et al. (1996) redshift distribution (Fig. 7) strongly constrains the LF. This deficit may be interpreted in two ways. Either bursting galaxies formed only at low redshifts (), or the lack of vBG may correspond to the exponential cut-off of the adopted Schechter function. Physical arguments for low redshifts of galaxy formation are weak. Scenarios invoking a large population of blue dwarf galaxies, as proposed by Babul & Rees (1992), generally predict a higher redshift of formation (). Adopting the second explanation, we get (for ) for the overall LF of bursting galaxies at and can constrain the other parameters. A steep LF extending to very faint magnitudes leads to a large local () excess in the redshift distribution (Bouwens & Silk 1996; Driver & Phillips 1996). A steep slope () is only necessary to reconcile predicted number counts with observations in a flat Universe. A shallower slope is possible in other cosmologies. In the following, we adopt for bursting galaxies. Note that this translates into a steeper slope of the LF (), as already noticed by Hogg & Phinney (1997) for bursts. The LF is normalized to agree with the UV counts and the Cowie et al. (1996) redshift distribution. Table 1 gives the parameters of the SFR function and those of a Schechter fit to the corresponding luminosity function from to .
| Galaxy type | |||
|---|---|---|---|
| E | -20.02 | -1. | |
| S0 | -20.02 | -1. | |
| Sa | -19.62 | -1. | |
| Sb | -19.62 | -1. | |
| Sbc | -19.62 | -1. | |
| Sc | -18.86 | -1. | |
| Sdm | -18.86 | -1. | |
| Bursting galaxies | -16.99 | -1.73 | |
| Bursting galaxies | -1.3 |
4 Galaxy counts
Predictions of galaxy counts, with the bursting population added to normal galaxies, have been computed in three cosmologies: an open Universe (), a flat Universe (), and a flat, -dominated, Universe (). The value of is chosen in each cosmology in order to obtain a 13 Gyr-old Universe.
The spectral evolution of normal galaxies is modelled as in FRV111A constant SFR is assumed for Sd-Im galaxies. and takes into account the stellar emission, the nebular emission and the extinction. A star formation scenario fitting the observed optical to near-infrared spectral energy distribution of nearby templates is adopted for each Hubble type, with a star formation timescale increasing from the early to the late-types. The age of each scenario determines the redshift of formation ( for spheroidals and early-spirals, and for late-spirals).
Especially important for predicting galaxy counts (e.g. Pozetti et al. 1998) is the fact that all the light shortward of the Lyman break is absorbed, either by the gas or by the dust surrounding star-forming regions, in agreement with the observations of the Lyman continuum by Leitherer et al. (1995). For high- galaxies, this feature is redshifted in the optical and produces UV-dropouts (see Fig. 3) similar to those observed in the HDF (Steidel et al. 1996, Madau et al. 1996). Although such UV-dropouts are also caused by the intergalactic medium (Madau 1995), the predicted counts will essentially be the same. We neglect the depression of the spectrum between 912 Å and 1215 Å due to the blanketing opacity of Lyman series lines. At , the absorption shortward of 912 Å is by far more important, as evidenced by the figure 3 of Madau et al. (1996). Only 20 % of the galaxies are at higher redshift at , according to our predictions, and neglecting the additional absorption in the [912 Å, 1215 Å] wavelength range should not change significantly the predictions.

To ensure consistency with HCEB’s LF, the LF of ‘normal’ galaxies is constructed in the following way: bursting galaxies are classified into the three broad spectral types defined by HCEB, according to their [O ii] equivalent width. For each class, the LF of ‘normal’ galaxies is then added to that of bursting galaxies and its parameters (assuming ) are fitted to the local step-wise LF of HCEB. We prefer to use the step-wise LF, as the Schechter parameterization of HCEB as a function of redshift poorly fits the data near at . Characteristics of the LF finally adopted are given in Table 1.

Galaxy counts, color and redshift distributions at bright UV magnitudes are plotted on Figs. 2 and 4 and compared to the data of Armand & Milliard (1994) and the preliminary results of Treyer et al. (1998). An open Universe is adopted for bright counts, which anyway depend weakly on cosmology. Though faint in the blue, bursting galaxies contribute strongly to the UV bright counts thanks to their blue colors, improving significantly the fits to the UV number-magnitude counts and color distributions (Fig. 2, solid lines). The agreement with the redshift distribution of Treyer et al. (1998) is also reasonably good (Fig. 4).

The geometry of the Universe becomes important at fainter magnitudes. Galaxy counts in , , , and , redshift and color distributions are plotted on Fig. 5, 6, 7, 8 and 9. The contribution of bursting galaxies to counts at longer wavelengths is much smaller than in the UV. They represent less than 10 per cent of the total number of galaxies at in the Cowie et al. (1996) redshift survey and cannot be the main explanation of the excess of faint blue galaxies observed over the no-evolution predictions. High-redshift, intrinsically bright galaxies forming stars at a higher rate in the past are the most likely explanation. They correspond to the tail of the Cowie et al. (1996) redshift distribution and are well modelled with PLE scenarios (Fig. 7). In an open or a flat, -dominated, Universe, PLE scenarios reproduce the , , and counts (Fig. 5), assuming a normalization of the LF to the bright counts of Gardner (1996) as discussed in FRV. They also fit the redshift and color distributions (Figs. 6 to 9).
The agreement with the blue counts in the Hubble Deep Field (Williams et al. 1996) is notably satisfying. Though a small deficit may be observed in the band (3000 Å), the (3000 Å–4500 Å) color distribution is well reproduced (Fig. 9).


The fraction of vBG at these faint magnitudes is small; they are therefore not the main reason for the agreement with HDF data. Since the volume element at high redshift is lower in a flat, , Universe, the contribution of bursting galaxies relative to normal galaxies is higher, but, as modelled here, they are unable to reproduce the faint counts in any of the four bands (dotted and dot-dashed lines, Fig. 5).
5 The angular correlation function
The angular correlation function might be a useful constraint on bursting galaxies, as it is directly related to the redshift distribution. In a sample, Landy et al. (1996) recently obtained an unexpected increase of the amplitude () of the angular correlation function with galaxy colors , and suggested that this might be due to a population of vBG located at . We have computed from our redshift distributions, assuming a classical power law () for the local spatial correlation function and no evolution of the intrinsic clustering in proper coordinates (). A slope and a single correlation length (see Peebles 1993) have been adopted for all types. The increased correlation in the blue naturally arises from our computations (Fig. 10) and is due to the population of bursting galaxies in our model. The interval of magnitudes, the faint , and the color criterion conspire to select galaxies in a small range of redshift. In spite of the simplicity of our computation of , the trend we obtain is very satisfying. Increasing the complexity of the model might afford a better fit to the -color relation, but at the expense of a higher number of parameters.

6 Conclusion
We have modelled a vBG population prominent in the bright UV counts by assuming that they are galaxies that undergo cycles of star-formation activity. A cycling star formation rate leads to very blue colors in a more physical way than by assuming a population of unevolving galaxies. Our modelling fits the 2000 Å bright counts (Armand & Milliard 1994), the redshift survey of Cowie et al. (1996) and the angular correlation function of Landy et al. (1996). The nature of vBG is poorly constrained from the data studied here, but we tentatively identify them from their typical luminosities and equivalent widths ( Å) with H ii galaxies (Coziol 1996). Such a conclusion is reinforced by observations of vBG at with low luminosities, but high surface brightnesses, and intense emission lines (Koo et al. 1994). Multispectral observations of individual galaxies, from the UV to the infrared (e.g. Almoznino & Brosch 1998), should help to determine the possible contribution of the underlying population of old stars, and then the star formation history.
Very blue galaxies, as modelled in this paper, are only a small fraction of the number of galaxies predicted at faint magnitudes in the visible and are not the main reason for the excess of faint blue galaxies, although they may cause some confusion in the interpretation of the faint surveys. In an open or a flat, -dominated, Universe, the population of normal high redshift star-forming galaxies, even with a nearly flat LF, reproduces fairly well the counts down to the faintest magnitudes observed by the Hubble Space Telescope.
As is now well established, this population is unable to explain the excess of faint blue galaxies in a flat Universe (e.g. Metcalfe et al. 1996). Recent morphological surveys have revealed a higher number of irregular/peculiar galaxies (e.g. Glazebrook et al. 1995; Odewahn et al. 1996) with smaller sizes at faint magnitudes than expected from PLE models. Although these results depend sensitively on the evolution of the apparent UV morphology (Abraham et al. 1996), which may make galaxies look more patchy (O’Connell 1997) and even split them in several pieces at high redshift (Colley et al. 1996), they seem to favor bursting dwarfs as a possible explanation of the blue excess in a flat Universe. Simply changing the local luminosity function may, however, not be the solution, since a significant steepening of the slope would lead to an excess of galaxies at very low redshift, whereas a much higher normalization would be in disagreement with UV counts. An alternative is to produce stronger bursts at high redshift. This would brighten them, but would also raise the number of old stars in them and make it more difficult to obtain very blue colors at low redshift. If the blue excess is really due to bursting galaxies, the hypothesis of the conservation of the number of galaxies must be relaxed. Either new galaxies are continually formed or galaxies have merged. In the first case, many old red remnants must have been produced and might be detected by future near-infrared surveys, while in the second case, many merging galaxies should be observed in the far-infrared by the Infrared Space Observatory.
Acknowledgements.
We are particularly grateful to Malcolm Bremer for carefully reading the manuscript. We acknowledge fruitful discussions with Bruno Milliard and José Donas and we thank them for providing us with details on the FOCA experiment. We also thank Joe Silk and Gus Evrard for their remarks and recommendations regarding the continuation of this work. M. F. acknowledges partial support from the National Research Council through the Resident Research Associateship Program.References
- (1) Abraham R. G., Tanvir N. R., Santiago B. X., Ellis R. S., Glazebrook K., van den Bergh S., 1996, MNRAS 279, L47
- (2) Almoznino E., Brosch N., 1998, MNRAS 298, 931
- (3) Armand C., Milliard B., 1994, A&A 282, 1
- (4) Arnouts S., de Lapparent V., Mathez G., Mazure A., Mellier Y., Bertin E., Kruszewski A., 1996, A&AS 124, 163
- (5) Babul A., Ferguson H. C., 1996, ApJ 458, 100
- (6) Babul A., Rees M. J., 1992, MNRAS 255, 346
- (7) Bershady M., 1995, in Galaxies in the young Universe, Hippelein et al. (eds.), Springer-Verlag, Berlin, p. 125
- (8) Bertin E., Dennefeld M., 1997, A&A 317, 43
- (9) Bouwens R. J., Silk J., 1996, ApJ 471, L19
- (10) Broadhurst T., Ellis R.S., Shanks T., 1988, MNRAS 235, 827
- (11) Broadhurst T. J., Ellis R. S., Glazebrook K., 1992, Nature 355, 55
- (12) Calzetti D., 1997, AJ 113, 162
- (13) Calzetti D., Kinney A. L., Storchi-Bergmann T., 1994, ApJ 429, 582
- (14) Campos A., 1997, ApJ 488, 606
- (15) Casertano S., Ratnatunga K., Griffiths R., Im M., Neuschaefer L., Ostrander E., Windhorst R., 1995, ApJ 453, 599
- (16) Colless M., Ellis, R. S., Broadhurst T. J., Taylor K., Peterson B. A., 1993, MNRAS 261, 19
- (17) Colley W. N., Rhoads J. E., Ostriker J. P., Spergel D. N., 1996, ApJ 473, L63
- (18) Comins N. F., 1984, ApJ 284, 90
- (19) Cowie L. L., Songaila A., Hu E. M., Cohen J. G., 1996, AJ 112, 839
- (20) Coziol R., 1996, A&A 309, 345
- (21) Crampton D., Le Fèvre O., Lilly S., Hammer F., 1995, ApJ 455, 96
- (22) Davies J. I., Phillips S., 1988, MNRAS 233, 553
- (23) Dekel A., Silk J., 1986, ApJ 303, 39
- (24) Djorgovski S., Soifer B., Pahre M., Larkin J., Smail I., Matthews K., Hogg D., Blandford R., Cohen J., Harrison W., Nelson J., 1995, ApJ 438, L13
- (25) Doyon R., Puxley P. J., Joseph R. D., 1992, ApJ 397, 117
- (26) Driver S. P., Phillips S., 1996, ApJ 469, 529
- (27) Driver S. P., Phillips S., Davies J. I., Morgan I., Disney M. J., 1994, MNRAS 266, 155
- (28) Ellis R. S., 1997, ARA&A 35, 389
- (29) Fioc M., 1997, PhD thesis, Université Paris XI (http://www.iap.fr/users/fioc.html)
- (30) Fioc M., Rocca-Volmerange B., 1997, A&A 326, 950
- (31) Firmani C., Tutukov A. V., 1994, A&A 288, 713
- (32) Fukugita M., Yamashita K., Takahara F., Yoshii Y., 1990, ApJ 361, L1
- (33) Gardner J., Cowie L., Wainscoat R., 1993, ApJ 415, L9
- (34) Gardner J. P., Sharples R. M., Carrasco B. E., Frenk C. S., 1996, MNRAS 282, L1
- (35) Gerola H., Seiden P. E., Schulman L. S., 1980, ApJ 242, 517
- (36) Glazebrook K., Peacock J., Collins C., Miller L., 1994, MNRAS 266, 65
- (37) Glazebrook K., Ellis R., Santiago B., Griffiths R., 1995, MNRAS 275, L19
- (38) Gordon K. D., Calzetti D., Witt A. N., 1997, ApJ 487, 625
- (39) Gronwall C., Koo D. C., 1995, ApJ 440, L1
- (40) Guhathakurta P., Tyson J. A., Majewski S. R., 1990, in Kron R. G. (ed.), Astronomical Society of the Pacific, San Francisco, Evolution of the Universe of Galaxies, p. 304
- (41) Guiderdoni B., Rocca-Volmerange B., 1990, A&A 227, 362
- (42) Hall P., Mackay C., 1984, MNRAS 210, 979
- (43) Heckman T. M., Robert C., Leitherer C., Garnett D. R., van der Rydt F., 1998, ApJ 503, 646
- (44) Heydon-Dumbleton N., Collins C., MacGillivray H., 1989, MNRAS 238, 379
- (45) Heyl J., Colless M., Ellis R. S., Broadhurst T., 1997, MNRAS 285, 613 (HCEB)
- (46) Hogg D. W., Phinney E.S., 1997, ApJ 488, L95
- (47) Hogg D. W., Pahre M. A., McCarthy J. K., Cohen J. G., Blandford R., Smail I., Soifer B. T., 1997, MNRAS 288, 404
- (48) Huang J. S., Cowie L., Gardner J., Hu E., Songaila A., Wainscoat R., 1997, ApJ 476, 12
- (49) Infante L., Pritchet C., Quintana H., 1986, AJ 91, 217
- (50) Jarvis J., Tyson A., 1981, AJ 90, 418
- (51) Jenkins C., Reid I., 1991, AJ 101, 1595
- (52) Jones L. R., Fong R., Shanks T., Ellis R. S., Peterson, B. A., 1991, MNRAS 249, 481
- (53) Koo D. C., 1986, ApJ 311, 651
- (54) Koo D. C., 1990, in Evolution of the Universe of Galaxies, ASP conf. ser. 10, p. 268
- (55) Koo D. C., Kron R. G., 1992, ARA&A 30, 613
- (56) Koo D. C., Bershady M. A., Wirth G. D., Stanford S. A., Majewski S. R., 1994, ApJ 427, L9
- (57) Lacey C., Guiderdoni B., Rocca-Volmerange B., Silk J., 1993, ApJ 402, 15
- (58) Lançon A., Rocca-Volmerange B., 1996, New Astronomy 1, 215
- (59) Landy S. D., Szalay A. S., Koo D. C., 1996, ApJ 460, 94
- (60) Le Fèvre O., Crampton D., Lilly S., Hammer F., Tresse L., 1995, ApJ 455, 60
- (61) Leitherer C., Ferguson H. C., Heckman T. M., Lowenthal J. D., 1995, ApJ 454, L19
- (62) Li F., Ikeuchi S., 1989, PASJ 41, 221
- (63) Lilly S. J., Cowie L. L., Gardner J. P., 1991, ApJ 369, 79
- (64) Lilly S. J., Le Fèvre O., Crampton D., Hammer F., Tresse L., 1995, ApJ 455, 50
- (65) McLeod B., Bernstein G., Rieke M., Tollestrup E., Fazio G., 1995, ApJS 96, 117
- (66) Madau P. 1995, ApJ 441, 18
- (67) Madau P., Ferguson H. C., Dickinson M. E., Giavalisco M., Steidel C. C., Fruchter A., 1996, MNRAS 283, 1388
- (68) Maddox S. J., Sutherland W. J., Efstathiou G., Loveday J., Peterson B. A., 1990, MNRAS 241, 1p
- (69) Majewski S. R., 1989, in The Epoch of Galaxy Formation, Frenk C.S. et al. (eds.), Proc. NATO, Dordrecht, Kluwer, p. 86
- (70) Marzke R. O., Geller M. J., Huchra J. P., Corwin H. G., 1994, AJ 108, 437
- (71) Massey P., Armandroff T. E., 1995, AJ 109, 2470
- (72) Metcalfe N., Fong R., Jones L., Shanks T., 1987, in High redshift and primeval galaxies, Éditions Frontières, p. 37
- (73) Metcalfe N., Shanks T., Fong R., Jones L., 1991, MNRAS 249, 498
- (74) Metcalfe N., Shanks T., Fong, R., Roche N., 1995a, MNRAS 273, 357
- (75) Metcalfe N., Fong R., Shanks T., 1995b, MNRAS 274, 769
- (76) Metcalfe N., Shanks T., Campos A., Fong R., Gardner J. P., 1996, Nature, 383, 236
- (77) Mobasher B., Ellis R., Sharples R., 1986, MNRAS 223, 11
- (78) Moustakas L., Davis M., Graham J., Silk J., Peterson B., Yoshii Y., 1997, ApJ 475, 445
- (79) O’Connell R. W., 1997, in The Ultraviolet Universe at Low and High Redshift, W. H. Waller (ed.), AIP Press
- (80) Odewahn S. C., Windhorst R. A., Driver S. P., Keel W. C., 1996, ApJ 472, L13
- (81) Olson G. L., Peña J. H., 1976, ApJ 205, 527
- (82) Peebles P. J. E., 1993, Principles of Physical Cosmology, Princeton University Press, Princeton
- (83) Peterson B., Ellis R., Kibblewhite E., Bridgeland M., Hooley T., Horne D., 1979, ApJ 233, L109
- (84) Pozzetti L., Bruzual A. G., Zamorani G., 1996, MNRAS 281, 953
- (85) Pozzetti L., Madau P., Zamorani G., Ferguson H. C., Bruzual A. G., MNRAS 298, 1133
- (86) Puxley P. J., 1991, MNRAS 249, 11p
- (87) Rana N., Basu S., 1992, A&A 265, 499
- (88) Rieke G. H., Loken K., Rieke M. J., Tamblyn P., 1993, ApJ 412, 99
- (89) Rocca-Volmerange B., Guiderdoni B., 1990, MNRAS 247, 166
- (90) Roche N., Shanks T., Metcalfe N., Fong R., 1996, MNRAS 280, 397
- (91) Roche N., Ratnatunga K., Griffiths R. E., Im M., 1997, MNRAS 288, 200
- (92) Salpeter E., 1955, ApJ 121, 161
- (93) Saracco P., Iovino A., Garilli B., Maccagni D., Chincarini G., 1997, AJ 114, 887
- (94) Scalo J., 1997, in The Stellar Initial Mass Function, Gilmore G., Parry I., Ryan S. (eds.) (astro-ph/9712317)
- (95) Smail I., Hogg D., Yan L., Chen J., 1995, ApJ 449, L105
- (96) Smecker-Hane T. A., Stetson P. B., Hesser J. E., VandenBerg D. A., 1996 (astro-ph/9601020)
- (97) Soifer B. et al., 1994, ApJ 420, L1
- (98) Steidel C. C., Giavalisco M., Dickinson M., Adelberger K. L., 1996, AJ 112, 352
- (99) Stevenson P., Shanks T., Fong R., 1986, in Spectral evolution of galaxies, Dordrecht, D. Reidel Publishing Co., p. 439
- (100) Szokoly G. P., Subbarao M. U., Connolly A. J., Mobasher B., 1998, ApJ 492, 452
- (101) Treyer M. A., Ellis, R. S., Milliard B., Donas J., Bridges T. J., 1998 (accepted in MNRAS, astro-ph/9806056)
- (102) Tyson J. A., 1988, AJ 96, 1
- (103) Vacca W.D., Robert C., Leitherer C., Conti P.S., 1995, ApJ 444, 647
- (104) Weir N., Djorgovski S., Fayyad U., 1995, AJ 110, 1
- (105) Wiklind T., 1987, in Starbursts and Galaxy Evolution, Thuan T. X., Montmerle T., Tran Thanh Van J. (eds.), Frontières, Gif-sur-Yvette, p. 495
- (106) Williams R. E. et al., 1996, AJ 112, 1335