GRB990123, The Optical Flash and The Fireball Model
Abstract
We compare the ongoing observations of the remarkable burst GRB990123 with the predictions of the afterglow theory. We show that the observations agree with the recent prediction that a reverse shock propagating into the ejecta would produce a very strong prompt optical flash. This reverse shock has also produced the 8.46GHz radio signal, observed after one day. The forward shock, which propagates into the ISM is the origin of the classical afterglow. It has produced the prompt X-ray signal as well as the late optical and IR emission. It would most likely produce a radio emission within the next few weeks. The observations suggest that the initial Lorentz factor of the ejecta was . Within factors of order unity, this crude model explains all current observations of GRB990123.
1 Introduction
Gamma-ray bursts observers, were shocked once more with the explosion of GRB990123. This is a very strong burst. Its fluence of (Kippen et al., GCN224) places it at the top 0.3% of BATSE’s bursts. It has a multi-wavelength afterglow ranging from X-ray via optical and IR to radio. Absorption lines in the optical have led to a lower limit of its redshift (Kelson et al., IAUC 7096) which for isotropic emission leads to a -ray energy of about ergs. This, and a second set of absorption lines at have led to the suggestion (Djorgovski et al., GCN216) that GRB990123 might have been lensed and amplified by a factor of ten or so.
GRB990123 would have been amongst the most exciting GRBs ever just on the basis of these facts. However, ROTSE discovered a new element 8.9 magnitude prompt optical flash (Akerlof et al., GCN205). This have added another dimension to GRB astronomy. It is the first time that a prompt emission in another wavelength apart from -rays has been detected from a GRB. Such a strong optical flash was predicted, just a few weeks ago (Sari & Piran 1999a,b; hereafter SP99), to arise from a reverse shock, propagating into the relativistic ejecta, that forms in the early afterglow. The original prediction gave a lower limit of 15 magnitude for a “standard” GRB with a fluence of ergs/cm2. Scaling that to the -ray fluence of GRB990123 yields a lower limit of , compatible with the observed 9 magnitude.
In this letter we confront the fireball theory with the ongoing observations of GRB990123. We show that the observations of the GRB light curve and spectrum, the prompt optical flash light curve, the radio emission as well as the available afterglow light curve for the first few days strongly support the reverse shock prompt emission model. This agreement provides an additional support to the overall internal-external scenario.
2 Observations
GRB990123 triggered BATSE on 1999 January 23.507594 (Kippen et al., GCN 224). It consisted of multi-peaked structure lasting more than 100 seconds. There are two clear relatively hard peaks with irregular softer emission that follow. The burst’s -ray peak flux is 16.42 photons/cm2/sec. The total fluence (keV) is erg/cm2 (Band 1999). The burst also triggered GRBM (on 23.50780) and was detected by the WFC on BeppoSAX (Feroci et al., IAUC 7095). The GRBM fluence is comparable erg/cm2. The WFC light curve is complex with only one clear peak (about 40 seconds after the GRBM peak) followed by a structured high plateau. The peak flux of this peak is Crab in the energy band 1.5-26 keV. The total fluence in this soft X-ray band is about ergs/cm2, a few percent of the -ray fluence.
BATSE’s observations triggered ROTSE via the BACODINE system (Akerlof et al., GCN205). An 11.82 magnitude optical flash was detected on the first 5 seconds exposure, 22.18 seconds after the onset of the burst. This was the first observation ever of a prompt optical counterpart of a GRB. Another 5 seconds exposure, 25 seconds later, revealed a 8.95 magnitude signal ( Jy!). The optical signal decayed to 10.08 magnitude 25 seconds later and continued to decay down to 14.53 magnitude in subsequent three 75 second exposures that took place up to 10 minutes after the burst. The five last exposures depict a power law decay with a slope of (see Fig. 1). This initial optical flash contains most of the optical fluence: , about of the -ray fluence.
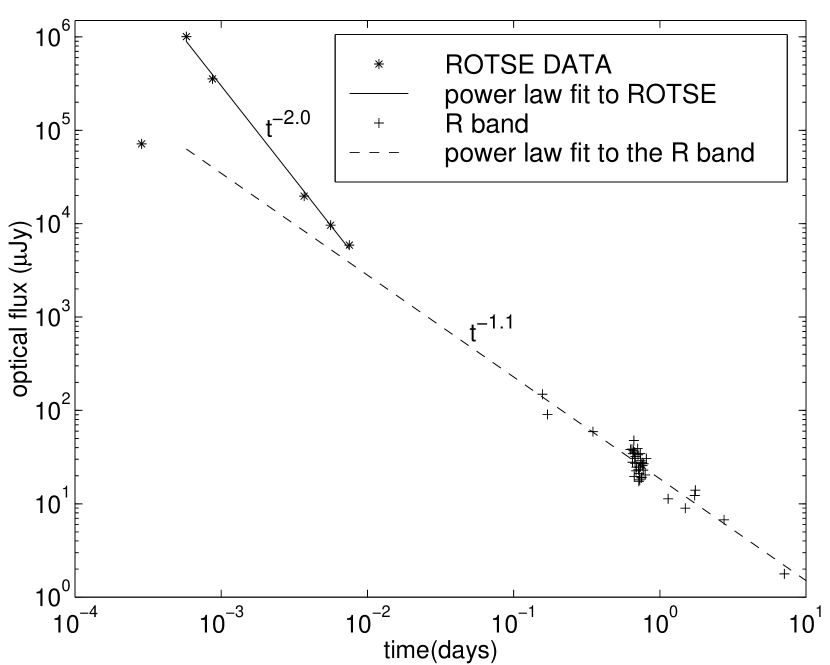
Optical afterglow follow up by larger telescopes began some 3 hours and 46 minutes later with the observations on Palomar (Odewahn et al., IAUC. 7094). These observations revealed an 18.2 R magnitude source. The optical observations continued in more than half a dozen observatories around the world. These observations are summarized in Fig. 1. We have inferred a slope of from the entire R band observations reposted in the GCN (see Fig 1). A similar slope was deduced for the Gunn-r flux (Bloom et al., GCN240, Yadigaroglu et al, GCN242). Note that this is significantly different from the initial slope. The optical spectra revealed several absorption line system, showing that the redshift of GRB990123 is (Kelson et al., IAUC 7096).
The early X-ray observations were followed up by an NFI observation (Piro et al., GCN203, Heise et al IAUC7099) beginning approximately six hours after the burst with a flux of ergs/cm2/sec (about Jy) and lasting for 26hours. The NFI observation corresponds to a power law decay with a slope of -1.35 from the prompt observation (about 60 seconds after the burst) and within the 26 hour NFI measurement itself. An ASCA observation (Murakami et al., GCN228) on 25.688 (approximately 2 days and 7 hours after the burst) reported a flux of ergs/cm2/sec (about Jy). The decay from the NFI to the ASCA observation is slightly slower with a slope of .
A Near Infra-red counterpart with a magnitude was detected on Jan. 24.6356 (Bloom et al., GCN240). It has been observed later on 27.65 and 28.55. The observations agree with a decaying light curve with a slope .
Finally, a radio source at 8.46 GHz was detected on Jan. 24.65 by the VLA (Frail & Kulkarni, GCN211) with a flux density of Jy. This radio source was not detected earlier with an upper limit of Jy (Frail and Kulkarni GCN200) or later with a comparable upper limit by the VLA (Kulkarni and Frail GCN239). Earlier attempt to detect a radio source on 24.28 at 4.88GHz gave only an upper limit of Jy (Galama et al., GCN212)
3 An Optical Flash from the Reverse Shock
A brief examination of the -rays signal during the three optical exposures that where simultaneous with the burst show that there is no correlation between the -ray intensity and the optical intensity. The -ray counts ratios in these three exposures are 5:1:1 (a more careful examination of the spectrum shows that the energy ratio is about 10:1:1; Band, 1999). The optical ratios, on the other hand, are approximately 1:15:5. While in principle the cooling tail of the electrons producing the GRB itself could give rise to a strong optical signal it would have been correlated with the -ray signal. The lack of correlations means that the same electrons could not have emitted both the -rays and the optical emission. Moreover, GRB990123 was a relatively hard burst peaking at about MeV. The decreasing flux with decreasing frequency (below a few hundred keV) is incompatible with a low cooling frequency, required for a strong optical emission. One could have thought that the highest energy electrons which are emitting -rays are fast cooling while the lower energy electrons which are emitting optical are slow cooling. In this case the optical emission would have been proportional to the integrated -ray flux (Katz, 1999). But this again is in disagreement with the decay in the optical emission in the third optical exposure. We conclude that the -rays and the optical emission must have been emitted in different physical regions.
According to the fireball model (see e.g. Piran, 1999 for a review) there are two possible regions in which shocks could take place. Internal shocks which take place within the relativistic ejecta, and external shocks that take place between the ejecta and the ISM. In the internal-external model (Sari & Piran 1997) the GRB is produced via internal shocks within the relativistic ejecta itself while the afterglow is produced via external shocks. In an internal shock both forward and reverse are more or less similar since the ejecta shells they are running into have similar properties. On the other hand, in the external shocks that follow, the reverse shock, that is going into the dense ejecta, is very different from the forward shock that is going into the ISM. Therefore, overall there are three possible emitting regions in the internal-external scenario.
For external shocks the ratio between the emission from the forward and the reverse shock is proportional to , being the Lorentz factor of the ejecta (See SP99 for more details). Thus, if an external reverse shock is producing the GRB the external forward shock emission will be in the GeV range (Mészáros and Rees, 1994), and there is no room for a strong optical emission. If an external forward shock has produced the GRB the external reverse shock could have emitted in optical. However, we expect such emission to be correlated with the -ray emission, unlike the observations. Thus, we rule out this scenario. This is in agreement with other arguments against this model (Sari & Piran 1997, Fenimore, Madras & Nayakshin 1996).
Within the internal-external scenario the GRB is produced by the internal shocks. For these shocks both forward and reverse shocks are rather similar and the emission from both shocks is at the same energy band. If the forward external shock would have produced the optical emission there would have been no place to produce neither the prompt X-rays nor the late afterglow emission. Thus, we are left with the only possibility that the reverse external shock has produced the optical emission while the forward external shock (which continues later as the afterglow) produced the early X-ray as well as UV and some weak -ray signal. We don’t expect now any correlation between the -rays and the optical emission, but we expect some correlation between the optical emission and an early X-ray emission. Indeed the WFC on BeppoSAX reported an X-ray peak some 60 seconds after the beginning of the burst, not far from the peak exposure of ROTSE. It is important to note that the overlap between the internal shocks signal (the GRB) and the early afterglow (the optical and the X-ray) was expected. In the internal shocks scenario long bursts are produced by thick shells, which, in turn, are produced by a central engine operating for a long time. Sari (1997) have shown that for this case, there should be an overlap between the internal shock emission and the external shock emission, in agreement with the observations.
4 The Reverse Shock Evolution
An exact calculation of the reverse shock evolution requires a detailed understanding of the magneto-hydrodynamics of relativistic collisionless fluids and their behavior behind strong shocks. However, surprisingly good qualitative picture can be obtained by treating the matter as a fluid, using the simplest assumptions (equipartition and random orientation) on the magnetic field evolution.
After the reverse shock has passed through the ejecta, the ejecta cools adiabatically. We assume that it follows now the Blandford McKee (1976) self-similar solution (recall that strictly speaking this solution deals only with the ISM material). In this solution a given fluid element evolves with a bulk Lorentz factor of . Since the observed time is given by we obtain
| (1) |
Similarly, the internal energy density evolves as , the particle density evolves as and therefore the energy per particle, or the particle Lorentz factor behaves like
| (2) |
The simplest assumption regarding the magnetic field is that its energy density remains a constant fraction of the internal energy density. In this case we obtain . Other evolution of the magnetic field are possible if the magnetic field has a defined orientation (Granot, Piran & Sari 1998).
We assume that the reverse shock has accelerated the electrons to a power-law distribution. However, once the reverse shock crossed the ejecta shell, no new electrons are accelerated. All the electrons above a certain energy cool, and if the cooling frequency, , is above the typical frequency, we are left with a power law electron distribution over a finite range of energies and Lorentz factors. Each electron now cools only due to the adiabatic expansion with its Lorentz factor proportional to .
Once the reverse shock has crossed the ejecta shell the emission frequency drops quickly with time according to . Given that the total number of radiating electrons is fixed the flux at this frequency falls like . Below the typical emission frequency, , we have the usual synchrotron low energy tail and for these low frequencies the flux decreases as .
Above (and below ) the flux falls sharply as . For this is about . Both and drop as , since all electrons cool by adiabatic expansion only. Once drops below the observed frequency the flux practically vanishes (drops exponentially with time).
5 The Reverse Shock Emission and GRB990123 Observations
The initial decay of the optical flux after the second ROTSE exposure is . In agreement with the crude theory predicting . This means that , the typical synchrotron frequency of the reverse shock, is below the optical bands quite early on. Using the estimates of the peak value of reverse shock from SP99 we obtain
| (3) |
This shows that the initial Lorentz factor of this burst was not too high. Using the equipartition values and and inferred for GRB970508 (Wijers & Galama, 1998, Granot, Piran & Sari, 1998b) we find that the initial Lorentz factor was rather modest:
| (4) |
This is in agreement with the lower limit estimates, based on the pair creation opacity (Fenimore, Epstein, & Ho, 1993; Woods & Loeb, 1995; Piran, 1995; Baring & Harding, 1997).
The Lorentz factor at the beginning of the self similar deceleration, i.e., at the time of the afterglow peak s, is independent of the initial Lorentz factor of the flow (SP99). This is very close to our estimated initial Lorentz factor. It shows that the reverse shock is only mildly relativistic and the initial Lorentz factor of its accelerated electrons’ random motion is:
| (5) |
Emission from the reverse shock can also explain the radio observations: a single detection of Jy one day after the burst. If the reverse shock emission peaked in the optical at sec and the peak frequency decayed in time as then the peak frequency should have reached GHz after hours. Scaling the observed optical flux of Jy, as to hours the expected flux at GHz is Jy. From that time on the 8.4GHz flux decays as . The emitted 8.4GHz flux is therefore given by
| (6) |
so that at days, when radio was detected, we expect a flux of Jy, amazingly close to the observations. Equation 6 is also compatible with all later upper limits, see figure 2.
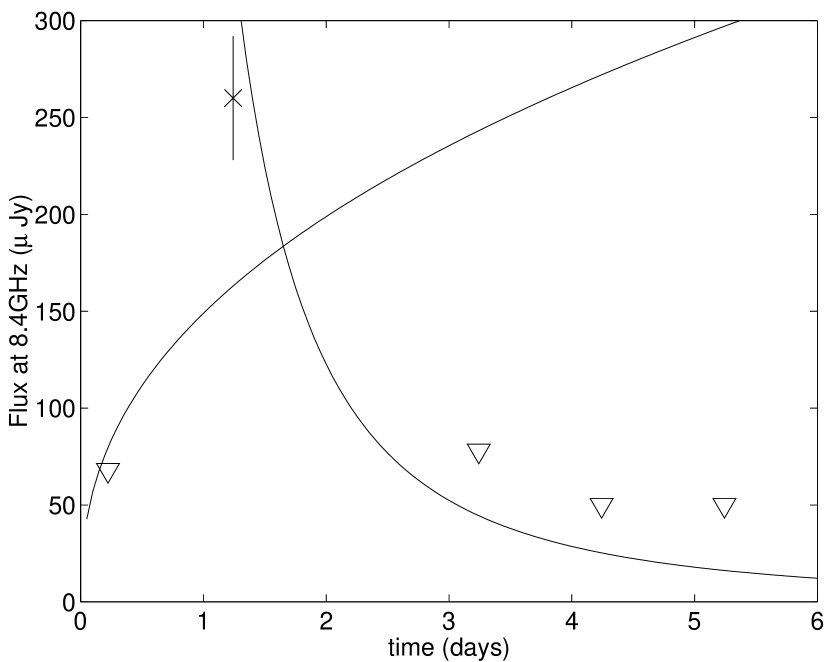
Equation 6 yields a 8.4GHz flux of mJy after six hours, which is way above the upper limit of Jy. However, strong self absorption of the reverse shock radio emission took place at this stage and this suppressed this emission. When accounting for that, the resulting emission would be the minimum between the estimate of equation 6 (ignoring self absorption) and the black body upper limit. This upper limit of black body emission from the reverse shock can be estimated by (Katz & Piran, 1997, SP99):
| (7) |
Note that while the emission estimates used only scaling with time of the observed early optical flux, the black body upper limit is more model dependent and possibly less reliable. The scaling in the last expression as well as the numerical coefficient use the scaling of and with time (equation 1 and 2) together with their inferred initial value from the initial afterglow time and peak (equations 4 and 5). We used where the numerical coefficient is appropriate for a fast decelerating shell (see Sari 1997,1998; Waxman 1997a; Panaitescu & Mészáros 1998), and the relevant distance is cm for a , universe and assuming . Shown, on Fig. 2 is also the upper limit to the radio emission according to a black body spectrum. This upper limit from black body emission also accounts for the lack of 4.88GHz reported by Galama et al. (GCN212).
We now turn to estimate the initial (50sec) cooling frequency . Note that initially, this frequency is the same for the forward and the reverse shock (SP99). A simple estimate can be obtained from the the temporal slope of the late afterglow (forward shock) light curve and its spectrum, which are compatible with the predicted spectrum (Sari, Piran & Narayan, 1998) of slow cooling electrons (Bloom et at., GCN240). This indicates that the forward shock cooling frequency is Hz leading to Hz. Detection of a break in the optical flux later on can be used to replace this inequality by a more solid number.
A similar lower limit can be put using the fact that the reverse shock was seen for more than 650sec. The reverse shock cooling frequency at that time is therefore higher than Hz. Scaling it back to 50sec according to we get Hz.
A more speculative constraint on can be obtained from the GRB spectrum itself (SP99). The decreasing GRB spectrum below a few hundred keV implies that keV. Otherwise the low energy flux would have increased at low frequencies like . This constraints Hz. This holds for the site producing the GRB (internal shocks in our model). However, the observed -ray emission during the end of the GRB is probably dominated by the forward shock, as suggested by the smoother temporal profile and by the softer spectrum. This means that a similar constraint applies to the initial of the forward shock, which is the same as the reverse shock one. If this rough estimate of Hz is correct then this break in the late optical light curve is expected to be only after about 40 days.
The reverse shock model can also be confronted with the observed optical to -ray energy ratio. Using the table in SP99 and the estimated synchrotron frequency at sec Hz and the cooling frequency Hz we find the optical fluence to be of the GRB fluence. This is about a factor of five higher than the observed fraction, a reasonable agreement, considering the crudeness of the model. Note that this model assumes that the reverse shock contains the same amount of energy as the whole system. This can be of course lower by a factor of a few.
6 The Forward Shock
The forward shock that propagates into the ISM is considered by now as the classical source of the afterglow (Katz, 1994; Mészáros & Rees 1997; Vietri, 1997; Wijers et al., 1997; Waxman, 1997b; Katz & Piran, 1997). After a possible short radiative phase it becomes adiabatic and it acquires the Blandford McKee profile. It then expands self-similarly until it becomes non-relativistic. In GRB990123 it has produced some of the prompt soft -rays and X-rays observed late during the burst by BATSE, and the WFC. It has continued to produce the X-ray and the late optical and IR emission.
The initial decline of the X-ray suggests that already initially the typical synchrotron frequency was below the 1.5-10keV band. The late slope of the light curve of the optical afterglow agrees well with other power law decays seen in other afterglows. This suggests that we see an adiabatic decay phase. There could have been an early radiative phase, but if there was one it was shorter than the 3.75 hours gap before the first optical observations. This is in agreement with expectations (Waxman 1997, Granot et al., 1998a). The decline from hours onwards in the R band suggests that already at this stage the typical synchrotron frequency, was below this band. Extrapolating this back to 50sec we get Hz, consistent with the above discussion. Moreover, the ratio between of the forward and the reverse shock should be approximately . Using the two estimated values in the initial time we find that . This is a factor of 3 lower than completely independent estimate in equation 4. Again we consider this as a rather good agreement in view of the crudeness of both estimates. A short initial radiative phase could even improve this agreement.
The observed temporal decay slope of the X-ray ( and ) and optical () from the forward shock are comparable. An X-ray slope steeper by a is predicted (Sari, Piran and Narayan 1998) if the cooling frequency is between the X-rays and the optical, which seems to be the case in this burst. With future data and a careful analysis this prediction could be tested.
7 Discussion
The discovery of prompt optical emission during a GRB have opened a new window to explore this remarkable phenomenon. The lack of correlation between the optical and -ray emission is a clear indication that two different processes produce the emission in those two different bands. The emission from these two processes reach the observers simultaneously. These findings are in a perfect agreement with the internal-external model. Fenimore, Ramirez-Ruiz and Wu (1999) reach into the same conclusion on the grounds of the burst’s temporal structure.
The strong prompt optical emission was predicted (SP99) to arise from the reverse external shock. We see here that various features of this emission, in particular the overall fluence and the decay slope agree well with the predictions. This reverse shock also explains the origin of the transient radio observation a day after the burst.
The light curves of the X-ray and the late optical afterglow agree well with the, by now, “classical” afterglow model. According to this model this emission is produced by the forward external shock. We expect a somewhat different slope for the X-ray and optical light curves. However at present the data is not good enough to test this prediction. It remains to be seen if this could be tested in the future. We also expect that radio emission would show up on a time scale of weeks. The source of this emission would also be the forward external shock.
Already now we were able to determine some of the parameters of GRB990123. Specifically we were able to estimate the initial Lorentz factor and the Lorentz factor three days after the burst. Future radio and optical observations will enable us to determine the rest of the parameters of GRB990123, allowing a refinement of these calculations and further tests of the theory.
The late optical light curve is well fit by a single power law without any break. The index of this slope is approximately the one predicted by the spherical afterglow model. These facts suggest that so far there was no transition from a spherical like to an expanding jet behavior. Such a transition is expected, for a relativistic jet, when the Lorentz factor reaches the value , where is the opening angle of the jet (Rhoads, 1997). Such a transition would lead to a break in the light curve and to a decrease in its index by one. Since the theory gives a Lorentz factor of about six at seven days, these observations set a lower limit on the beaming angle of GRB990123 to be . The energy budget could still be “rescued” if a break is seen soon. Otherwise, this indicates that GRB990123 is as powerful as the isotropic estimates suggest!
The coincidence of nearby galaxy the strength of the burst have led to the speculation that GRB990123 has been magnified by a gravitational lens (Djorgovski et al., GCN216). There have been some suggestions that this is unlikely. We stress that our analysis (apart from the black body emission in equation 7) is independent of whether the event was lensed or not and independent of its redshift.
References
- (1) Akerlof, C., et al., GCN205
- (2) Baring, M., G., & Harding, A., K., 1997, Ap. J. 491, 663.
- (3) Band, D., 1999, private communication.
- (4) Blandford, R.D., & McKee, C.F. 1976, Phys. of Fluids, 19, 1130.
- (5) Bloom J. S., et al., CGN208
- (6) Bloom J. S., et al., GCN240
- (7) Djorgovski S., G., et al., GCN216
- (8) Fenimore, E. E., Epstein, R.I., & Ho, C.H., 1993, A&A Supp., 97, 59.
- (9) Fenimore, E. E., Madras, C., & Nayakshin, S., 1996, Ap. J., 473, 998.
- (10) Fenimore, E. E., Ramirez-Ruiz,E. and Wu, B. 1999, ApJL Submitted, astro-ph/9902007.
- (11) Feroci M., et al., IAUC 7095
- (12) Frail D. A., & Kulkarni, S. R., GCN200
- (13) Frail D. A., & Kulkarni, S. R., GCN211
- (14) Gal R., R., et al., GCN207
- (15) Galama, T. J., et al., GCN212
- (16) Garnavich P., et al., GCN215
- (17) Granot, J., Piran, T., & Sari, R., 1998a, Ap. J., in press. astro-ph/9806192.
- (18) Granot, J., Piran, T., & Sari, R., 1998b, astro-ph/9808007.
- (19) Katz, J.I., 1994, Ap. J., 422, 248.
- (20) Katz, J. I., & Piran, T., 1997, Ap. J., 490, 772.
- (21) Katz, J. I., 1999, private communication.
- (22) Kelson et al., IAUC 7096
- (23) Kippen R. M., et al., GCN224
- (24) Kulkarni, S. R. & Frail, D. A. GCN239
- (25) Masetti M., et al., GCN220
- (26) Mészáros, P., & Rees, M.J., 1997, Ap. J., 476, 232.
- (27) Panaitescu, A., & Mészáros, P., 1998, Ap. J., 492, 683, astro-ph/9709284.
- (28) Murakami T., et al., GCN228
- (29) Odewahn S. D., et al., IAUC. 7094
- (30) Ofek E., & Leibowitz, E., GCN210
- (31)
- (32) Piran, T., 1997, in: Some Unsolved Problems in Astrophysics, Eds. Bahcall, J.N., & Ostriker, J.P., Princeton University Press.
- (33)
- (34) Piran, T., 1998, Physics Reports, in press. astro-ph/9810256
- (35) Piro L., et al., GCN203
- (36) Rees, M. J., & Mészáros, P., 1994, Ap. J. Lett., 430, L93.
- (37) Rhoads, J.E., 1997, Ap. J. Lett., 487, L1.
- (38) Sagar R., GCN227
- (39) Sari, R., 1997, ApJL, 489, 37.
- (40) Sari, R., 1998, Ap. J. Lett., 494, L49.
- (41)
- (42) Sari, R., & Piran, T., 1997, ApJ 485, 270.
- (43) Sari, R., & Piran, T., 1999a, A&A submitted. astro-ph/9901105, denoted SP99
- (44) Sari, R., & Piran, T., 1999b, Ap. J. submitted, astro-ph/9901338, denoted SP99
- (45) Sari, R., Piran, T. & Narayan, R., 1998, ApJ 497 L17.
- (46) Sokolov V. et al., GCN209
- (47)
- (48) Vietri, M., 1997, Ap. J. Lett, 478, L9.
- (49) Waxman, E., 1997, Ap. J., Lett., 491, L19.
- (50) Waxman, E., 1997, Ap. J. Lett. 485, L5.
- (51) Wijers, R.A.M.J., Rees, M.J., and Mészáros, P., 1997, MNRAS, 288, L51.
- (52) Wijers, R.A.M.J. & Galama, T. J. 1998, astro-ph/9805341.
- (53) Woods, E., & Loeb, A., 1995, Ap. J., 383, 292.
- (54) Yadigaroglu, I. A., et al GCN242.
- (55) Zhu, J., & Zhang, H. T., GCN204 .