Radial Transport of Molecular Gas to the Nuclei of Spiral Galaxies
Abstract
The NRO/OVRO imaging survey of molecular gas in 20 spiral galaxies is used to test the theoretical predictions on bar-driven gas transport, bar dissolution, and bulge evolution. In most galaxies in the survey we find gas condensations of 108–109 within the central kiloparsec, the gas masses being comparable to those needed to destroy bars in numerical models. We also find a statistically significant difference in the degree of gas concentration between barred and unbarred galaxies: molecular gas is more concentrated to the central kiloparsec in barred systems. The latter result supports the theories of bar-driven gas transport. Moreover, it constrains the balance between the rate of gas inflow and that of gas consumption (i.e., star formation, etc.), and also constrains the timescale of the possible bar dissolution. Namely, gas inflow rates to the central kiloparsec, averaged over the ages of the bars, must be larger than the mean rates of gas consumption in the central regions in order to cause and maintain the higher gas concentrations in barred galaxies. Also, the timescale for bar dissolution must be longer than that for gas consumption in the central regions by the same token.
1 Introduction
Radial transport of gas in galactic disks likely plays an important role in the formation and evolution of bulges. There are two aspects in the effect of gas transfer to bulges, in both of which stellar bars are involved. First, theories predict that bars efficiently transport interstellar gas to the nuclei of spiral galaxies, providing star forming material to the bulge regions. Second, simulations have shown that the gas accumulation at a galactic center changes the gravitational potential and eventually destroys the bar (c.f., a review by Pfenniger in this workshop). Bulges may grow through this process by gaining stars from disks.
Observationally, evidence for bar-driven gas transport and for bar dissolution has been limited compared to the large amount of theoretical works. The pieces of observational evidence supporting the bar-driven gas transport are the estimation of gas inflow rates in two barred galaxies using CO and NIR observations and dynamical models (Quillen et al. 1995; Regan & Vogel 1997), shallower metallicity gradients in barred than unbarred galaxies (Zaritsky et al. 1994; Martin & Roy 1994), and larger H luminosities in the nuclei of barred galaxies presumably due to larger amount of gas in barred nuclei (e.g., Ho et al. 1995). In order to further investigate the relation between bars, gas, and bulges, it is important to observe gas in many galaxies.
The NRO/OVRO CO imaging survey mapped the distribution of molecular gas in the central kiloparsecs of 20 ordinary nearby spirals using the millimeter arrays of the two observatories (Sakamoto et al. 1998, 1999). The 20 northern spiral galaxies were selected on the basis of inclination (face-on), lack of significant dynamical perturbation, and reasonable single-dish CO flux to allow high-resolution observations. No selection was made on starburst, nuclear activity, far-infrared luminosity, and galaxy morphologies. The sample contains 10 barred (SB+SAB) and 10 unbarred (SA) spirals with the mean distance of 15 Mpc and with luminosities . Our aperture synthesis observations have a mean resolution of (= 300 pc at 15 Mpc) and recovered most ( %) of the single-dish flux. We use the data to set constraints on the above theoretical predictions.
2 Central gas condensations
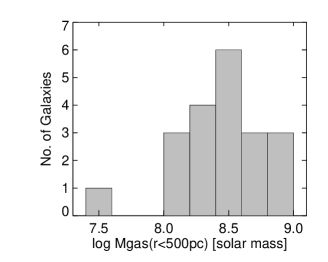
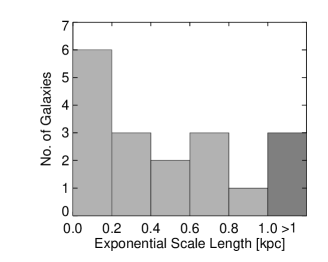
Most galaxies in our sample show strong condensations of CO at their centers. Fig. 1 shows the histogram of CO-derived masses of molecular gas within the central kiloparsec. The central gas masses are mostly in the range of 108–109 . It thus seems not unusual for a large gas-rich galaxy to have a condensation of such a large amount of gas at the center. The gas condensations generally have radial profiles sharply peaking toward the galactic centers, when observed with sub-kiloparsec resolutions. The distribution of radial scale lengths of CO is also in Fig. 1. The central scale length is defined as the radius at which a radial profile falls to of its maximum value, and is not affected much by the missing flux (15 % error at most). It is apparent that most galaxies have sub-kiloparsec scale lengths in the nuclear regions. The gas condensations are thus not simple extensions of outer exponential disks, which usually have scale lengths larger than a few kpc. It is interesting to note that the highest mass of the gas condensations, 109 , is comparable to the mass needed to destroy bars in simulations.
3 Higher gas concentrations in barred galaxies
In order to quantify the degree of gas concentration in disk galaxies, we compare in Fig. 2 the gas surface densities averaged in the central kiloparsec with those averaged over the optical galactic disks (i.e., ). The former are calculated from our data and the latter are calculated from the single-dish mapping data of the FCRAO survey (Young et al. 1995). The ratio of the two surface densities, , is an indicator of gas concentration to the central kiloparsec. The concentration factor shows more than 100-fold variation in our sample.
Barred (i.e., SB+SAB) and unbarred (SA) galaxies are plotted with different symbols in Fig. 2. It is apparent that barred galaxies have higher concentration factors than unbarred galaxies. The difference is statistically significant according to the Kolmogorov-Smirnov test; the probability to observe the difference of in Fig. 2 would be 0.007 if there were no difference between the two classes of galaxies.


We note that the conversion factor from CO flux to mass of molecular gas, , is unlikely to produce the difference of between barred and unbarred galaxies. The ratio is independent of if it has the same form of radial distribution in galaxies, e.g., being either (const.), , or with the same radial scale . The multiplier can be different from one galaxy to another without changing . A systematic difference in the radial profile of between barred and unbarred galaxies may exist if the conversion factor scales with metallicity. However, the shallower metallicity gradients in barred galaxies would make the apparent CO concentrations lower in barred galaxies. Thus the correction for metallicity would only enhance the difference of between the two types of galaxies. No other cause is known to create a systematic difference in radial profiles of between barred and unbarred systems.
We used classifications in the Third Reference Catalogue to distinguish barred and unbarred galaxies. It is possible that the classifications based on optical images missed small nuclear bars or misidentified open spiral arms as a bar. However, nuclear bars naturally have smaller power of gas transport, and spiral arms masquerading a bar create a global nonaxisymmetry in the gravitational potential as a bar does. Thus the optical classification is a qualitative index of the strength of nonaxisymmetry in mass distribution and in gravitational potential. We conclude therefore that galaxies with larger nonaxisymmetries (called ‘barred’ galaxies) have higher gas concentrations than galaxies with smaller nonaxisymmetries (i.e., ‘unbarred’ galaxies) 111The gas concentrations in unbarred galaxies are low but . They may be due to the bars that had been destroyed, but they do not necessarily require the bar dissolution, because they may be also due to viscous accretion of gas, weak but finite nonaxisymmetries in those galaxies, or the centrally peaked distribution of stars that produce gas. .
4 Implications to the bar-dissolution scenario
The higher gas concentrations in barred galaxies are most likely due to radial transport of gas in the barred potentials. However, the transport of gas is not a sufficient condition to cause and maintain the higher gas concentrations in barred galaxies. It is also necessary that the molecular gas funneled to the galactic centers remains there in molecular form and that the bars responsible for the gas transport remain. These requirements set constraints on the relation between the rates of gas inflow and gas consumption, and also on the timescale for the possible bar dissolution.
First, the total amount of gas funneled to the center of a barred galaxy must be larger than the total amount of stars formed in the same region, because otherwise the higher gas concentration in the barred galaxy can not be sustained. Dividing the total masses by the age of the bar, the above relation translates to the condition that the time-averaged rate of gas inflow must be larger than that of star formation. One may be able to estimate the time-averaged rate of star formation from an ensemble-average of star formation rates in the centers of barred galaxies, thereby setting a lower limit to the mean gas inflow rate. If there are other ways of loosing molecular gas, such as a gas outflow due to starburst and accretion to active nucleus, then the lower limit becomes higher.
The second condition we can deduce is that the timescale of gas consumption in the central regions is longer than that of the possible bar dissolution. In other words, if bars are to be destroyed by the gas inflow of 108–109 to the central kiloparsec and if the bar dissolution is much quicker than the gas consumption in the central regions, then we would see currently unbarred but previously barred galaxies with high central gas concentrations that destroyed the bars. The lack of such galaxies (i.e., unbarred spirals with ) allows us to set the above condition on the timescale of bar dissolution.
Quantitative evaluation of the above conditions is hampered by the difficulty in accurately estimating star formation rates in galactic centers. The current star formation rates crudely estimated from H in the centers of the sample galaxies are –1 yr-1, which set a lower limit to the mass inflow rate. The consumption time of the gas concentrations is 108–1010 yrs. The lower value does not contradict with the predicted timescale of bar dissolution, which is comparable to the dynamical time or a few 108 yrs. If the higher value is the case in many spirals, then the bar dissolution must take longer time than predicted, or will not happen for the 108–109 gas concentrations.
It seems worthwhile to compile more data of gas concentration and star formation to tighten the above constraints on the mass transfer in galactic disks and on the fate of stellar bars. The index of gas concentration may be useable as a tool to find out unbarred galaxies that were barred and galaxies with young bars: the former must have higher concentration factors for unbarred galaxies and the latter must have lower factors for barred galaxies. Observations of such galaxies would tell us about evolution of disks, bars, and bulges.
Acknowledgements.
Stimulating conversations at the workshop with Drs. Norman, Pfenniger, Hasan, Regan, and Wada are acknowledged. K.S. was supported by JSPS grant-in-aid.References
- Ho et al. (1995) Ho, L. C., Filippenko, A. V., & Sargent, W. L. W., 1997 ApJ, 487, 591
- Quillen et al. (1995) Quillen, A. C. et al. 1995, ApJ, 441, 549
- Regan et al. (1997) Regan, M. W., Vogel, S. N., & Teuben, P. J. 1997, ApJ, 482, L143
- Sakamoto et al. (1998) Sakamoto, K., Okumura, S., Ishizuki, S., & Scoville, N. Z. 1998, IAU Symp. 184, 215
- Sakamoto et al. (1999) Sakamoto, K., Okumura, S., Ishizuki, S., & Scoville, N. Z. 1999, ApJ, submitted
- Young et al. (1995) Young. J. S. et al. 1995, ApJS, 98, 219
- Zaritsky et al. (1994) Zaritsky, D., Kennicut, R. C., & Huchra, J. H. 1994, ApJ, 420, 87