Alignments of the Dominant Galaxies in Poor Clusters
Abstract
We have examined the orientations of brightest cluster galaxies (BCGs) in poor MKW and AWM clusters and find that, like their counterparts in richer Abell clusters, poor cluster BCGs exhibit a strong propensity to be aligned with the principal axes of their host clusters as well as the surrounding distribution of nearby Mpc) Abell clusters. The processes responsible for dominant galaxy alignments are therefore independent of cluster richness. We argue that these alignments most likely arise from anisotropic infall of material into clusters along large-scale filaments.
1 Introduction
The orientation of galaxies is one more piece to be fit into the puzzle of galaxy formation. Statistically significant evidence for alignments between the principal axes of rich Abell clusters and the major axes of their dominant galaxies (hereafter referred to as Brightest Cluster Galaxies, or BCGs) has been reported by numerous authors (Sastry 1968; Carter & Metcalfe 1980; Struble & Peebles 1985; Rhee & Katgert 1987; Lambas, Groth, & Peebles 1988). Struble (1990) and Trevese, Cirimele, & Flin (1992) found that the BCG major axis is also aligned with the line joining the first and second brightest galaxies, and that the second brightest galaxy is weakly aligned with the first. There is also solid evidence that BCGs and their parent clusters are aligned with the distribution of neighbouring clusters on scales up to several tens of Mpc 222We adopt H0=100 km/sec/Mpc in this paper (Binggeli 1982; Lambas et al. 1990; West 1994). For instance, West (1994) finds that there is significant alignment (at 99.9% confidence) of the innermost regions ( 2h-1 kpc) of 147 Abell Cluster BCGs with the distribution of neighbouring rich clusters out to 10h-1 Mpc.
While many studies have been done, they have focused almost exclusively on rich clusters, so the effect of cluster environment on the alignment effects is not known. In order to investigate whether cluster richness influences the alignment effects, we have obtained CCD images of the BCGs of some poor clusters. Morgan, Kayser, & White (1975, MKW) and later Albert, White, & Morgan (1977, AWM) catalogued 23 candidate BCGs located in poor clusters. These poor clusters contain a few tens of bright galaxies and have virial masses of – M⊙ (e.g., Beers et al. 1995), compared to – M⊙ for rich Abell clusters (e.g., Carlberg et al. 1996). Beers et al. (1995) find a median velocity dispersion of 336 km/sec for 21 MKW/AWM poor clusters, about half that found in rich clusters (e.g., Zabludoff et al. 1990).
Flin et al. (1995) examined the MKW and AWM poor clusters for alignments between the parent cluster position angle and the position angles of the two brightest galaxies and found an alignment for the first brightest galaxies but not the second. Their observations were taken in 1986 with a 105 cm Schmidt telescope using photographic plates, and galaxy and cluster orientations were estimated by eye. Our study improves considerably on this previous work, since CCDs are much more sensitive and have improved linearity over photographic plates and thus capture faint features more reliably. Also, our use of automated surface photometry procedures allow a more accurate determination of galaxy position angles. Using these data, we have investigated whether poor cluster BCGs are aligned with their host cluster, and if they are also aligned on larger scales with the distribution of surrounding Abell clusters.
Our observations and data reductions are described in the following section. In §III we examine the evidence for alignments of BCGs in poor clusters, and in §IV we discuss the theoretical implications of our results.
2 Observations and Data Reduction
Images of BCGs in 21 of the 23 MKW/AWM clusters were obtained using the 1.0m Jacobus Kapteyn Telescope (JKT) during an observing run in April 1994 and another in April 1995. With the JKT in its configuration, the image scale of and CCD size of yielded a field of . We obtained 900 sec band images in the first run and 900 sec and/or 600 sec images in the second.
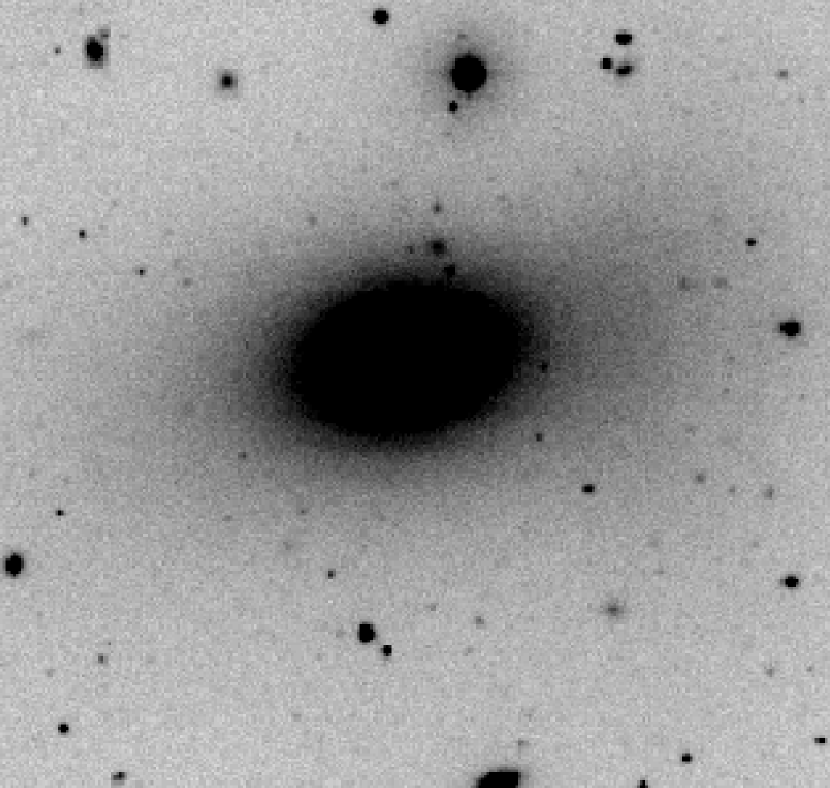
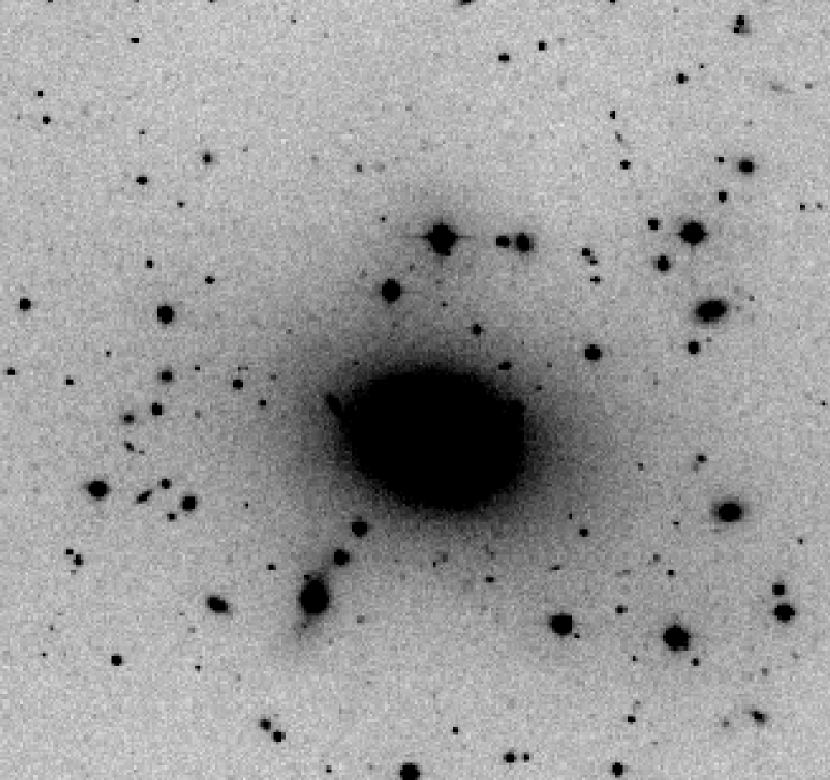
The data were preprocessed (bias-subtracted, flat fielded, and trimmed) using the IRAF CCDPROC package. Flat fielding was performed using both twilight flats and dark sky flats, and the residual gradients in the final images were about 1.0% of the sky intensity. Contaminating objects (e.g. stars, cluster and background galaxies) were identified by eye and masked using generous radii. Figure 1 shows images of two galaxies in our sample.
The BCG position angles were measured with the STSDAS task ellipse. This task uses the iterative method of Jedrzejewski (1987) to fit isophotal ellipses to galaxies. The user supplies initial estimates for the position angle, ellipticity, and ellipse center, and specifies the final semi-major axis distance. The routine samples the images along an elliptical path and produces a one dimensional intensity distribution as a function of the ellipse eccentric anomaly, . The Fourier harmonics of the distribution are fit by least-squares to the function
Next, the five ellipse parameters are adjusted by a correction found from the amplitudes , and . The parameter with the largest amplitude is varied, a new elliptical path is chosen, and the image is resampled. The task stops after a user specified number of iterations or after the solution has converged, and the best fitting ellipse is given by the parameters that produced the lowest absolute values of the harmonic amplitude. The output consists of the five ellipse parameters ( and centroids, ellipticity, position angle and axis length), plus higher-order harmonics characterizing the departures from purely elliptical isophotes. The routine is fairly insensitive to the initial estimates; the deviations incurred here are much smaller than the variation in the position angle with radius.
3 Analysis
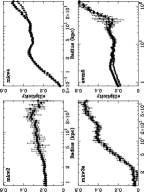
The position angles listed in Table 1 were averaged over radii less than 6 kpc where the isophote intensity was high. The errors given are one standard deviation of the mean. The central few arcseconds were excluded since seeing effects become stronger in the core and tend to make the isophotes round. For 5 galaxies (MKW 2, 2S, 3S, 4, and AWM 5) we obtained both and data, and the position angles given are average values. Figures 2 and 3 show the ellipticity and position angle profiles for a sample of the poor cluster BCGs. None of the galaxies in this study displayed significant isophotal twisting. The largest degree of twisting was in AWM 3, which is much smaller than the twists found by Porter et al. (1991) in a sample of bright ellipticals.
To determine if the BCG position angles were aligned with their parent clusters, we applied the Kolmogorov-Smirnov (K-S) test. We discarded any galaxies with mean position angle errors of , or mean ellipticities () of less than 0.2 since round galaxies do not have well defined major axes. After application of these limitations there were 9 BCG-parent cluster pairs. Figure 4 shows the cumulative probability distribution as a function of the alignment angle between the BCGs and their parent clusters, and for a random distribution of angles. The cluster position angles were taken from Flin et al. (1995). Since the alignment angles must be sorted according to size to apply the K-S test and random angles are all equally probable, the cumulative probability distribution for a random set of angles is a straight line with a slope of 1. The BCG position angles clearly show a departure from a random distribution. The K-S test allows us to reject the hypothesis that the alignment angles come from a random distribution at the 92% level. Thus, we may say with confidence that the major axes of poor cluster dominant galaxies are aligned with their parent clusters, in agreement with Flin et al. (1995).
Next, we located the Abell clusters within Mpc and measured the acute angle between the BCG major axis and the great circle connecting the galaxy with the Abell cluster. After applying the above restrictions on the ellipticity and position angle, our sample contained 10 MKW/AWM clusters that had one or more neighbouring Abell clusters; in all there were 15 galaxy-Abell cluster pairs. Figure 5 shows the cumulative probability distribution for the angle between the BCG major axis and the principal axis of the host cluster. The K-S test shows that the distribution is non-random at the 99% level. Hence these results indicate that BCGs in poor clusters are as strongly aligned with their environs as are their counterparts in richer Abell clusters (see, e.g., West 1994).
The K-S test does not take into consideration the errors in the position angles, so we performed a series of 1000 K-S tests on data generated by adding random deviations of to the measured position angles. This value was chosen since it is one of our criteria for rejection of position angles and is a generous error allowance. The median significance level of the 1000 K-S tests for the BCG-parent cluster data was , and for the BCG-Abell cluster data (errors are . This robust test demonstrates that the alignment effect is not easily masked by variations of up to in the position angles.
A K-S test using only those Abell clusters within Mpc was inconclusive owing to the small sample size, as there are relatively few neighboring clusters within this separation. When all Abell clusters within Mpc were included no significant departures from randomness were found.
| cluster | aaPosition angles were measured north through east. | BCG ellipticity | bbCluster position angles from Flin et al. 1995 |
|---|---|---|---|
| (degrees) | (degrees) | ||
| MKW 1 | 46 3 | 0.28 | 50 |
| MKW 2 | 41 2 | 0.22 | 60 |
| MKW 4 | 101 1 | 0.30 | 120 |
| MKW 5 | 98 5 | 0.13 | |
| MKW 6 | 106 2 | 0.45 | 56 |
| MKW 7 | 168 3 | 0.10 | 150 |
| MKW 8 | 103 11 | 0.14 | 10 |
| MKW 9 | 55 30 | 0.05 | |
| MKW 10 | 171 4 | 0.40 | 175 |
| MKW 11 | 172 8 | 0.25 | 165 |
| MKW 12 | 105 7 | 0.14 | 65 |
| MKW 1s | 15 1 | 0.24 | 140 |
| MKW 2s | 148 2 | 0.10 | 130 |
| MKW 3s | 103 1 | 0.21 | |
| MKW 4s | 30 1 | 0.38 | 55 |
| AWM 1 | 65 2 | 0.21 | 20 |
| AWM 3 | 92 1 | 0.26 | |
| AWM 4 | 167 1 | 0.25 | |
| AWM 5 | 82 1 | 0.26 | |
| AWM 6 | 116 4 | 0.45 | |
| AWM 7 | 69 5 | 0.20 |
4 Discussion
The observed alignments of BCGs, clusters and superclusters a coherence of structures over scales from tens of kpc to tens of Mpc must surely be an important clue about how these objects formed. The results presented in this paper provide an important new piece of information: whatever mechanism is responsible for producing alignments of BCGs with their surroundings, it appears to operate equally well in both rich and poor clusters.
We believe that these alignments are readily explained by hierarchical models of structure formation in which BCGs and clusters are built by infall of material that flows along the filamentary superclusters in which they are embedded. In such a scenario clusters and their brightest member galaxies are built by a series of mergers that occur preferentially along the direction defined by the filament, and hence these objects will naturally develop orientations that reflect the surrounding filamentary pattern of superclustering. In this way the matter distribution on supercluster scales influences the properties of clusters and their BCGs. Such a process would be expected to produce alignments of BCGs in both poor and rich clusters.
This picture of cluster and BCG formation via anisotropic mergers is strongly supported by theoretical work and numerical simulations which have shown that infall of material into clusters along filaments is a generic feature of most gravitational instability models of structure formation. (e.g., Bond 1987; Bond, Kofman & Pogosyan 1996; van Haarlem & van de Weygaert 1993; West 1994; Dubinski 1998). Observational evidence also supports this idea; for example, West, Jones & Forman (1995) showed that the distribution of merging subclusters in clusters – the building blocks from which rich clusters are made – traces the surrounding filamentary distribution of matter on supercluster scales. Assuming that BCGs formed by mergers, then it is natural to expect that such mergers will also occur preferentially along the direction defined by the cluster principal axis, which is itself dictated by the surrounding filamentary mass distribution on supercluster scales.
The fact that BCGs in poor clusters exhibit the same alignment effect that is seen in the richer Abell clusters indicates that this alignment phenomenon is not limited to the most massive galaxy clusters. The possibility that such galaxy alignments might extend to even sparser groups is worth exploring.
5 Summary
We have shown that the brightest member galaxies in poor MKW/AWM clusters are preferentially aligned with the principal axes of their host clusters, and that they also point towards nearby rich clusters. BCG-parent cluster alignments and BCG-nearby cluster alignments are observed in both poor and rich clusters, and furthermore the degree of alignment is very significant in both types of clusters. These two observations assert that cluster richness cannot be a factor in producing alignments. We suggest that these alignments are most likely produced by formation of (rich and poor) cluster BCGs by infall along filamentary structures, which are a generic feature of many models for the formation of large scale structure.
6 Acknowledgments
MJW and TMF were supported by a grant from NSERC of Canada.
References
- Albert et al. (1977) Albert, C. E., White, R. A., and Morgan, W. W. 1977, ApJ, 211, 309
- Beers et al. (1995) Beers, T.C., Kriessler, J.R., Bird, C.M., & Huchra, J.P. 1995, AJ, 109, 874
- Binggeli (1982) Binggeli, B. 1982, A&A, 107, 338
- Bonf (1987) Bond, J.R., 1987, in Nearly Normal Galaxies: From the Planck Time to the Present, ed. S. Faber (New York: Springer-Verlag), p. 388.
- (5) Bond, J.R., Kofman, L., & Pogosyan, D., 1996, Nature, 380, 603.
- Carlberg et al. (1996) Carlberg, R.G., Yee, H.K.C., Ellingson, E., Abraham, R., Gravel, P., Morris, S., & Pritchet, C.J. 1996, ApJ, 462, 32
- Carter & Metcalfe (1980) Carter, D., and Metcalfe, J. 1980, MNRAS, 191, 325
- Dubunski (1998) Dubinski, J. 1998, ApJ, 502, 141
- Flin et al. (1995) Flin, P., Trevese, D., Krywult, J., and Cirimele, G. 1995, SESTO Meeting “Observational Cosmology” July 1995
- Jedrzejewski (1987) Jedrzejewski, R. I. 1987, MNRAS, 226, 747
- Lambas et al. (1988) Lambas, D. G., Groth, E. J., and Peebles, P. J. E. 1988, AJ, 95, 996
- Lambas et al. (1990) Lambas, D.G., Mariano, N., Muriel, H., & Ruiz, L. 1990, AJ, 100, 1006
- Morgan et al. (1975) Morgan, W. W., Kayser, S., and White, R. A. 1975, ApJ, 199, 545
- Rhee & Katgert (1987) Rhee, G. F. R. N., and Katgert, P. 1987, A&A, 183, 217
- Porter et al. (1991) Porter, A. C., Schneider, D. P., and Hoessel, J. G. 1991, AJ, 101, 1561
- Sastry (1968) Sastry, G. N. 1968, PASP, 83, 313
- Struble (1990) Struble, M. F. 1990, AJ, 99, 743
- Struble & Peebles (1985) Struble, M. F., and Peebles, P. J. E. 1985, AJ, 99, 743
- Trevese et al. (1992) Trevese, D., Cirimele, G., and Flin, P. 1992, AJ, 104, 935
- van Haarlem & van de Weygaert (1993) van Haarlem, M., & van de Weygaert 1993, ApJ, 418, 544
- West (1994) West, M. J. 1994, MNRAS, 268, 79
- West, Jones & Forman (1995) West, M.J., Jones, C., & Forman, W., 1995, ApJ, 451, L5.
- Zabludoff et al. (1990) Zabludoff, A.I., Geller, M.J., Huchra, J.P., & Vogeley, M.S. 1990, ApJS, 74, 1