BURSTS FROM GS 1826-238: A CLOCKED THERMONUCLEAR FLASHES GENERATOR
Abstract
The transient X-ray source GS 1826-238 was monitored during five different observing periods between August 1996 and October 1998 with the BeppoSAX Wide Field Camera instrument in the framework of a deep observation of the Galactic Center region. A first detection of X-ray bursts from this source occurred, ruling out its previously suggested black hole candidacy and strongly suggesting the compact object to be a weakly magnetized neutron star. During the 2.5 years of monitoring, corresponding to Ms observing time, 70 bursts were detected from the source. We here report a quasi-periodicity of hr in the burst occurrence time which is present during all observations. This is the first example of quasi-periodic bursting over a period of years. It is in line with the history of a rather constant flux since the turn on in 1988 and points to a very stable accretion.
1 INTRODUCTION
GS 1826-238 was serendipitously detected on September 8, 1988 with an average X-ray flux of about 26 mCrab in the 1-40 keV range (Makino et al. (1988)). During September 9-16, 1988, rapid fluctuations (flickering) were observed on time scales down to 2 ms (Tanaka (1989)). In the GINGA All Sky Monitor the source was below 50 mCrab during the period from August through October 1988 (Tanaka & Lewin (1995)). Since no detections were available from previous X-ray observations, GS 1826-238 was tentatively reported as transient. Moreover, similarity with Cyg X-1 and GX 339-4 in the low (hard) state, both in spectrum and temporal behavior, suggested to tentatively consider the source as a black hole candidate (BHC) (Tanaka (1989)). The GINGA spectrum was in fact well fitted by a single power law with photon index ( is defined through where is the number of photons per keV of energy and a constant).
In 1989 the source was detected by TTM on March 17 (in ’t Zand (1992)) at a flux of about 32 mCrab in the energy range 2-28 keV. Later on the source was observed in October 1990 and June and October 1992 with the ROSAT PSPC (Barret et al. (1995)) and no bursts were detected during 8 hours of net exposure time. The spectrum was well fitted by a power law with a photon index in the range plus absorption with a hydrogen column density toward GS 1826-238 of about cm-2. Follow-up optical studies led to the identification of a V=19.3 optical counterpart located at and (equinox 2000.0). The ROSAT source was inside the GINGA error box as well as inside a larger one of an unidentified X-ray burster (van Paradijs (1995)) observed with OSO 7 (Markert et al. (1977)) and OSO 8 (Becker et al. (1976)). The error box of the unidentified X-ray burster also contains the source 4U1831-23 (Forman et al. (1978)). Barret et al. (1995) point out that the faintness of the optical counterpart indicates that the source could be a LMXB. Given the coincidence of GS 1826-238 with the large error box of a burster and the lack of burst detections only weakly favours the black hole hypothesis.
During November 1994 the source was detected with OSSE at 7.5 standard
deviations in the 60-200 keV range (Strickman et al. (1996)) with a spectral fit
consistent with a power law with photon index . The
authors suggested
the nature of the compact object to be a neutron star (NS) in view of the
variability characteristics of the source and a hard X-ray spectral behavior
not being unique to black hole candidates. A wide-band spectral fit had been
obtained over the 1.5-200 keV range by combining data from GINGA
(September 1988) and OSSE (November 1994) and assuming no flux difference
between the two observations (Strickman et al. (1996)). The fit was well
represented by an exponentially cut-off power law (cut-off energy about
58 keV, photon index with a reflection term. The latter
result suggested a similarity with previously studied NS systems showing at
high energies (40-200 keV) a spectral photon index of while
black hole candidates usually have a harder spectral photon index (around 2)
as was also reported by Bazzano et al.. (1996). The suggestion that GS 1826-238 could
contain a NS was also discussed in detail by Barret et al. (1996).
The recent detection of the 2.1 h optical modulation (Homer et al (1998))
is a strong hint for a compact system.
We observed GS 1826-238 for 2.4 Ms during 5 periods in a time span of 2.5 yr. This paper focuses on Primary WFC and Science Performance Verification data, for a total of Ms, showing a remarkable quasi-periodicity in the burst occurrence times.
2 OBSERVATIONS AND DATA ANALYSIS
The Wide Field Cameras (WFC) (Jager et al. (1997)) are designed for performing spatially resolved simultaneous monitoring of X-ray sources in fields of size , enabling systematic studies of spectral variability up to time resolutions near 1 ms. The mCrab sensitivity in 2-28 keV over a large field of view (FOV) and the near-to-continuous operation over a period of years offer the unique opportunity to observe the long-term bursting behavior of new as well as already known (weak) sources.
This is one of the most important reasons that the Galactic Bulge is being monitored in 1 to 2 month periods during each of the visibility periods since the beginning of the BeppoSAX operational life in July 1996. During the observations through October 1998, that combine to a total of Ms exposure time, at least 45 sources and about 600 bursts have been detected (Ubertini et al. (1998)).
It was from the second visibility period on, between March 18 and April 11, 1997, that the observations were analyzed in a near-to-real-time fashion and it was then noted that GS 1826-238 exhibits X-ray bursts (Ubertini et al. (1997)). This is the first report of burst activity from this source. Typical time profiles of a burst, detected on MJD 50342.54202, is plotted in Figure 1 in three different energy ranges. We performed an analysis of the spectral evolution of two bursts detected in MJD 50340.38703 and MJD 50342.54202 through modeling with black body radiation; the results are given in table 1. We show these bursts in particular because the source was close to the center of the FOV and, thus, the sensitivity was near optimum. The analysis points out 1) that the burst spectra are consistent with black body radiation with temperatures between roughly 1 and 2 keV, and 2) that there is a cooling trend during the decay of the bursts. This characterization of the two bursts identifies them as type I X-ray bursts which are presumed to result from a thermonuclear helium flash on the surface of a weakly magnetized neutron star. This definitely eliminates the black hole hypothesis for GS 1826-238 as already suggested by Bazzano et al., 1997.
An extensive search for bursts from GS 1826-238 was performed on the whole data set covering August 1996 through October 1998. A total of 70 bursts were found. This is a large number, during the WFC observations of the Galactic Bulge there are only two sources with more bursts (GX 354–0 and GRO 1744–28 that is a well known type II burster). A simple analysis of the burst occurrence times immediately resulted in a surprising result. Figure 2 (top) shows a histogram of the wait times between the 70 bursts. It has a pronounced peak at 5.76 hr and at twice that time. None of the wait times is smaller than 5.34 hrs. Figure 2 (bottom) shows a histogram of the wait times folded in a range of periods. A Gaussian fit to the distribution results in a peak at 5.76 hr and a full width at half maximum of 37 min. Furthermore, the detection of burst/day during live time observation indicates that bursts are always present at the expected occurrence time at the intensity level detectable by the WFC, corresponding to mCrab for a source at from the center of the FOV and a burst duration of s, as is almost always the case for the GS 1826-238 observations. This is consistent with the source continuously bursting at times when it was monitored by WFC.
Previous burst searches (Barret et al. (1995)) carried out in order to disentangle the nature of this originally classified BHC (Tanaka (1989)) were unsuccessful. This is not surprising in view of the relatively short observation times of these attempts, but we cannot rule out a different source state in the pre-BeppoSAX observations. Also, the recurrence period is almost a factor of 4 longer than the period of low-earth orbits that X-ray detectors on ROSAT, RXTE and BeppoSAX are in. This increases the chance that whole sequences of bursts are missed by fairly long observations.
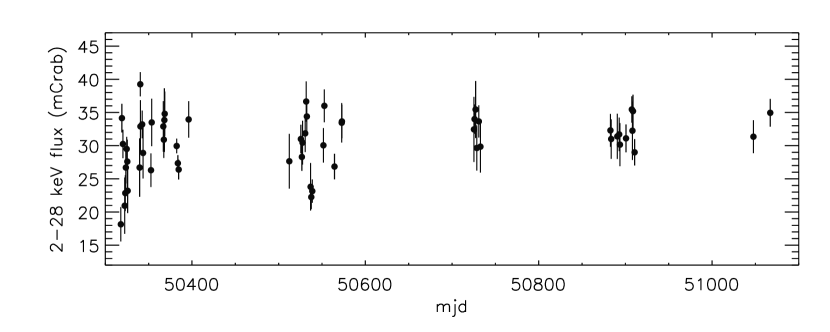
Whenever observed with the WFCs the source shows a low persistent emission of mCrab with an intensity variation between 27 and 39 mCrab with no clear long term trend as shown in Figure 3. This intensity corresponds to an average flux of in the 2-28 keV range (in the WFC 1 Crab corresponds to in the 2-28 keV range). The long term monitoring performed with the ASM on board RXTE in the same time frame as with WFC but with more uniform time coverage in the 2-10 keV range shows an average intensity from 1.5 to 2.9 ct/s (1ct/s is equivalent to ). This is consistent with the WFC measured flux, that corresponds to a luminosity of erg s-1 at a distance of 10 kpc.
3 DISCUSSION
A quasi-periodicity in burst occurrences is not unique to GS 1826-238: regular type I bursting was seen in 1658-298, 1820-303 and 1323-619 (see review by Lewin, van Paradijs, & Taam (1995) and references therein) among others. However, the stability of the clock for 2.5 yr is a unique feature of GS 1826-238. There have never been hints of this in any of the other known X-ray bursters (although it should be noted that observational selection effects may play an important role in the detection). The quasi-periodicity is an exhibition of a stable accretion process. The fuel for the bursts must be continuously replenished at a constant rate in order to provide the circumstances for such a regular ignition of thermonuclear flashes. The fact that the regularity lasts such a long time strongly indicates that there is no reservoir of fuel because it is expected in general that such reservoirs will be exhausted after a few hundred bursts (Lamb & Lamb (1978)) while the expected number of bursts from GS 1826-238 during 2.5 yr for a periodicity of 5.76 hr would be of the order of . This notion is very useful in the interpretation of the so-called parameter. This is the ratio of the bolometric energy of the non-burst emission between two bursts to that of the burst following that period. This ratio is proportional to the amount of energy per nucleon liberated during the nuclear fusion process and can potentially constrain the fusion process (i.e., whether hydrogen, helium or another composition of gas is burned).
We can determine energies of the burst and persistent emission only in the WFC bandpass of 2 to 28 keV. As mentioned in the introduction, the persistent emission has a hard spectrum which can only be assessed accurately in a broad bandpass. Therefore, we extrapolate its spectrum from the WFC bandpass to the 1 to 58 keV band, the upper limit corresponding to the cut-off energy (Strickman et al. (1996)). The resulting average bolometric flux, corresponding to mCrab in 2 to 28 keV, is erg cm-2 erg cm-2 . In 5.76 hr this accumulates to a fluence of erg cm-2. The burst energies are easier to assess because their spectra are nearly completely contained in the WFC bandpass. We derive an average fluence of erg cm-2 over the two bursts here analyzed. Thus . There are a few effects which can bias , see Lewin, Van Paradijs & Taam (1993).. Through the quasi-periodicity one can at least eliminate one of them: that a reservoir of fuel would suppress . The value of =60 is commonly observed and confirms the picture that helium is burned during the flash.
In table 2, a history of GS 1826-238 fluxes since the 1988 discovery is
presented. This indicates that since 1988 the source behaves as a weak,
persistent source showing variability of a few tens of percents at
most in the 1 to 30 or 40 keV energy band. Given the low flux and the meager
coverage of the sky position by sensitive X-ray telescopes prior to 1988, one
may be prompted to question the transient nature of GS 1826-238. Prior to 1988
the position was covered by a number of survey instruments such as on
UHURU (Forman et al. (1978)) and ARIEL V (Warwick et al. (1981)). These
instruments surveyed the sky during the 1970s. The source
detected nearest to GS 1826-238 was 4U 1831-23, at an angular separation of
14. Given the small error box of 4U 1831-23, this implies that both
sources cannot be the same and that GS 1826-238 was not detected (see also
Barret et al. (1995)). From the flux numbers for 4U 1831-23 we estimate conservatively
the upper limit for GS 1826-238 to be 2 mCrab in 2 to 10 keV, that is one
order of magnitude smaller than after 1988. We conclude that, since then,
GS 1826-238 is a weak (20 to 40 mCrab) persistent source with a very stable
accretion flow of /y, at 10 kpc.
We are continuing the analysis of the whole data set, in particular to characterize each individual burst with respect to burst duration, fluence, and peak flux and study the correlation between the burst properties and the level of persistent emission and the wait time. Furthermore, an analysis of a sensitive observation with the narrow-field instruments on BeppoSAX in ongoing (In ’t Zand et al., in preparation).
Acknowledgments
References
- Barret et al. (1995) Barret, D., Motch, C., and Pietch, W., 1995, A&A, 303, 526
- Barret et al. (1996) Barret, D., Mc Clintock, J.E., and Grindlay, J.E., 1996, ApJ, 473, 963
- Bazzano et al.. (1996) Bazzano A. et al., 1996, ESA SP 382, 261, ”The Transparent Universe, 2nd Integral Workshop”
- Bazzano et al. (1997) Bazzano A. et al., 1997, AIP Conf. Proc. N. 410, 729, 1997
- Becker et al. (1976) Becker R.H., et al. 1976, IAU circ. 2953
- Forman et al. (1978) Forman W. et al., 1978, Ap. J. Suppl., 38, 357
- Homer et al (1998) Homer L., Charles, P.A. and O’Donogue, D., Mon. Not. Astron. Soc., 1998 (in press)
- Jager et al. (1997) Jager, R., et al. 1997, A&A, 125, 557
- in ’t Zand (1992) in ’t Zand J.J.M., 1992, Ph.D. thesis, Utrecht University
- in ’t Zand (1999) in ’t Zand J.J.M., 1999, in preparation
- Lamb & Lamb (1978) Lamb D.Q. and Lamb, F.K., 1978, Ap. J., 220, 291
- Lewin, van Paradijs, & Taam (1995) Lewin, W.H.G., van Paradijs, J., & Taam, R.E. 1995, in ”X-ray Binaries”, ed. W. Lewin, J. van Paradijs, & E. van den Heuvel, Cambridge University Press, Cambridge, p. 175
- Makino et al. (1988) Makino F., et al. 1988, IAUC 4653.
- Markert et al. (1977) Markert T. H., et al., 1977, Ap.J. 218, 801 Ruderman M., 1972, Ann. Rev. Astr. Ap., 10, 427 Shapiro, S.L. and Teukolsky S.A., 1983, Black Holes, White Dwarfs and Neutron Stars (New York:Wiley), 348 Smale, A.P., Zhang, W., and White, N.E., 1997, ApJ, 483, L119
- Strickman et al. (1996) Strickman M. et al., 1996, A&ASuppl. Ser., 120, 217
- Tanaka (1989) Tanaka Y., 1989, proceeding of 23rd ESLAB Symp, pag. 3
- Tanaka & Lewin (1995) Tanaka Y. & Lewin, W.G.A., 1995, in X-ray Binaries, Cambridge University Press, Series 26, pag. 126
- Ubertini et al. (1997) Ubertini P., et al., 1997, IAU circ. 6611
- Ubertini et al. (1998) Ubertini P., et al., 1998, Proceedings of ”The Extreme Universe, 3rd Integral Workshop”, Taormina, Italy, 14-18 Sept. 1998, in press
- Warwick et al. (1981) Warwick R.S. et al., 1981, MNRAS 197, 865 van Paradijs, J., and Lewin, W.H.G., 1985, A&A, 157, L10
- van Paradijs (1995) van Paradijs J., 1995, in ”X-Ray Binaries” ed. W. Lewin, J. van Paradijs & E. van den Heuvel, Cambridge University Press, Cambridge, p. 536 Zhang W., Stromayer, T.E. and Swank, J.H., 1997, ApJ, 482, L167
| MJD 50340 burst | MJD 50342 burst | ||||||
|---|---|---|---|---|---|---|---|
| Burst Period | Total | Peak | Tail | Total | Peak | Tail | |
| Integration Time (s) | |||||||
| Temperature (keV) | |||||||
| (km) at 10 kpc | |||||||
| (27 d.o.f.) | |||||||
| Burst e-folding time (s) in different energy bands | |||||||
| keV | |||||||
| keV | |||||||
| keV | |||||||
| Energy range (keV) | Instrument/Satellite | Year | Flux (erg ) | Reference |
|---|---|---|---|---|
| ASM/GINGA | Tanaka & Lewin (1995) | |||
| LAPC/GINGA | Tanaka (1989) | |||
| TTM/MIR | in ’t Zand (1992) | |||
| ROSAT | Barret et al. (1995) | |||
| ASM/RXTE | Public Data | |||
| WFC/BeppoSAX | Ubertini et al. (1998) |