Central UV Spikes in two Galactic Spheroids††thanks: Based on observations with the NASA/ESA Hubble Space Telescope, obtained at the Space Telescope Science Institute, which is operated by AURA, Inc., under NASA Contract NAS 5-26555.
Abstract
FOS spectra and FOC photometry of two centrally located, UV-bright spikes in the elliptical galaxy NGC 4552 and the bulge-dominated early spiral NGC 2681, are presented. These spectra reveal that such point-like UV sources detected by means of HST within a relatively large fraction (%) of bulges can be related to radically different phenomena. While the UV unresolved emission in NGC 4552 represents a transient event likely induced by an accretion event onto a supermassive black hole, the spike seen at the center of NGC 2681 is not variable and it is stellar in nature.
1 Introduction
HST UV images of nearby galaxies presented by Maoz et al. (1996) and Barth et al. (1998), as well as analogous space-borne optical images of early-type galaxies discussed by Lauer et al. (1995) and Carollo et al. (1997) have shown that about 15% of imaged galaxies show evidence of unresolved central spikes.
In the following we discuss two ‘prototype’ galactic spheroids—NGC 2681 and NGC 4552 we properly monitored with HST—which host UV-bright, unresolved spikes at their center. While the early-spiral (Sa) galaxy NGC 2681 shows a nonvariable unresolved cusp, the UV spike which became visible at the center of the Virgo Elliptical NGC 4552 is a UV flare caught in mid-action, presumably related to a transient accretion event onto a central supermassive black hole (Renzini et al. 1995; Cappellari et al. 1998).
Although radically different phenomenologies are involved, the appearance of either nuclei—recently imaged in the UV (FOC/96 F342W) by means of the refurbished HST—is quite similar. Nevertheless, basic pieces of information can still be extracted from photometric profiles alone which represent a potential diagnostics to disentangle the above scenarios. For instance, the UV-bright unresolved spike observed at the center of NGC 2681 does not vary and matches a pure nuker law profile of the power law type (Cappellari et al. 1999). On the contrary, in order to model the flaring UV spike at the center of NGC 4552 one has to add to the observed galaxy profile the contribution of an unresolved central point source, whose intensity is allowed to vary (see Fig. 1).


2 Observations and Reductions
FOC UV observations of NGC 4552 obtained in 1991, 1993 and 1996 are described in detail by Cappellari et al. (1998). These data include a single FOC/96 F342W frame obtained on July 19, 1991 and subsequent images obtained on November 27-28, 1993 in four consecutive UV passbands (FOC/96 F175W, F220W, F275W, F342W). We observed NGC 4552 for a third time on May 24, 1996 with COSTAR-Corrected HST making use of a comparable set of UV filters as in 1993 (FOC/96 F175W, F275W and F342W). Initial FOC images of NGC 2681 were obtained by our group on November 4-5, 1993 in the FOC F175W, F220W, F275W, and F342W filters, pre-COSTAR. As with NGC 4552, we also obtained a set of post-COSTAR UV images on February 1, 1997 of NGC 2681 with the same FOC filter set (apart from F220W) as used in 1993. All FOC images have been re-calibrated in a self-consistent manner, including all required correction factors for PSF and sensitivity differences (zoom/non-zoomed modes and COSTAR) as well as nonlinearity effects. In addition to the FOC images obtained in 1996, we were also able to obtain FOS spectra of both galaxies. The FOS peak-up procedure was used to locate the 02 square aperture on the nucleus of each galaxy (as confirmed via the multiple peak-up output). FOS gratings G270H, G650L and G780H were used for each galaxy. The nuclear spectra of NGC 4552 and NGC 2681 were obtained on May 24, 1996 and on February 2, 1997, respectively.


3 Results
The ultraviolet-bright source in NGC 4552 was first detected in 1991, it increased in luminosity by a factor of by 1993, and then declined a factor of by 1996, On the contrary 1993 and 1997 UV FOC observations of NGC 2681 are consistent with no variation at all.
The overall nuclear FOS spectra of NGC 2681 and NGC 4552, together with the IUE and optical underlying spectra normalized to the visual region, are shown in Fig. 2. As is evident, in the case of NGC 2681 the match of the two spectra is quite striking, thus implying that the UV continuum flux of NGC 2681 is simply dominated by its stellar population, essentially identical in its innermost regions and in the whole 10′′20′′ IUE aperture. On the other hand, FOS spectroscopy of NGC 4552 reveals a strong UV continuum over the spectrum of the underlying galaxy, along with several emission lines in both the UV and the optical ranges. The SED of the spike alone—obtained by subtracting the V-mag normalized IUE spectrum of the galaxy from the FOS spectrum—indicates a temperature of K for the spike in 1996, if a thermal origin for the UV flux is assumed.
The FOS G780H spectra of NGC 2681 and NGC 4552 including the [O I], [N II], H, and [S II] emission lines are presented in Fig. 3. In NGC 2681 all lines are well fitted by a single gaussian component with FWHM of km s-1. In the case of NGC 4552 however both permitted and forbidden lines are best modelled with a combination of broad and narrow components, with FWHM of km s-1 and km s-1, respectively. The 1996 broad H luminosity of this mini-AGN is erg s-1, about a factor of two less than that of the nucleus of NGC 4395, heretofore considered to be the faintest known AGN (Filippenko et al. 1993).
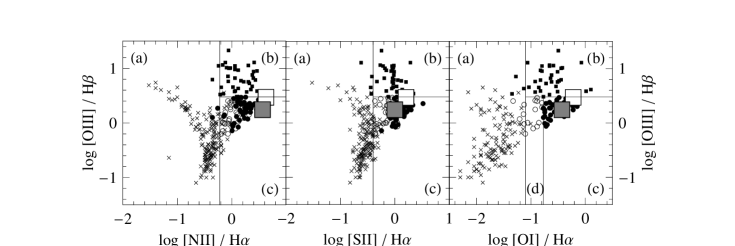
The FOS spectroscopy indicates also a significant similarity between the two nuclei, namely their emission line ratios and related gas diagnostics and UV-source classification. A comparison of the emission line ratios of the narrow components for both the NGC 4552 and NGC 2681 spikes with the distribution of Seyfert galaxies, LINERS and H II regions in the diagnostic emission line diagrams of Ho et al. (1997) is given in Fig. 4. As is evident, the line ratios definitively place both spikes among extreme AGNs. The ratios for NGC 4552 fall just on the borderline between Seyferts and LINERs, while those measured for NGC 2681 indicate that this nucleus can be classified as a LINER.
References
- Barth, A.J., Ho, L.C., Filippenko, A.V., & Sargent, W.L.W. 1998, AJ, 111, 1901
- Cappellari, M., Renzini, A., Greggio, L., di Serego Alighieri, S., Buson, L.M., Burstein, D., & Bertola, F. 1998, ApJ, in press [astro-ph/9807063]
- Cappellari, M., Bertola, F., Burstein, D., Buson, L.M., Greggio, L., Renzini, A., 1999, in preparation
- Carollo, C.M., Stiavelli, M., de Zeeuw, P. T., & Mack, J. 1997, AJ, 114, 2366
- Filippenko, A.V., Ho, L.C., & Sargent, W.L.W. 1993, ApJ, 410, L75
- Ho, L.C., Filippenko, A.V., & Sargent, W.L.W. 1997, ApJS, 112, 315
- Lauer, T.R., et al. 1995, AJ, 110, 2622
- Maoz, D., Filippenko, A.V., Ho, L.C., Macchetto, F.D., Rix, H.-W., & Schneider, D.P. 1996, ApJS, 107, 215
- Renzini, A., Greggio, L., di Serego Alighieri, S., Cappellari, M., Burstein, D., & Bertola, F. 1995, Nature, 378, 39