The Spectra of Main Sequence Stars in Galactic Globular Clusters I. CH and CN Bands in M1311affiliation: Based on observations obtained at the W.M. Keck Observatory, which is operated jointly by the California Institute of Technology and the University of California
Abstract
Spectra with a high signal-to-noise ratio of 50 stars which are just below the main sequence turnoff and are members of M13 are presented. They yield indices for the strength of the CH and the ultraviolet CN band. There is no evidence for a variation in the strength of either feature from star to star in this intermediate-metallicity galactic globular cluster, and thus no evidence for primordial variations in the abundance of C and N in M13. This supports the hypothesis that abundance variations found among the light elements in the evolved stars of M13 by Suntzeff (1981), and commonly seen on the giant and subgiant branches of globular clusters of comparable metallicity, are due primarily or entirely to mixing within a fraction of individual stars as they evolve.
1 INTRODUCTION
The galactic globular clusters contain some of the oldest stars in our galaxy. The main sequence in such a cluster consists of the unevolved member stars still in their H-burning phases. There is a long tradition of research on the much brighter globular cluster giants, for example high dispersion spectroscopy by Cohen (1983), Pilachowski (1984) and Gratton & Ortolani (1987) among others, and of photometric studies (see, for example, Frogel, Cohen & Persson 1983). These studies have contributed much to our understanding of stellar evolution and mixing processes, as well as of the structure of our Galaxy, galactic halos, and the integrated light of old stellar systems. A few pioneers have begun to press downward in luminosity with high dispersion spectroscopy reaching the horizontal branch (Clementini et al. 1996, Pilachowski et al. 1996, Cohen & McCarthy 1997), but until recently no one has tried to reach the globular cluster main sequence stars spectroscopically.
As reviewed by Kraft (1994) and by Briley, Hesser & Smith (1994) (see also the more general reviews by McWilliam 1997 and by Pinnsoneault 1997), observational studies over the past two decades have revealed that variations of a factor of more than 10 for the C, N, and O elements between globular cluster giants and sub-giants within a particular globular cluster, including M13, are common. Suntzeff (1981) conducted the first detailed survey of the strength of the CH and CN bands among M13 giants. The frequency of strong CN and weak CN stars among the red giants is approximately equal, and the contrast in band strength between the two groups is large. Weaker star-to-star variations of Na, Al, and Mg are often seen as well among the giants in the best studied clusters. These abundance variations obey specific correlations; for example, enhanced N is accompanied by depleted carbon. Pilachowski et al. (1996) examined 130 giants and sub-giants in M13 the faintest of which had MV = +1.2 mag, slightly fainter than the level of the horizontal branch. They found star-to-star variations in Na abundance of a factor of 6 and in Mg abundance of a factor of 4. Sneden et al. (1997) explore the behavior of C, N and O among the bright giants in M15, which is found to be similar to that shown by giants in M13 and M92. They find a star-to-star variation in the abundance of Eu and Ba in M15 which is a factor of 4. Similar variations among the giants are detected within all globular clusters studied in suitable detail.
Spectroscopic study of main sequence stars in galactic globular clusters is much more limited as the stars are faint, and achieving a suitable dispersion and signal-to-noise ratio is difficult. The only globular cluster whose main sequence stars have been studied in some detail is 47 Tuc. Hints of CN variations were found by Hesser (1978), and this work was continued by Hesser & Bell (1980), Bell, Hesser & Cannon (1983), Briley, Hesser & Bell (1991), Briley et al. (1994) and Briley et al. (1996). The most recent work on 47 Tuc (Cannon et al. 1998) demonstrates convincingly that variations in CN and CH are found at the level of the main sequence. Suntzeff (1989) and Suntzeff & Smith (1991) found very preliminary indications of an anti-correlation between CH and CN for a small sample of main sequence stars in NGC 6752. Molaro & Pasquini (1994) got a relatively noisy spectrum of a single main sequence turnoff star in NGC 6397 to look for lithium. Pilachowski & Armandroff (1996) summed spectra of 40 stars at the base of the giant branch in M13 in an unsuccessful search for the (weak) 7700Å OI triplet. King, Stephens & Boesgaard (1998) attempted to derive [Fe/H] from Keck spectra of several subgiants near the turnoff of M92, and got rather surprising results, [Fe/H] = 2.52, a factor of two lower than the value in common use.
It was not believed possible to produce Na and Al in globular cluster red giants, given their low masses and relatively unevolved evolutionary state, until Denisenkov & Denisenkova’s (1990) seminal paper. They suggest that instead of neutron captures on Ne22, proton captures on Ne22 could produce Na and Al enhancements. Since there is no source of free neutrons in globular cluster red giants, the former cannot occur in H-burning stars, while the latter can. (See also Langer, Hoffman & Sneden 1993.) Debate still centers on mixing versus primordial variations as the origin of the observed abundance variations. The interaction between internal rotation and mixing may be a critical one (Sweigart & Mengel 1979, Sweigart 1997), as may that between rotation and diffusion in the photosphere. Mass transfer in binary stars may also play a role under some circumstances (McClure 1984, 1997). Recently as a result of this understanding of how Na and Al could be produced in the interiors of red giants and mixed to the stellar surface via convection zones, the pendulum has swung towards favoring mixing as the explanation for most of the observed variations. The current theoretical picture is summarized in Cavallo, Sweigart & Bell (1996), Langer, Hoffman & Zaidens (1997) and in Cannon et al. (1998).
Globular cluster main sequence stars should not yet have synthesized through internal nuclear burning any elements heavier than He (and Li and Be) and hence will be essentially unpolluted by the internal nuclear burning and production of various heavy elements that occur in later stages of stellar evolution. Theory predicts that these stars are unaffected by gravitational settling and that their surfaces should be a fair representation of the gas from which the globular cluster formed. Thus the persistence of variations in C and N to such low luminosities in 47 Tuc (Cannon et al. 1998 and references therein) is surprising.
The advent of the Keck Telescope with the Low Resolution Imaging Spectrograph (henceforth LRIS, Oke et al. 1995), an efficient multi-object spectrograph coupled to a 10–m telescope, makes a high precision study of the spectra of main sequence stars in galactic globular clusters feasible. The major issue I intend to explore in this series of papers is that of star-to-star variations in abundances within a single globular cluster at and below the level of the main sequence turnoff.
2 THE SAMPLE OF STARS
M13 was chosen to begin this effort because it is nearby, hence the turnoff stars will be relatively bright, it has very low reddening, and its giants and sub-giants have been the subject of an extensive series of papers by Kraft and his collaborators. (See Pilachowski et al. 1996 for references to their earlier papers.) Its high galactic latitude guarantees minimum contamination of a sample by field stars.
Short exposure images in and were taken with LRIS centered on the field used by Fahlman & Richer (1986) in their photometric study of the main sequence of M13. Photometry was obtained with DAOPHOT (Stetson 1987) using these short exposures calibrated on the system of Landolt (1992). The zero point for each color in each field is uncertain by mag. A sample of main sequence stars was chosen based on their position on the locus of the main sequence as defined by this photometry. Each candidate was inspected for crowding and stars were chosen for the spectroscopic sample on the basis of minimum crowding. A second field was chosen 400” North of this field, somewhat closer to the center of M13, and a similar procedure was carried out. Table 1 gives the object’s coordinates (J2000), mag, color, and indices (together with their errors) for two molecular bands for the M13 main sequence stars in the spectroscopic sample.
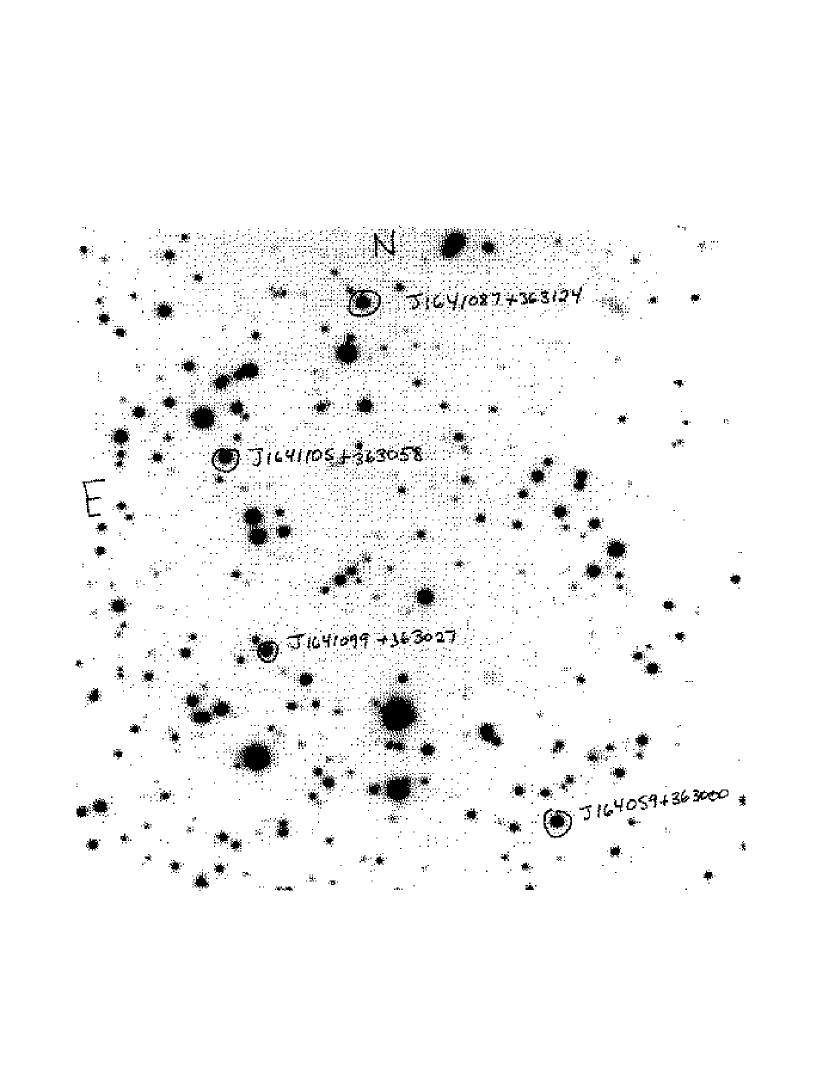
Since the fields are very crowded, in addition to providing the star coordinates, we provide an identification chart for a few stars in each of the two fields, from which, given the accurate relative coordinates, the rest of the stars can be located. Relative stellar coordinates are defined from the LRIS images themselves assuming the telescope pointing recorded in the image header is correct and taking into account the optical distortions in the images. The astrometry of Cudworth & Monet (1979) is used to fix the absolute coordinates. Star M13ms J1641019+362403 in field 1 is the star at location (141,273) in Figure 1 of Fahlman & Richer (1986). A finding chart for several stars in our sample in Field 2 is given in Figure 1 below.
Figure 2 presents a color-magnitude diagram for the main sequence stars in the M13 sample. The stars that have been observed spectroscopically are shown as filled circles. To guide the eye in establishing the iosochrone locus, stars in Field 2 that lie in the region somewhat brighter and somewhat fainter than that spanned by the sample stars are shown as open circles; for the fainter stars, every eighth star is plotted.
3 SPECTROSCOPIC OBSERVATIONS AND MEASUREMENT OF BAND INDICES
Two slitmasks, one in each field, were designed containing 50 stars from the M13 main sequence star sample. These were used at relatively low dispersion with the LRIS (300 g/mm grating, 2.46Å/pixel, 0.7 arcsec slit width) for a spectral resolution of 8Å. The CCD detector is digitized at 2 electrons/DN with a readout noise of 8 electrons. Two 800 sec exposures were taken with each slitmask under conditions of good seeing and dark sky in the spring of 1998. The data were reduced in a straightforward manner as described in Cohen et al. (1999) using Figaro (Shortridge 1988) except that the wavelength calibration came from arc lamp exposures, rather than from night sky lines on the spectra themselves. The spectra are not fluxed.
All 50 stars are members of M13 based on the metal poor appearance of their spectra and on their radial velocities.
Since these stars are metal poor, the absorption lines are in general quite weak, and rather than adhere to the usual definition of a single sided band index, we measure a CH index using continuum bandpasses on both sides of the G band at 4300Å, with a feature bandpass chosen to avoid H. Thus the blue continuum bandpass goes from 4180 to 4250Å, and the red one from 4380 to 4460 A. The feature bandpass covers the wavelengths 4285 to 4315Å. Weights of 0.6 and 0.4 are assigned to the blue and red continuum bandpasses respectively based on their offset from the wavelength of the G band. The CH index thus measured is given in Table 1. The values are the fraction of absorption from the continuum, and are not in magnitudes.
For the ultraviolet CN band with its head at 3883Å, because of crowding by the higher Balmer lines, it is impossible to find a suitable blue continuum bandpass. Thus the feature is defined in the usual way by a red continuum bandpass at 3894 to 3910Å, with the feature bandpass including 3860 to 3888Å. Again the index feature strengths as a fraction of absorption from the continuum are given in Table 1. A minimum continuum strength (700 DN/pixel) was established for an accurate measurement of the uvCN index; 44 of the 50 stars in the sample met this requirement, and no uvCN index is listed for the six stars whose spectra did not achieve the necessary continuum level. These are among the faintest stars, but not the six faintest, as slitmask alignment also plays a role here, particularly for such narrow slits.
Errors (1) for the molecular band indices were calculated based on Poisson statistics from the observed count rates in the continuum and in the feature bandpasses. These are listed for each star in Table 1. The values given in Table 1 thus do not include the effect of cosmic rays nor the effect of the background signal from the night sky, both of which are small.
Even if a mean continuum were applied to normalize the spectra, the observed dispersions within the defined continuum bandpasses cannot themselves be used due to the probable presence of many weak absorption features in the spectra. Errors calculated in this way (without normalizing the continuum) are typically twice those calculated from the Poisson statistics, and provide a firm upper limit on the uncertainties of the measured molecular band indices.
To illustrate the quality of the spectra, Figure 3 shows the spectrum of the brightest star at in our sample of main sequence stars in M13 (M13ms J1641079+362413) and of the faintest star for which both a CH index and a uvCN index were measured (M13ms J1641085+362317). The thin line is the spectrum of the fainter star multiplied by a factor of 3.1 in the region around the CH band to facilitate comparison with the spectrum of the brightest star.
4 ANALYSIS
The color-magnitude diagram for our sample of main sequence stars in M13 displayed in Figure 2 illustrates a very important point. The total range in color of the sample members is very small, mag. The locus of the main sequence is very tight in color at a fixed luminosity. The total range in magnitude is less than 1.5 mag. We therefore ignore all subtleties, all model atmosphere and line synthesis calculations, all calculations of molecular equilibria, all variations in and surface gravity, and instead proceed in a very simple manner.
We rank the stars according to the position along the main sequence, a ranking which is almost identical to that in magnitude, with the star highest up the isochrone as first, and the star lowest on the main sequence as having “star order” = 50.
Figures 4 and 5 show the results for the 50 M13 main sequence stars. (Only 44 stars are plotted in Figure 5 due to the minimum continuum level requirement imposed for measuring a uvCN index.) The 1 errors for each star are plotted as well. A linear fit was derived for the uvCN index, and the 1 rms dispersion around that fit is 0.023 (2.3% of the continuum), while the Poisson errors calculated from the measurements range from 0.008 to 0.017. For the CH index, a quadratic fit was made, as shown in Figure 5. The 1 rms dispersion around that fit is 0.010, while the calculated uncertainties for the faintest stars are .
It seems reasonable to assume that the rise in the strength of the CH band index seen in Figure 5 for the most luminous stars in this sample is due to their slightly redder color, hence slightly cooler as one begins to turn off the main sequence (see Figure 2) enhancing the strength of the CH band. Because the CN index is defined as a single sideband index with the continuum to the red of the feature, the measured index is affected by the continuum slope as well as by the feature strength. The contribution from the continuum itself to is on average 0.09. There is also some contribution to from the Balmer line H8 at 3889Å, which in such metal poor stars may be a substantial fraction of the total absorption within the bandpass of the uv CN feature.
5 DISCUSSION
Our data provide no evidence for variations of CH or CN band strengths among the 50 main sequence stars in our sample in M13. The errors are small compared to the size of the measured indices. Our analysis is extremely simple and does not depend in any way on model atmospheres or spectral synthesis. The CH bands are quite weak, and hence one might argue that they hide a variation in band strength from star-to-star which goes from to a maximum of , while still having a range of more than a factor of two. But a careful examination of figure 5 makes this difficult to envision, as only one star has a feature strength below 1% (M13ms J1641072+362756, with ), and the errors are quite small for the entire sample. The mean absorption in the uvCN band is much larger, so such an argument cannot be applied to . The uvCN band indices in Figure 4 demonstrate quite convincingly that in M13 there are no star-to-star variations in the strength of this molecular band. But here the issue of the contribution of H8 to this index in such metal poor stars cannot be ignored. A full spectral synthesis is required to establish the maximum size of the variations that can be hidden within the constraints of our data. This is deferred to a future paper in this series.
It is not clear how our results can be reconciled with the observations in 47 Tuc of Cannon et al. (1998) and references therein, where substantial band strength variations were seen for main sequence stars. Our sample in M13 is larger and our spectra are of higher signal-to-noise ratio, but M13 is somewhat farther away, the main sequence stars are somewhat fainter than those in 47 Tuc, and the abundance of the cluster is lower. The issue of membership for our sample of 50 main sequence stars is clear; all are cluster members.
Similar data from the LRIS at the Keck Observatory for an even larger sample of main sequence stars in M71 are now in hand and the analysis and results of that sample should prove illuminating in trying to understand the origin of this discrepancy.
6 SUMMARY
I have determined the strength of the CH and CN bands from spectra of 50 main sequence stars in M13. The data would seem to suggest that large variations of C and N are not seen at the level of the main sequence and below it, but the reader is cautioned that a firm conclusion must await a detailed analysis of C and N abundances which will appear in a later paper (Briley & Cohen 1999). Significant primoridal variations of C and N do not appear to be present in M13. This supports the hypothesis that abundance variations found among the light elements in the evolved stars of M13 by Sneden (1981), and commonly seen on the giant and subgiant branches of globular clusters of comparable metallicity, are due primarily or entirely to mixing within a fraction of individual stars as they evolve.
Acknowledgements.
The entire Keck/LRIS user community owes a huge debt to Jerry Nelson, Gerry Smith, Bev Oke, and many other people who have worked to make the Keck Telescope and LRIS a reality and to operate and maintain the Keck Observatory. We are grateful to the W. M. Keck Foundation, and particularly its late president, Howard Keck, for the vision to fund the construction of the W. M. Keck Observatory. I also thank Jim Hesser for a guide to the literature on 47 Tuc, Kevin Richberg for help with the data reduction and Patrick Shopbell for help at the telescope.References
- (1)
- (2) Bell, J.E., Hesser, J.E. & Cannon, R.D., 1983, ApJ, 269, 580
- (3)
- (4) Briley, M.M., Hesser, J.E., Bell, R.A., Bolte, M. & Smith, G.H., AJ, 108, 2183
- (5)
- (6) Briley, M.M., Hesser, J.E. & Smith, G.H., 1994, Can. Jrl. Physics, 72, 772
- (7)
- (8) Briley, M.M., Hesser, J.E. & Bell, R.A., 1991, ApJ, 373, 482
- (9)
- (10) Briley, M.M., Smith, V.V., Suntzeff, N.Z., Lambert, D.L., Bell, R.A. & Hesser, J.E., 1996, Nature, 383, 604
- (11)
- (12) Cannon, R.D., Croke, B.F.W., Bell, R.A., Hesser, J.E. & Stathakis, R.A., 1998, MNRAS, 298, 601
- (13)
- (14) Cavallo, R.M., Sweigart, A.V. & Bell, R.A., 1996, ApJ, 464, L79
- (15)
- (16) Clementini, G., Merighi, R., Gratton, R. & Carretta, E., 1994, MNRAS, 267, 43
- (17)
- (18) Cohen, J. G., 1983, ApJ, 270, 654
- (19)
- (20) Cohen, J. G., 1999, manuscript in preparation
- (21)
- (22) Cohen, J. G. & McCarthy, J.K., 1997, AJ, 113, 1353
- (23)
- (24) Cohen, J. G., Hogg, D. W., Pahre, M. A., Blandford, R., Shopbell, P. L. & Richberg, K., 1999, ApJS, in press, Astro-ph/9809066
- (25)
- (26) Cudworth, K.M. & Monet, D.G., 1979, AJ, 84, 774
- (27)
- (28) Denisenkov, P.A. & Denisenkova, S.N., 1990, Soviet Astron. Letters, 16, 275
- (29)
- (30) Fahlman, G. & Richer, H., 1986, ApJ, 304, 273
- (31)
- (32) Frogel, J.A., Cohen, J.G. & Persson, S.E., 1983, ApJ, 275, 773
- (33)
- (34) Gratton, R.G. & Ortolani, S., 1989, A& A, 211, 41
- (35)
- (36) Hesser, J.E., 1978, ApJ, 223, L117
- (37)
- (38) Hesser, J.E. & Bell, R.A., 1980, ApJ, 238, L149
- (39)
- (40) King, J.R., Stephens, A. & Boesgaard, A.M., 1998, AJ, 115, 666
- (41)
- (42) Kraft, R.P. 1994, PASP, 106, 553
- (43)
- (44) Langer, G.E., Hoffman, R. & Sneden, C., 1993, PASP, 105, 301
- (45)
- (46) Langer, G.E., Hoffman, R. & Zaidins, C.S., 1997, PASP, 109, 244
- (47)
- (48) Landolt, A.U., 1992, AJ, 104, 340
- (49)
- (50) McClure, R.D., 1984, PASP, 96, 117
- (51)
- (52) McClure, R.D., 1997, PASP, 109, 536
- (53)
- (54) McWilliam, A., 1997, Ann.Revs.Astr.& Astrophys., 35, 503
- (55)
- (56) Molaro, P. & Pasquini, L., 1994, A & A, bf 281, L77
- (57)
- (58) Oke, J. B., Cohen, J. G., Carr, M., Cromer, J., Dingizian, A., Harris, F. H., Labrecque, S., Lucinio, R., Schaal, W., Epps, H., & Miller, J. 1995, PASP, 107, 307
- (59)
- (60) Pilachowski, C.A., 1984, ApJ, 281, 614
- (61)
- (62) Pilachowski, C.A. & Armandroff, T.E., 1996, AJ, 111, 1175
- (63)
- (64) Pilachowski, C.A., Sneden, C., Kraft, R.P. & Langer, G.E., 1996, AJ, 112, 545
- (65)
- (66) Pinnsoneault, M., 1997, Ann.Revs.Astr.& Astrophys., 35, 557
- (67)
- (68) Sneden, C., Kraft, R.P., Shetrone, M.D., Smith, G.H., Langer, G.E. & Prosser, C.F., 1997, AJ, 114, 1964
- (69)
- (70) Shortridge, K. 1988, “The Figaro Manual Version 2.4”
- (71)
- (72) Stetson, P.B., 1987, PASP, 99, 191
- (73)
- (74) Suntzeff, N.B., 1981, ApJS, 47, 1
- (75)
- (76) Suntzeff, N.B. & Smith, V.V., 1991, ApJ, 381, 160
- (77)
- (78) Suntzeff, N.B., 1989, in The Abundance Spread Within Globular Clusters, ed. M. Cayrel de Strobel, M.Spite & T.Lloyd-Evans, Paris Observatory
- (79)
- (80) Sweigart, A.V. & Mengel, J.G., 1979, ApJ, 229, 624.
- (81)
- (82) Sweigart, A.V., 1997, ApJ, 474, L23
- (83)
| ID | (uvCN) | (CH) | ||||
|---|---|---|---|---|---|---|
| (mag) | (mag) | (%) | (%) | (%) | (%) | |
| M13ms J1641010+362529 | 18.69 | 0.77 | … | … | 0.047 | 0.003 |
| M13ms J1641030+362529 | 18.20 | 0.73 | 0.202 | 0.011 | 0.021 | 0.002 |
| M13ms J1641064+362508 | 17.84 | 0.85 | 0.228 | 0.011 | 0.018 | 0.002 |
| M13ms J1641050+362454 | 18.50 | 0.74 | 0.181 | 0.010 | 0.026 | 0.002 |
| M13ms J1641942+362438 | 18.54 | 0.74 | 0.221 | 0.012 | 0.028 | 0.002 |
| M13ms J1641071+362431 | 18.47 | 0.75 | 0.229 | 0.011 | 0.029 | 0.002 |
| M13ms J1641019+362403 | 18.67 | 0.76 | … | … | 0.037 | 0.003 |
| M13ms J1641079+362413 | 17.40 | 0.90 | 0.198 | 0.008 | 0.041 | 0.003 |
| M13ms J1641065+362340 | 18.47 | 0.75 | … | … | 0.027 | 0.002 |
| M13ms J1641058+362332 | 17.82 | 0.85 | 0.216 | 0.010 | 0.028 | 0.002 |
| M13ms J1641080+362324 | 18.30 | 0.74 | 0.226 | 0.012 | 0.032 | 0.002 |
| M13ms J1641085+362317 | 18.67 | 0.74 | 0.243 | 0.013 | 0.022 | 0.002 |
| M13ms J1641070+362251 | 17.95 | 0.74 | 0.227 | 0.012 | 0.030 | 0.001 |
| M13ms J1641068+362224 | 17.48 | 0.88 | 0.203 | 0.009 | 0.070 | 0.003 |
| M13ms J1641076+362151 | 18.06 | 0.73 | 0.241 | 0.012 | 0.033 | 0.002 |
| M13ms J1641099+362158 | 17.88 | 0.75 | 0.235 | 0.013 | 0.032 | 0.002 |
| M13ms J1641022+362121 | 17.85 | 0.75 | 0.215 | 0.010 | 0.040 | 0.003 |
| M13ms J1641076+362138 | 18.76 | 0.78 | 0.205 | 0.014 | 0.049 | 0.002 |
| M13ms J1641031+362028 | 17.81 | 0.86 | 0.226 | 0.009 | 0.030 | 0.002 |
| M13ms J1641012+362017 | 17.60 | 0.82 | 0.182 | 0.009 | 0.051 | 0.002 |
| M13ms J1641023+361953 | 18.77 | 0.79 | … | … | 0.047 | 0.003 |
| M13ms J1641001+361937 | 18.30 | 0.78 | 0.228 | 0.009 | 0.043 | 0.002 |
| M13ms J1641055+361909 | 18.50 | 0.73 | 0.228 | 0.010 | 0.018 | 0.002 |
| M13ms J1641120+361926 | 18.59 | 0.74 | 0.224 | 0.010 | 0.029 | 0.002 |
| M13ms J1641044+361836 | 17.57 | 0.85 | 0.167 | 0.005 | 0.065 | 0.003 |
| M13ms J1641129+363226 | 18.15 | 0.73 | 0.248 | 0.013 | 0.032 | 0.003 |
| M13ms J1641043+363218 | 18.19 | 0.73 | 0.245 | 0.010 | 0.025 | 0.002 |
| M13ms J1641107+363152 | 18.18 | 0.71 | 0.242 | 0.013 | 0.024 | 0.002 |
| M13ms J1641087+363124 | 18.06 | 0.73 | 0.231 | 0.017 | 0.038 | 0.002 |
| M13ms J1641101+363112 | 17.67 | 0.83 | 0.193 | 0.013 | 0.052 | 0.003 |
| M13ms J1641105+363058 | 17.75 | 0.82 | 0.209 | 0.016 | 0.056 | 0.004 |
| M13ms J1641059+363050 | 18.17 | 0.73 | 0.265 | 0.013 | 0.033 | 0.002 |
| M13ms J1641055+363041 | 17.95 | 0.75 | 0.256 | 0.010 | 0.040 | 0.002 |
| M13ms J1641099+363027 | 18.19 | 0.72 | 0.230 | 0.017 | 0.040 | 0.003 |
| M13ms J1641077+363011 | 18.22 | 0.76 | … | … | 0.034 | 0.002 |
| M13ms J1641059+363000 | 17.68 | 0.84 | 0.198 | 0.013 | 0.073 | 0.004 |
| M13ms J1641084+362943 | 17.71 | 0.83 | 0.217 | 0.011 | 0.039 | 0.003 |
| M13ms J1641110+362905 | 17.62 | 0.85 | 0.217 | 0.013 | 0.052 | 0.004 |
| M13ms J1641018+362821 | 17.75 | 0.80 | 0.222 | 0.012 | 0.057 | 0.003 |
| M13ms J1641072+362756 | 18.23 | 0.73 | 0.278 | 0.013 | 0.008 | 0.004 |
| M13ms J1641078+362746 | 18.00 | 0.74 | 0.248 | 0.009 | 0.034 | 0.002 |
| M13ms J1641063+362732 | 18.25 | 0.72 | 0.228 | 0.015 | 0.031 | 0.002 |
| M13ms J1641056+362724 | 18.19 | 0.76 | 0.299 | 0.014 | 0.026 | 0.002 |
| M13ms J1641028+362705 | 17.77 | 0.80 | 0.192 | 0.008 | 0.058 | 0.003 |
| M13ms J1641079+362645 | 18.15 | 0.72 | 0.243 | 0.010 | 0.020 | 0.002 |
| M13ms J1641077+362628 | 17.90 | 0.76 | 0.216 | 0.013 | 0.027 | 0.003 |
| M13ms J1641068+362545 | 18.07 | 0.73 | 0.227 | 0.010 | 0.031 | 0.003 |
| M13ms J1641148+362833 | 17.64 | 0.84 | 0.194 | 0.018 | 0.058 | 0.003 |
| M13ms J1640581+362618 | 17.76 | 0.80 | … | … | 0.066 | 0.003 |
| M13ms J1641120+363137 | 18.09 | 0.72 | 0.243 | 0.012 | 0.012 | 0.002 |