Optical and X-ray Variability in The Least Luminous AGN, NGC 4395
Abstract
We report the detection of optical and X-ray variability in the least luminous known Seyfert galaxy, NGC 4395. Between July 1996 and January 1997 the featureless continuum changed by a factor of 2, which is typical of more luminous AGN. The largest variation was seen at shorter wavelengths, so that the spectrum becomes ‘harder’ during higher activity states. During the same period the broad emission-line flux changed by per cent. In a one week optical broad band monitoring program, a 20 per cent change was seen between successive nights. The difference in flux observed between the spectroscopy of July 1996 and the broad-band observations implies variation by a factor of 3 at 4400 Å in just one month. In the same period, the spectral shape changed from a power law with spectral index (characteristic of quasars) to a spectral index (as observed in other dwarf AGN). ROSAT HRI and PSPC archive data show a variable X-ray source coincident with the galactic nucleus. A change in X-ray flux by a factor in 15 days has been observed. When compared with more luminous AGN, NGC 4395 appears to be very X-ray quiet. The hardness ratio obtained from the PSPC data suggests that the spectrum could be absorbed. We also report the discovery of weak CaIIK absorption, suggesting the presence of a young stellar cluster providing of the order of 10% of the blue light. The stellar cluster may be directly observed as a diffuse component in HST optical imaging. Using HST UV archive data, together with the optical and X-ray observations, we examine the spectral energy distribution for NGC 4395 and discuss the physical conditions implied by the nuclear activity under the standard AGN model. When in the low state, the extrapolated UV continuum is insufficient to explain the observed broad emission-lines. This could be explained by intrinsic variability or absorption or may imply an extra heating source for the BLR. The observations can be explained by either an accreting massive black hole emitting at about or by a single old compact SNR with an age of 50 to 500 years generated by a small nuclear starburst.
keywords:
galaxies: individual: NGC 4395 – galaxies: nuclei – Seyfert1 Introduction
| Date | Telescope | Mode | Archive Data |
|---|---|---|---|
| 7 April 1988 | Hale | Spectroscopy | No† |
| 2 July 1992 | ROSAT PSPC | Imaging | Yes |
| 15 & 19 July 1992 | HST FOS | Spectroscopy | Yes |
| 17 July 1992 | ROSAT PSPC | Imaging | Yes |
| 5 December 1995 | HST WFPC2 | Imaging | Yes |
| 5 – 16 June 1996 | JKT | Imaging | No |
| 23 June 1996 | ROSAT HRI | Imaging | No |
| 13 July 1996 | WHT | Spectroscopy | No |
| 15 January 1997 | WHT | Spectroscopy | No |
| † Data provided by Filippenko et al. See Filippenko & Sargent 1989. | |||
The dwarf Seyfert nucleus in NGC 4395 was first reported by Filippenko & Sargent (1989) almost a decade ago. Optical spectroscopy showed high ionization narrow lines as well as broad permitted emission-lines. The detection of a compact radio source (Sramek 1992) added support to the idea that NGC 4395 is a feeble version of the more luminous Seyfert galaxies. Its low luminosity nucleus has a blue absolute magnitude , a luminosity times fainter than a classical Seyfert galaxy like NGC 4151. The detection of a featureless UV continuum gave support to the idea that NGC 4395 was a real example of dwarf nuclear activity (Filippenko, Ho & Sargent 1993). However, Shields & Filippenko (1992), after several years of spectroscopic monitoring, reported that no evidence was found for continuum or line variability. Since variability is one of the most common characteristics of AGN, this result was quite surprising.
NGC 4395 is a nearly face-on dwarf galaxy (, , assuming a distance of 5.21 Mpc - see below) with morphological classification Sd III-IV in the extended Hubble system, as defined by Sandage & Tammann in the RSA catalogue (Sandage & Tammann 1981). It exhibits a star-like nucleus and an extremely low surface-brightness disk. The loose and disconnected spiral arms show some blue knots of star formation activity (for a colour plate see Wray 1988).
We will use a distance to NGC 4395 of 5.21 Mpc, based on the observed recession velocity and a Virgo flow model with an infall velocity of 220 km s-1 for the Galaxy (Kraan-Korteweg 1986). This value agrees well with the distance modulus of 28.5 reported by Sandage & Bedke (1994) and gives a scale of 25 parsecs per arcsec on the sky.
As part of a multiwavelength imaging and spectroscopy project to study a volume-limited sample of very nearby galaxies we have acquired ROSAT HRI data and optical spectroscopy for NGC 4395. and images of the galaxy were obtained as part of an AGN monitoring program. Finally, HST and ROSAT PSPC data for NGC 4395 were retrieved from public archives. In this paper we report the detection of optical and X-ray variability in the nucleus of NGC 4395. In Section 2 we present the observations and reduction of the X-ray imaging, optical spectroscopy, and broad-band optical data. Results are given in section 3. A discussion is presented in Section 4, and the conclusions are summarized in Section 5.
2 Observations and Data Reduction
A journal with the data used in this paper can be found in table 1. It includes ground based and HST imaging and spectroscopy,, and ROSAT data. This section will describe the observations and reduction of data which do not come from public archives.
2.1 HRI data
An X-ray image of NGC 4395 was obtained with the High Resolution Imager (HRI) on board ROSAT on the 23rd of June 1996 as part of the AO7 cycle of pointed observations. The total exposure time was 11,253 secs.
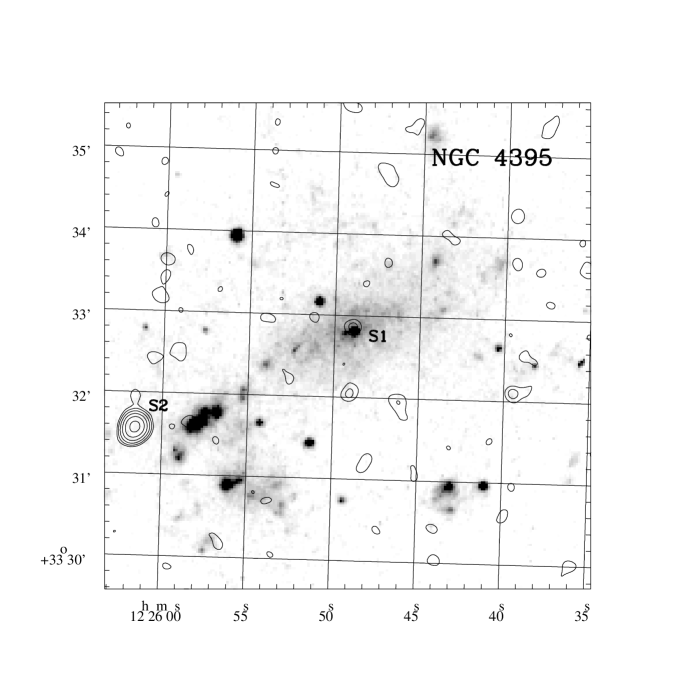
Figure 1 shows a contour map of the central part of the X-ray frame overlaid on the Digital Sky Survey data for NGC 4395. The pixels of the HRI frame were binned to arcsec2 and the image was convolved with a Gaussian of 4 arcsec. In this way the noise in the image is artificially suppressed and can be used to draw the contour levels. Contours in figure 1 were drawn at 3, 6, 12, 24, 48 and 96 times the standard deviation in the smoothed background (count rates, fluxes and related errors elsewhere in this paper are determined from the raw data). The most prominent source in the figure (S2) has no obvious optical identification although the DSS image shows some diffuse emission in the area. We have identified the possible source S1 as the tentative X-ray nuclear emission of NGC 4395. The slight shift between the optical nucleus and the X-ray emission ( arcsec) is consistent with the accuracy of the ROSAT pointing. Indeed, another X-ray source approximately 7 arcmin to the west of S1 and with a clear optical identification shows the same shift.
The count rate for the nucleus was calculated by summing over all the counts within a circle centered on the source. To estimate the background two circles of radius 160 arcsec free of evident X-ray sources and away from the galaxy were used. To find the optimum radius for the aperture radial profiles of several point sources were examined. A final aperture of 10 arcsec was adopted which should encircle 99 per cent of the photons at 0.2 keV and 86 per cent of the photons at 1.7 keV (David et al. 1997). The net count for S1 was 7.6 4.6 photons, i.e., it is not a significant detection. For S2 we find a net count of 169.2 14.3 photons. The count rates are and photons s-1 for S1 and S2 respectively.
2.2 PSPC data
Two sets of PSPC data were retrieved from the ROSAT archive. One of these data sets is presumably that referred to as a private communication from Snowden & Belloni in Filippenko, Ho & Sargent (1993). The first set was obtained on the 2nd of July 1992 with 7,755 seconds of exposure time, while the second set was obtained 15 days later with 8,764 seconds exposure. Comparing both data sets it is easy to identify a variable X-ray source which is consistent with the position of the nuclear source for NGC 4395 marginally detected from our HRI image.
For total count extraction of a PSPC point source, an aperture of 2 arcmin should be adequate. Reducing the aperture to 1 arcmin loses 15-20 per cent of the counts at the soft end of the spectrum (E 0.1 keV) because of the wider PSF at lower energies (Hasinger et al. 1992). However, apertures larger than 30 arcsec around the NGC 4395 nuclear source would include other knots of X-ray emission, as can be seen in our HRI image. To estimate the flux due to these extra-nuclear sources, we measured the net counts in the HRI image using an annuli centered on the nuclear source with an inner radius of 10 arcsec and an outer radius of 1′. We find 23.5 14.7 counts in the annuli, so we expect some contamination within the 1 arcmin aperture, but it should not be significant.
For a 1 arcmin aperture centered at the position of the NGC 4395 nucleus, the net counts were photons and photons for the first and second PSPC data sets, respectively. For the background estimation we used a large circle of radius 600 arcsec far away from any contamination by other X-ray sources. The associated count rates are photons s-1 on the 2nd of July 1992, and photons s-1 15 days later, giving a variability of about a factor of two.
2.3 Optical spectroscopy

Long slit spectra of the nucleus of NGC 4395 were obtained on the 13th of July 1996 and the 15th of January 1997 at the Cassegrain focus of the 4.2 m William Herschel Telescope at the Roque de los Muchachos Observatory. The R316R grating was installed in the red arm of the ISIS double spectrograph and the R300B was used in the blue arm, together with dichroic 5400 (half power point of crossover at 5470 Å). The wavelength coverage was 3650 - 6750 Å. A small gap between 5220 and 5270 Å was not observed during January 1997. A TEK CCD and a Loral CCD were used during July 1996 for the red and the blue camera, respectively. Both cameras were equipped with TEK CCDs for the run in January 1997. The slit width was 1 arcsec on the sky, resulting in a spectral resolution of 3.0 Å FWHM for the red arm and 3.5 Å FWHM for the blue arm ( 3.8 Å FWHM with the Loral chip). The seeing varied between and arcsecs during both runs. The dispersion achieved in the red arm was 1.47 Å per pixel (0.061 Å per micron). In the blue arm the dispersion was 0.96 Å per pixel with the Loral and 1.54 Å per pixel with the Tek detector (0.065 and 0.064 Å per micron, respectively). In both runs the slit was positioned at the parallactic angle to minimize light losses. The CCDs were windowed to cover 4 arcmin in the spatial direction with a scale of 0.36 arcsec per pixel for the red arm and 0.20 arcsec per pixel for the blue arm. In July 1996 conditions were photometric during the whole night, although the presence of Saharan dust in the atmosphere hampered some of the observations. The conditions during January 1997 were not photometric throughout the night, but the data for NGC 4395 and associated standard stars were acquired during clear periods of the night.
| Blue Arm | Red Arm | ||||||||||
| Date | [OII] | [NeIII] | [OIII] | [OIII] | [OI] | [OI] | [NII] | [NII] | [SII] | [SII] | |
| 3727 | 3869 | 4959 | 5007 | 6300 | 6363 | 6548 | 6583 | 6716 | 6731 | ||
| April 1988 † | – | – | 64.41 | – | 23.02 | 7.59 | – | – | 19.77 | 22.97 | |
| July 1996 | 36.83 | 19.19 | 66.84 | 207.60 | 19.60 | 6.52 | 4.29 | 12.86 | 13.00 | 16.57 | |
| January 1997 | 36.34 | 21.55 | 69.72 | 227.82 | 24.69 | 7.77 | 4.80 | 14.40 | 16.34 | 19.81 | |
| Fluxes in units of 10-15 ergs s-1 cm-2 | |||||||||||
| : Line fluxes from the spectrum acquired by Filippenko et al. | |||||||||||
| Date | H | FWHM | H | FWHM | H | FWHM | H | FWHM1 | FWHM2 | ||||
|---|---|---|---|---|---|---|---|---|---|---|---|---|---|
| April 1988 † | 28.58 | 4.0 | 17.43 | 21.3 | – | – | – | – | – | ||||
| July 1996 | 21.80 | 4.0 | 14.29 | 22.4 | 55.20 | 3.5 | 82.90 | 10.0 | 36.4 | ||||
| January 1997 | 24.20 | 4.0 | 18.49 | 20.4 | 59.85 | 3.6 | 120.86 | 9.7 | 33.9 | ||||
| Fluxes in units of 10-15 ergs s-1 cm-2 | |||||||||||||
| : Line fluxes from the spectrum acquired by Filippenko and co. | |||||||||||||

The data were reduced using iraf software. Bias correction and flat-fielding of the 2D frames were performed in the usual way. Spectra of the nucleus were extracted using an effective aperture of arcsec2. For wavelength calibration a fifth order Legendre polynomial was fitted to the strongest non-blended emission-lines of copper-neon and copper-argon lamps. The frames were flux calibrated using the spectrophotometric standards BD+28 4211 and PG1708+602 in July 1996, and Feige 34 and G191-B2B in January 1997, and using the mean extinction curve for the Observatory (). The extinction correction is air-mass dependent and can be expressed as (in magnitudes), where is the air-mass during the observations. For the 13th of July 1996 a grey shift correction of 0.13 magnitudes¡ (as measured on site by the Carlsberg Meridian Circle) was applied to the mean extinction curve to account for the dust extinction. This is possible because the wind-blown Saharan dust in the atmosphere above the Canary Islands is grey to an accuracy 5 per cent between 0.32 and 1.0 microns (Stickland et al. 1987; Whittet, Bode & Murdin 1987). For January 1997 the flux calibration was done using the standard extinction curve with no other corrections. As the standard stars were observed with a wider slit (8 arcsecs), an empirical aperture correction was applied to the NGC 4395 spectra. The correction was calculated by comparing the standard star spectra used in the flux calibration with spectra of the same stars obtained by software which simulated a narrow slit. A slight variation with wavelength was found and the NGC 4395 spectra were scaled by a factor of at the blue end ( Å) and by a factor of at the red end ( Å). The resulting spectra are shown in figure 2. The blue continuum from the July 1996 spectrum has been smoothed slightly so that its overall shape is easier to follow.
The interstellar Galactic absorption towards NGC 4395 is just mag (Burstein & Heiles 1984), and no correction to account for this extinction was used in the reduction of the spectra. The signal to noise per pixel achieved during July 1996 was 16 for the red arm and 8 per for the blue arm. For January 1997 the signal to noise per pixel was 42 and 35 for the red and blue arm respectively.
HST Planetary Camera observations of the NGC 4395 taken in the narrow band F502N filter show that the [OIII] 5007 emission region has a diameter of 0.4 arcsec (Filippenko, Ho & Sargent 1993). In contrast, the FWHM for the spatial profile of an unresolved star in our data is 1 arcsec. Inspection of the profile of the emission-lines in our spectra shows that the Narrow Line Region (NLR) is, as expected, spatially unresolved and no aperture effects have to be taken into account when comparing narrow line fluxes from our two spectra.
Measurements of the narrow line fluxes in July 1996 and January 1997 agree to within 25 per cent at worst (see table 2). Since we have used a 1 arcsec slit, the accuracy of the absolute calibration is expected to be of the order of 30 per cent. Comparison of the narrow line fluxes measured from our data with the values measured from data obtained in 1988, and kindly provided by Filippenko and collaborators, have also been included in table 2 and 3. The spectra were examined using the same software packages used in the reduction of our data. The line fluxes agree to within 30 per cent, except for [SII] 6716, where the difference is slightly bigger.
The blue spectrum obtained during the July 1996 observation shows a depression just after the [OIII] 5007 emission-line. This is due to a cosmetic defect in the CCD which produces a dark tail after bright pixels, as can be seen in figure 3. The problem is only apparent whenever pixels have 2000 counts in the raw frame. The depth of the depression seems to be correlated with the peak count. The data shown in figure 3 were produced with the largest cosmic ray available in the image (49447 peak counts) and the depression extends over up to 300 pixels ( 270 Å). Peak counts for the NGC 4395 emission-lines are larger than 2000 counts only for the [OIII] lines, making any depressions negligible for wavelengths shorter than 5200 Å. Unfortunately, fluxes for H could be slightly affected.
2.4 Ground-based broad-band observations
As part of an AGN monitoring program, NGC 4395 was observed on 5th–11th of June 1996 with the Jacobus Kapteyn Telescope (JKT). Observations of NGC 4395 were obtained over a period of a few hours at the start of each night using the JKT CCD camera, using and band filters. An integration time of 5 minutes was used for each exposure. The atmospheric conditions were judged to be good and very stable over the entire week. This was confirmed by inspection of the extinction data recorded independently by the Carlsberg automatic Meridian Circle, which showed the average V-band extinction at the zenith was constant to over the observing run.
The CCD data were reduced in a standard way using the iraf packages. Although photometric standard stars were observed during the monitoring campaign, we restricted our variability analysis to photometry of the nucleus of NGC 4395 relative to several stars within the same CCD frames. This procedure is better suited to searching for rapid, small-amplitude variability for which atmospheric changes can significantly affect the results (e.g., Done et al. 1990). Within each CCD frame several nearby stars of similar magnitude to the AGN nucleus were identified, and their counts calculated using a circular photometric aperture 6 arcsec in radius. A large aperture was used to ensure all the point-source light was enclosed allowing for possible small variations in seeing. For each star the sky background was removed by subtracting a scaled average of the counts in an annulus of inner and outer radius 9 and 11 arcseconds respectively centered on the photometric aperture. A similar procedure was used for the AGN, except the annulus lay on top of the galaxy thereby permitting a first-order correction for the galaxy-light within the photometric aperture. No other attempt was made to correct for galaxy contamination. We note, however, that the central region of the galaxy of NGC 4395 is quite faint even relative to the low-luminosity nucleus: the surface brightness of the galaxy in the nucleus vicinity is mag arcsec-2. The light distribution is also flat in the spatial direction (i.e., no strong central bulge appears present). Hence the adopted galaxy-subtraction procedure appears quite adequate for obtaining a good measurement of the intrinsic, nuclear-variability amplitude.
2.5 HST WFPC2 observations
NGC 4395 was observed with the WFPC2 on board HST in the F450W () and F814W () band filters on the 5th of December 1995 as part of the GTO proposal 6232. These data were retrieved from the HST data archive and analysed using iraf. Results from previous analysis of these observations can be found in Matthews et al. (1996;1998). The nucleus of NGC 4395 was imaged on the PC chip which has a pixel size of 0.046 arcsec. Three exposures of NGC 4395 were taken in each filter. The F450W exposure times were 160s and 2400s and the F814W exposure times were 160s and 2300s. We have only used the short exposure observations here as the nucleus was saturated in the long exposures.
3 Results
3.1 X-ray imaging and spectral analysis
The conversion to fluxes of the HRI and PSPC count rates for the NGC 4395 nuclear source were done assuming a power law spectrum () with energy index and 1.5, and using the energy range 0.1 – 2.4 keV. Adopting a Galactic hydrogen column density of cm-2 (Stark et al. 1992) the HRI count rate gives a flux ergs s-1 cm-2, as can be seen in table 4. For a distance of 5.21 Mpc this implies an X-ray nuclear luminosity for NGC 4395 of ergs s-1.
Since at least 100 counts are required to perform spectral analysis of PSPC observations, it was not possible to fit the data using the 34 energy channels of the detector. Instead, the total counts (0.1–2.4 keV) for each data set were binned into a single channel to estimate the fluxes. A power law spectrum with and 1.5, and a hydrogen column density of cm-2 were assumed. The results are shown in table 4.
In section 3.2 we discuss the possibility of a young stellar cluster in the nucleus of NGC 4395. If this is present it could be the dominant source of very soft X-rays. During the high state the count rate in the soft 0.1-0.4 keV band was photons s-1, contributing about 30 percent of the total flux ( photons s-1). During the low state the soft count rate drops proportionately, continuing to provide about 30 percent of the total flux. The source is therefore variable, implying that the soft flux is probably dominated by nuclear emission.
In order to obtain spectral information from the PSPC data, we have used the hardness ratio (HR) technique, which gives an ‘X-ray colour’ for objects with few net counts (Hasinger 1992; Ciliegi et al. 1997). By definition HR = (H-S)/(H+S), where S is the number of net counts within the channels 11-42 ( keV), and H is the number of counts in the channels 51-201 ( keV). Values of HR close to -1 indicate that the source has an extremely soft spectrum, while values close to +1 show that the source has a hard or heavily absorbed spectrum. For NGC 4395 HR = 0.37 0.11, where the error was calculated as in Ciliegi et al. (1997). This value of HR, with a Galactic hydrogen column density, implies a spectral index of . If NGC 4395 is indeed a typical Seyfert 1 we would expect (Laor et al. 1997 ; Walter & Fink 1993), which would require an additional hydrogen column density of cm-2 to explain the observed HR. The hardness ratio for NGC 4395, therefore, is consistent with a modest intrinsic absorption of the soft part of the X-ray spectrum.
| HRI | PSPC | ||||
| Low State | High State | ||||
| 0.37 | 1.11 | 2.06 | |||
| 0.32 | 1.10 | 2.05 | |||
| Fluxes in units of ergs s-1 cm-2 | |||||


3.2 Analysis of optical spectra
Figure 2 shows the spectra obtained in July 1996 and January 1997. Within 6 months the continuum has changed by a factor of 1.3 at red end of the spectra and by a factor of 2.2 at the blue end. The nuclear source becomes bluer when brighter, with a change in the spectral index from to (see Section 4). From the narrow line fluxes quoted in table 2 it seems that the flux at the red end of the spectrum obtained in January 1997 might be slightly overestimated when compared to the July 1996 observation. It is then possible that there is negligible change at the red end of the spectra, and an even more dramatic change in colour between July 1996 and January 1997. The continuum becomes harder when it is brighter, which is a general characteristic of classical AGNs (Kassebaum et al. 1997; Kaspi et al. 1996a; Reichert et al. 1994; Peterson et al. 1991; Edelson, Krolik & Pike 1990).
Two and three Gaussians were fitted to H and H respectively: a narrow component with a fixed (instrumental) FWHM as measured from the narrow lines, and one (or two) free parameter broad components to fit the extended wings. The continuum level and slope were also free parameters during the fitting. A Lorentzian profile was also fitted to the broad components, but the results were much poorer than when using Gaussian profiles. Figure 4 shows the fit to H and H as individual Gaussian components and as residuals between the data and model. Errors for the broad components were found to be less than 3 percent. They were computed as the square root of the diagonal elements of the covariance matrix of the non-linear model (ie, they represent 68 percent confidence intervals for each parameter taken separately). Table 3 gives the fluxes and FWHM obtained for each line. For H the values for both fitted broad components are shown.

The narrow line widths are not resolved in our data (resolution 3.5 Å). To find the fluxes given in table 2 the lines were fitted with a single Gaussian (except for the nitrogen doublet). Gaussian profile fitting to the Balmer lines determined the broad component luminosities. Two and three Gaussians were fitted to H and H respectively: a narrow component with a fixed (instrumental) FWHM as measured from the narrow lines, and one (or two) free parameter broad components to fit the extended wings. The continuum level and slope were also a free parameters during the fitting. Figure 4 shows the fit to H and H as individual Gaussian components and residuals. A Lorentzian profile was also fitted to the broad components but the results were much poorer than when using Gaussian profiles. Errors for the broad line fluxes were found to be less than 3 percent. The errors were computed as the square root of the diagonal elements of the covariance matrix for each parameter of the non-linear model (ie, they represent 68 percent confidence intervals for each parameter taken separately). Table 3 gives the fluxes and FWHM obtained for each line. For H the values for both fitted broad components are shown.
The error on the absolute line fluxes is probably of the order of 30 per cent, but the relative changes in H and H can be obtained to within a few percent by normalizing to nearby narrow line fluxes. At a distance of 5.21 Mpc the NLR has a linear size of pc (from HST PC narrow band observations centred on the [OIII] 5007 line; Filippenko, Ho & Sargent 1993). Although fairly modest, this diameter implies a traveling time of more than 30 years which should ensure that any variations in the central continuum source will be smeared out within the NLR and that the narrow line emission is fairly constant.
Given the observed size of the nuclear region (see sections 2.3 and 3.2) there should be no significant aperture effects to take into account, so we can use the ratios of the narrow line fluxes observed in July 1996 and January 1997 to assess any relative calibration differences. The observed narrow line ratios indicate that there is a slight variation with wavelength in the relative calibration. By fitting to these ratios, and assessing their scatter about the result, we can estimate the significance of the broad line variations.
Figure 5 shows the narrow line ratios taken from table 2 and plotted against wavelength. The straight line is an unweighted best fit. If the two narrow line spectra are identical, apart from a linear flux correction, then the difference between the individual line ratios and this line reflect the noise in the data. The standard deviation of the scatter about the fit is 0.05, shown as dashed lines.
The line ratios for the broad components of H and H are also shown and clearly differ from the observed trend in the narrow lines (filled stars). If the error in the ratio of the broad lines is similar to that inferred from the narrow lines then we estimate the significance of the difference to be greater than 3 times the standard deviation. The ratio of the H and H narrow components, which are consistent with the ratios found from the other narrow lines, have also been included in figure 5 (open circles). Applying the linear correction found using the narrow line flux ratios to those for the broad components, we find that H/H and H/H, where the error has been assumed to be equal to the typical scatter of the narrow line ratios about the fit. However, we expect the errors to be somewhat larger than this since it is more difficult to measure the flux in broad lines than in narrow lines. Clearly, we have detected real broad line variability, but with a considerably smaller factor than the variations seen in the blue continuum.
Figure 5 also shows the ratio of the fitted continuum observed in July 1996 and January 1997 (see section 4.1) versus wavelength. This shows that there was a large variation in the blue, but that the variation in the red is only marginally significant.

Inspecting the spectra by eye, it appears that the broad components of higher order Balmer lines, such as H and H, have varied by a larger factor. However, we have not attempted to quantify this given the noisiness of the data and the problem of blended lines.
An absorption line, identified as CaIIK, can be seen near the blue end of the January 1997 spectrum. (CaIIH coincides closely with H so is not easily seen). We see an additional tentative absorption line at Å, for which we have no identification. These lines, as well as some other weak features, are not seen in the July 1996 spectrum due to the poor S/N of the data (note that the spectrum in figure 2 has been slightly smoothed). The equivalent width of the observed CaIIK line is just above 1 Å. The line is quite broad, with a FWHM of Å ruling out the possibility of it being caused by interstellar absorption. Its profile is slightly asymmetric, which may indicate more than one component. However, the quality of the data prevents us from reaching any firm conclusions. There is no evidence of other important metal lines such as CN , the G band of CH , MgI+MgH or NaID in the data. Neither is the 4000 Å break observed, suggesting a very young stellar population. Bica (1988) shows that in a sequence of stellar population types from spiral galaxies the equivalent width (EW) of the CaIIK feature decreases towards younger populations as well as towards lower metallicities. The absence of the 4000 Å break means that of Bica’s templates only groups S6 and S7 can apply. For S7 most of the light is thought to come from populations of age years, and still has a EW of CaIIK Å. Although we cannot separate the effects of age and dilution, it seems likely that the population is young (conservatively Gyr) and has a dilution of at least 70%.
Our detection of the CaIIK absorption line suggests that other stellar features characteristic of young clusters may also be detectable. Among these, the near infrared CaII triplet should be the strongest (Terlevich et al. 1990). A detection of the IR CaII triplet would provide confirmation of the presence of the nuclear young cluster plus direct measurement of its velocity dispersion thus its dynamical mass plus an estimate of dilution factor in the near infrared.
3.3 Broad-band variability
After careful examination of the JKT and images, no evidence was found for nuclear variability within any of the two hour observing windows each night. Therefore, the data for each night were averaged. To minimise any colour-dependent effects due to differences in the intrinsic spectral energy distribution of the nucleus, galaxy and stars, only data from frames for which the airmass was less than 1.5 were used to construct the nightly averages. The average airmass is very similar for each night as the observing period was similar in UT.
The average and band CCD count ratios for two stars and for the nucleus and one of the stars are shown in figure 6. The values have been normalised to unity using the data from the last four nights of the run. Based on the star ratios, we conservatively estimate the one-sigma uncertainty for flux variability to be 2 per cent. The nucleus is clearly variable over the first few nights, with the largest change being a brightening by about 20 percent from night two to three. The changes are similar in form and amplitude in both bands. Other small-amplitude variations are possibly present during the second half of the week, although these are not of high significance.
Absolute photometric magnitudes were derived using several flux standards and field stars all observed at very low airmass () so colour differences are insignificant. This implies nuclear (galaxy subtracted) magnitudes of and for NGC 4395 during the JKT run. We estimate 1-sigma errors of magnitudes. This result is fairly consistent with the trend shown by our spectroscopy: the continuum becomes harder when brighter. Filippenko & Sargent (1989) quote a B magnitude of (0.42 mJy) based on the flux density at 4400 Å from their spectroscopic data. From our spectroscopy shown in figure 2, the fluxes at 4400 Å imply B magnitudes of 18.0 and 17.5 for July 1996 and January 1997 respectively. This implies a historical flux variation by a factor , and strongly supports our detection of variability in NGC 4395.
3.4 Analysis of HST images

Photometry in standard bands was derived from the HST observations using a circular aperture of 1 arcsec diameter. The background emission was negligible. This gave values of and , comparable to the values from the JKT broad-band imaging, further supporting evidence of variability.
HST imaging has been previously discussed by Filippenko, Ho & Sargent (1993). However those observations were taken by WFPC1, whereas the data we discuss here ware taken with WFPC2. We therefore examine the images for any sign of resolved structure. Model point spread functions (PSFs) for both the F450W and F814W filters at the relevant chip positions were calculated using Tiny Tim software. Standard iraf routines were then used to find the centroids and radial profiles of both the real and model data. Comparison of HST data with model PSFs in the very central regions is very sensitive to centroid location with respect to pixel centres, as even the PC is somewhat undersampled. We do not attempt a proper model test here, but rather have simply scaled the model PSF by eye to match the real data at radii of 1-2 pixels, in order to look for evidence of extended structure.
The F814W data have a clear peak pixel, so a direct comparison with a PSF is relatively secure. The comparison with the PSF is shown in figure 7. It can be seen that the core of the PSF matches the data very well, so we confirm the finding of Filippenko, Ho & Sargent (1993) that most of the flux from the nucleus of NGC 4395 comes from an unresolved point source. We have not performed a fit, but an intrinsic FWHM of more than about half a pixel would have been easily detected. At our adopted distance of 5.21 Mpc this corresponds to a physical size of 0.6 pc.
In the wings of the profile, however, the source has a clear excess above the PSF. Although this is a very small number of counts, it is a large factor above the predicted wings, so it is unlikely to be accounted for by a slightly different normalisation of the PSF without disagreeing badly with the core. In this region the Tiny Tim PSF should be very reliable and the spacecraft jitter during these observations was only 0.14 pixels. There is, then, evidence of diffuse emission surrounding the core of NGC 4395. Without proper modelling, which we defer to a later paper, it would be unwise to quantify the excess, but very roughly the integrated diffuse flux could be as much as 10 per cent of the core flux, and its physical scale is a diameter of 18 pixels = 0.8 arcsec = 20 pc, similar to the size of the extended [OIII] emission detected by Filippenko, Ho & Sargent (1993) - see also Matthews et al. (1996). Indeed it is quite possible that at the 5-10 per cent fraction of the core that we are considering here, the diffuse light in the F814W filter is entirely due to nebular emission. On the other hand, the detection of an underlying young stellar component (see section 3.2) could explain the diffuse emission as contamination by a nuclear stellar cluster.
In the blue (F450W) observation, the data has two bright pixels and any point source is probably centred somewhere between these. The type of crude analysis we used above is, therefore, even less reliable, and so we defer detailed discussion of this image. Very roughly however, the data are at least consistent with the same story - an unresolved core and diffuse emission at the 10 per cent level.
4 Discussion

4.1 Spectral energy distribution
For the determination of the Spectral Energy Distribution (SED) of NGC 4395, ultraviolet HST spectra obtained with the Faint Object Spectrograph (FOS) in July 1992 were retrieved from the public archive. The original data were published by Filippenko, Ho & Sargent (1993).
To determine the featureless UV and optical continuum a low degree polynomial was fitted to the spectra, allowing for the rejection of all the emission-line features during the fitting procedure. The resulting UV continuum will include broad quasi-continuum such as Balmer continuum and FeII emission-lines. Some starlight contamination is expected as stellar signatures have been observed in the nuclear emission but it is only of the order of 10% of the total flux at 4000 Å (see sections 3.2 and 3.4).
For the X-ray data an effective energy for the ROSAT HRI bandpass of 0.8 keV was deduced assuming a power law spectrum of index . For the PSPC the value adopted was 1.0 keV.
Figure 8 shows the observed SED for NGC 4395. Dashed lines have been drawn as examples of power law functions with spectral indices 0, 1 and 1.7 (). Several striking features are evident in the SED plot. The change in the continuum shape between our two spectroscopic observations is dramatic. The featureless optical continuum obtained in July 1996 is very steep, with a best fitted spectral index . The extrapolation of this continuum to shorter wavelengths seems to agree with the observed X-ray luminosities. Compared with more luminous AGN, NGC 4395 seems to be a very quiet X-ray source, unless the PSPC and the HRI observations were made during extremely low activity states.
The optical continuum looks flatter and brighter by January 1997 with a best fitted , but starts to raise for wavelengths shorter than 4000 Å. The HST UV data from 1992 shows a sharp break at 2200Å. After the break the UV spectrum seems to agree with an spectral distribution. The bump observed at 3000 Å nicely matches the optical observations of 1997. However, due to the uncertainties in the spectral absolute flux calibration and the 4 year gap between the optical and the UV observations, the match could be just fortuitous.
The 3000 Å UV bump in figure 8 resembles the ‘Small Blue Bump’ observed in many other classic AGN (Wills, Netzer & Wills 1985), which is believed to be a blend of broad permitted FeII lines and Balmer continuum (Bac). The UV excess corresponds to ergs cm-2 s-1 (obtained by integrating below the SED beteween 2220 to 4500 Å and subtracting the flux of the underlying continuum approximated as a power law), giving an estimation for the UV excess/H ratio of 2.5. Observed ratios for more powerful AGN range from 2 to 5, in agreement with our observations (Edelson & Malkan 1986; Malkan 1983). These values are much larger than the model predictions for Case B recombination (Kwan & Krolik 1981), suggesting that perhaps more than the 50 per cent of this UV excess comes from FeII emission. The lack of observed FeII features in the optical range in NGC 4395 is not unusual. Wills, Netzer & Wills (1985) and Netzer et al. (1985) have shown that strong UV FeII emitters can show extremely weak optical FeII lines.
The 2200 Å break can also be explained as substantial internal reddening in NGC 4395. Using the extinction curve by Cardelli, Clayton & Mathis (1989) we find that a visual absorption is required to produce the dip at 2200 Å. The dust responsible for this extinction is probably not located in the Broad Line Region (BLR) since it is unlikely to survive the high densities and temperatures. Nor does the observed Balmer decrement support the presence of significant dust in the NLR: from table 2 we find H/H, while an extinction implies H/H. Rowan-Robinson (1995) claims that the dust responsible for optical and UV reddening in quasars, with , is diffuse material located in the NLR or associated with the interstellar medium of the parent galaxy. The later seems to agree with our observations, although an is a slightly high amount of extinction for a nearly face on galaxy.
We seem to have caught NGC 4395 in three different states. The broad band JKT data and the HST images show a bright and blue source with , similar to luminous quasars. The January 1997 and 1988 data show a state with and a much less obvious ‘Big Blue Bump’. Finally, in July 1996, NGC 4395 shows a steep spectrum with . The relative strength and slope of the Blue Bump can vary widely amongst quasars and Seyfert galaxies (Elvis et al. 1994; Walter & Fink 1993; Puchnariewicz et al. 1996). In the NGC 4395 medium state, the observed continuum with is in fact quite similar to that seen in many Seyfert galaxies (e.g., Edelson and Malkan 1986; Kriss et al. 1991). The low state spectrum of July 1996 is much more unnusual, but not unprecedented - for example, the ultraluminous IRAS galaxy F10214+4724 and the archetypal Type 2 Seyfert NGC 1068 both show steep spectra throughout the near-IR to UV (see Lawrence et al. 1994 and references therein). More recently two other extremely low luminosity broad-line AGN have been found to have a steep optical-UV spectrum - M81 (Ho, Filippenko & Sargent 1996), and NGC 4579 (Barth et al. 1996). In both these cases the X-ray luminosity is very strong, with = 0.92 and 0.86 respectively. However, for NGC 4395, the continuum seems to continue falling steeply all the way to soft X-rays ( – see section 4.6).
4.2 Optical spectroscopic variability

For the first time optical variability has been reported for NGC 4395. Previous observations had given negative results for any change in the continuum level or line fluxes (Shields & Filippenko 1992), although this was not quantified. Our data show a substantial change in the optical continuum (3700 - 6700 Å), as can be seen in figure 2. It seems that NGC 4395 moves between high and low activity states, characterized by spectral distributions with indices and , respectively. The broad-band data suggest an even higher state with .
As was mentioned earlier, a significant variation in the H and H broad line fluxes has been detected, but with an amplitude much smaller than the variation exhibited by the continuum. Variability studies for local Seyfert galaxies show that the amplitude of the flux variations changes from line to line, with the high ionization lines showing the largest variations (Carone et al. 1996; Clavel et al. 1991; Kassebaum et al. 1997). While a variation of 1.5 is normal for the total H flux, a factor of up to 16 has been observed for HeII. From table 3 we see that the (not corrected - see section 3.2) ratio of the 1996 fluxes to 1997 fluxes is 1.2 for H and 1.3 for H.
Rosenblatt et al. (1992) carried out optical spectroscopic monitoring of 13 Seyfert galaxies with L(H) ergs s-1 from 1979 to 1984. They found strong evidence that variability in the continuum and H occur on time scales of 90 days or less. They also found that less luminous galaxies are more strongly variable in their lines and continuum. Our report of optical variability for NGC 4395 shows that extremely low luminosity Seyfert galaxies do vary, but it is still unclear whether they follow the pattern shown by the more luminous objects. Rosenblatt et al. also show that in 8 galaxies peak-to-peak changes in H fluxes were 100 per cent – 200 per cent, while the continuum varied by 200 per cent – 350 per cent for 12 of the 13 galaxies, in agreement with our observations for NGC 4395.
No change in the line profiles is observed between the two epochs, as can be seen in figure 9, where the H + N II lines from July 1996 and January 1997 have been plotted together, after continuum subtraction and a scaling of the former by a factor of 1.2. It has been shown for NGC 5548 that while emission-line fluxes vary with changes in the ionizing continuum, the line profiles do not reflect these variations (Wanders & Peterson 1996; Kassebaum et al. 1997). Instead, we expect the time-scale for line profile changes to correlate with the BLR kinematical evolution times-cale.
As has been noted, it is a common property of Seyfert galaxy variability that the optical continuum becomes harder when the source becomes brighter. However, it has always been worrying that this might be due to stellar contamination in the red. For NGC 4395, the surrounding bulge is of very low surface brightness and Filippenko, Ho & Sargent (1993) stress the featurless nature of the continuum, suggesting that any contribution from an old stellar population is small. Our discovery of CaIIK absorption (section 3.2) and a diffuse component to the nuclear broad-band emission (section 3.4) suggests that a small but significant fraction of the light (10–20%) comes from a very young stellar cluster, but this is unlikely to produce the colour dependence observed in variability. An important test will be high S/N spectroscopy in the low state, when the CaIIK absoprtion should be larger.
4.3 Fast variability
In the X-rays, we have seen a factor two variation in 15 days. By the standards of local AGN, this is not particularly fast (for example, NGC 4051 can change by a factor of two in half an hour - see Papadakis & Lawrence 1995). Likewise, optical spectroscopic variability by a factor of two in six months is quite reasonable for local Seyfert galaxies like NGC 5548. Luminous quasars variations are slower, taking typically several years to vary by a factor of two - see for example the light-curves in Hawkins (1996). However we have evidence in two ways that NGC 4395 varies in a more dramatic fashion than classical Seyfert galaxies.
First, we note that the last night of our broad-band imaging (JKT) observations were taken only 32 days before the night in which we found the spectroscopic low state. During this time the B-band flux decreased by a factor three. Variations by a factor of three in the UV over 50 days certainly occur in Seyfert galaxies - for example in the well known 1989 monitoring of NGC 5548 (Clavel et al. 1991). Over the same period, the blue-optical flux (at 4870 Å) followed the same pattern of variation, but with a much smaller amplitude, about a factor 1.5 (Peterson et al. 1991). The largest optical variations seen in the four year 1988 - 1992 optical monitoring of NGC 5548 (Peterson et al. 1994) are a factor two over about 100 days.
The second piece of evidence that NGC 4395 varies more dramatically and/or more quickly is that we have seen a 20 per cent change from one night to the next during our broad-band imaging observations. Very few short-times-cale monitoring campaigns have been carried out. Optical monitoring of the low luminosity Seyfert NGC 4051 by Done et al. (1990) found the -band flux to be constant within 1 per cent over a whole week. Likewise, the two week long monitoring of NGC 4151 by Edelson et al. (1996) showed that variations at 5125 Å were 1 per cent or less. During the same period however, UV variations were considerably larger, with a normalised variability amplitude of 9 per cent at 1275 Å, and one particular event showing a rise of per cent over 1 day.
There is then tentative evidence that either NGC 4395 varies characteristically more quickly or with larger amplitude than more luminous AGN. However for the intra-week monitoring in particular we may have seen a freak event. Repeated monitoring is clearly needed to see what may be typical. UV and fast X-ray monitoring would also be of great interest.
4.4 The ionizing continuum
As noted in section 4.1, the blue bump in NGC 4395 is occasionally strong, and sometimes very weak. In this section we ask whether the implied ionising continuum is luminous enough to produce the observed broad Balmer lines. This depends sensitively on how one extrapolates into the UV. If we assume a power-law spectrum , where is the monochromatic luminosity per unit frequency at the hydrogen ionisation edge , then extrapolating to infinity gives the number of ionising photons . (Some authors extrapolate to the He edge at 228 Å but this makes relatively little difference). can in turn be estimated by extrapolating from the observed optical/UV continuum. Then on standard Case B assumptions, and with a unity covering factor and assuming that all the ionising photons are absorbed . More realistic conditions should change this predicted value by less than a factor two. Relaxing the other assumptions (such as complete coverage) makes larger.
For the medium state, we can use the H luminosity observed in January 1997, and calculate by extrapolating the HST UV luminosity at 2000 Å with . (This corresponds to the sum of areas a+b in figure 8 where, for the purposes of the plot, we have adopted the He edge as the upper limit for the ionizing continuum; the actual determination of was done integrating to infinity). This gives which, within the uncertainties of this calculation is just consistent with H being produced by photo-ionisation. For the low state, we can use the H luminosity observed in July 1996 (which is only 0.8 times smaller than the H luminosity in the high state). If we optimistically extrapolate from the blue end of our optical spectrum with the result is very similar to the case above. However, if the observed steep spectrum continues falling as (area a in figure 8) we find , and conclude that the deduced ionising luminosity fails to explain the observed broad H by a substantial factor.
Such a deficit of ionising photons has been claimed for Seyfert 2 galaxies (e.g., Wilson, Ward & Haniff 1988; Kinney et al. 1991) and for the extended emission-line regions of radio galaxies (e.g., Robinson et al. 1987), where it has been used to argue for an obscured and/or anisotropic continuum. To our knowledge such a deficit has rarely if ever been claimed for traditional luminous broad-line objects, i.e., Seyfert 1s and quasars - indeed the excess of available continuum to lines is often used to deduce that the BLR covering factor is much less than 1 (Yee 1980, Shuder 1981). One exception we are aware of is that Filippenko (1985) argued that extrapolating the optical continuum of the broad line radio galaxy Pictor A yields a deficit of a factor three. More recently, Barth et al. (1996) perform a similar calculation for the very low luminosity broad line object NGC 4579, which also has a steep UV continuum. They find that the extrapolated ionising continuum is marginally sufficient to explain the observed narrow lines, but fails to explain broad H by a substantial factor.
Obviously if the ionising continuum cannot explain the observed broad emission-lines, this is a potentially important result, and may imply that the continuum is anisotropic, or that an extra heating source is required for Balmer lines in AGN, such as mechanical heating of some kind. However, given that H varies, that the UV very likely also varies, and that we do not have simultaneous optical and UV data, we cannot yet make such a bold statement. Further monitoring, especially in the UV, is very important.
4.5 Black hole mass in NGC 4395
We can crudely estimate the bolometric luminosity of NGC 4395 by assuming a simplified shape for the whole spectral energy distribution. Long wavelength observations in principle help constrain the SED below 1 m. Radio VLA observations of a compact source coincident with the nucleus of NGC 4395 give a flux of mJy at 20 cm and mJy at 6 cm. IRAS observations at 12 m, 25m and 60m show cirrus-like emission, most probably coming from cold dust heated by the interstellar radiation field within the NGC 4395 disk, rather than warmer dust heated by the nuclear source.
Without far-infrared observations of the nucleus to constrain the bolometric luminosity, we will assume two very simple models: (1) a power law with index = 1.7, normalised at 6800 Å to match our optical spectroscopy, and with cut-offs at 20 m and 2 keV; (2) the same as (1) but assuming = 1. The bolometric luminosities are found to be ergs s-1 for the first case and ergs s-1 for the second. The two values are fortuitously similar, hiding the fact that in the first case nearly all the luminosity is in the mid-IR, and in the second case in the UV. If we had chosen 100 m as the cut off in the far infra-red, the bolometric luminosity increases by almost an order of magnitude for case (1), while it remains almost unchanged for case (2). Note also that if the infrared emission is largely reprocessed energy, then for some source geometries including both the raw and reprocessed components may overestimate the nuclear luminosity . We will adopt ergs s-1 as a representative value for the bolometric luminosity.
If is the velocity dispersion of virialized clouds within a distance of the nucleus then the central mass of an AGN is /G. While can be estimated from the half width zero intensity of the broad line components ( FWZI(H), Wandel 1991), the value of is less certain. In the last 10 years reverberation mapping has made it possible to estimate the size of the BLR in a direct way, in contrast with previous estimations through AGN standard photoionization models which had overestimated by about an order of magnitude (Peterson 1994; Maoz 1994).
Reverberation mapping also appears to confirm a luminosity-size-mass relationship consistent with (Kaspi et al. 1996b). Such a relationship is theoretically expected given two somewhat naïve assumptions: (1) the shape of the ionising continuum is the same for all AGN, and (2) the BLR is characterized by the same value in all cases for the product of the ionising parameter U (the ratio of the density of ionized atoms to ionizing photons) and the cloud density . The best fit slope from AGN data covering two orders of magnitude in luminosity gives pc, where is the 0.1 – 1 m luminosity in units of ergs s-1 (Netzer & Peterson 1997). However, the emission spectrum of LINERs, which are regarded as low luminosity versions of the more powerful AGN, have been explained with a value for the ionization parameter 10 times smaller than that inferred for Seyfert galaxies (Ferland & Netzer 1983). Even if all Seyfert 1 galaxies (including NGC 4395) can be characterised by a particular photoionization regime, any extrapolation of the physical conditions derived for the more luminous objects to very low luminosity sources may introduce major errors in our calculations.
Bearing in mind all the limitations discussed above we find, from our spectra of NGC 4395, that ergs s-1, implying cm. For FWZI(H km s-1 the mass of the central object in NGC 4395 is kg, or . The corresponding Eddington luminosity is ergs s-1. From the estimates of and the bolometric luminosity we find that the central source is emitting at .
Otherwise, if the distance to the BLR does not scale as to very low luminosities but, instead, approaches a minimum value (), then the central mass in NGC 4395 could be much larger. The smallest observed values of correspond to 0–3 light-days for NGC 4151 (Kaspi et al. 1996a) and 4 light-days for NGC 4593 (Dietrich et al. 1994). A light-day would imply a black hole mass of and NGC 4395 would be extremely underluminous, emitting at just .
4.6 X-ray loudness
To compare the X-ray flux with continuum emission at other wavelengths we will use the spectral indices and , where the index is defined between 2500 Å () and 2keV (), and between 1 m () and 2 keV. Using the observed flux at 2500 Å, and extrapolating the optical spectroscopy to obtain we find that using the range of observed X-ray fluxes gives and , where the monochromatic X-ray fluxes at 2 keV have been determined from the broad-band observations assuming a power law index of 1.5 between 0.1 and 2.4 keV.
Values of for AGN (Mushotzky & Wandel 1989; Laor et al. 1994; Laor et al. 1997 ; Walter & Fink 1993; Barth et al. 1996; Mushotzky 1993) are normally regarded as a good estimate of the size of the ‘Blue Bump’ relative to the X-ray emission. Typically, for quasars and Seyfert 1 galaxies, . For LINERs a much smaller value is found () due to the lower UV fluxes relative to X-rays. NGC 4395 has a steep which is the result of the low X-ray flux rather than powerful UV emission. A similar result is found amongst other low luminosity Seyfert galaxies (Koratkar et al. 1995) which are faint in the UV, but even less bright in the X-rays, giving .
The power law index better characterizes X-ray loudness, since the flux at 1 m is less affected by either internal absorption or the intrinsic magnitude of the UV power. The value of found for NGC 4395 () is much larger than that found for more luminous radio-quiet AGN (, Lawrence et al. 1997; see Mushotzky & Wandel 1989 for a power law slope of 1.27 between 7500 Å and 2 keV). This shows that the overall spectral shape for NGC 4395 drops rapidly from the optical to the soft X-rays.
Assuming a mean we find that NGC 4395 is about 25 times less X-ray loud than more powerful radio-quiet AGN. Adopting an absorption cross section per hydrogen atom at 1keV of cm2 (Morrison & McCammon 1983) we find that a hydrogen column density of cm-2 is required to explain the X-ray deficit. A normal interstellar Galactic gas-to-dust ratio N(HI)/E atoms cm-2 mag-1 (Sauvage & Vigroux, 1991), and a Galactic extinction law give A mag, which is not supported by the ratio of the narrow components of the Balmer lines (see table 2) that show a Balmer decrement of H/H 2.5. However, it is quite usual that local Seyferts with large X-ray columns do not have the corresponding line reddening, suggesting absoprtion by dust free gas. Examples of X-ray quiet quasars can be found in Laor et al. 1997. It is unknown if these objects are intrinsically faint, or absorbed but otherwise normal quasars. However, the observed Balmer decrement of the broad component, H/H, does imply an if an extinction free ratio of 4.5 is adopted as typical for AGN (Osterbrock 1989). This, together with the lack of ionizing flux noted in the previous section and the break of the UV continuum at 2200 Å could imply that some amount of absorption and extinction are indeed occurring somewhere in the line of sight towards the central source.
4.7 Comparison with other low luminosity AGN
The LINER nucleus in M 81 is a very well studied low luminosity AGN. Compact X-ray and radio sources coincident with the nucleus have been detected (Fabbiano 1988, Bartel et al. 1982). It has an H broad component with a flux 20 times fainter than the flux detected in NGC 4051, the dimmest ‘classical’ Seyfert galaxy (Filippenko & Sargent 1988). Compared to M 81, the luminosity of the mean H broad component for NGC 4395 taken from table 3 is times smaller. Another example of a LINER nucleus that shows AGN-like properties (broad H and X-ray and UV variability) is NGC 4579 (Barth et al. 1996)
Estimates for M 81 show that if photoionization is responsible for its LINER activity, values of U and cm-3 are required, and a radius for the BLR of cm can be inferred (Ho, Filippenko & Sargent 1996). For NGC 4395 the size of the BLR found in section 4.5 is times smaller (under the assumption that U and are as inferred from more powerful AGN). The central source in M 81 is emitting at 0.04 per cent of the Eddington limit (Ho, Filippenko & Sargent 1996), a factor 3 smaller than the value found for NGC 4395. As has been suggested before, the low ionization lines observed in LINERs could be caused by small values of U and the consequent reduction of the ionizing photon flux, probably as a result of a larger distance between the central source and the emitting clouds (Halpern & Steiner 1983; Ferland & Netzer 1983).
The shape of the optical featureless continuum during the low state of NGC 4395 resembles the steep UV continuum observed in M 81 (Ho, Filippenko & Sargent 1996) for which a spectral index close to 2 was derived. Unfortunately, the shape of the continuum of M 81 in the optical range is not well known because of the heavy contamination by starlight. Maoz et al. (1998) have recently studied the UV spectra of seven LINERs. They found that two of the nuclei (M 81 and NGC 4579) show strong broad emission lines. However, at least in other three cases the UV continuum is dominated by stellar features from massive young stars. They suggest that LINERs could be formed by two distinctive populations: a first group where young massive stars are responsible for the photoionization of the line emitting gas, and a second group where the central source is a genuine AGN. The possible UV variability detected in NGC 4579 supports this view (Barth et al. 1996).
Optical variability has not been reported for M 81 (Ho, Filippenko & Sargent 1996). The H light-curve shows only slight variation (10 per cent – 15 per cent), the reality of which is unclear, given the complexity of the observations. There is no report of continuum flux changes either. In this respect, the UV variability reported for NGC 4579 could be a further link between LINER nuclei and more powerful AGN. X-ray long term variability by significant factors has been reported for M 81 (Petre et al. 1993; Ishisaki et al. 1996) as well as for NGC 4579 (Serlemitsos, Ptak & Yaqoob 1996).
4.8 An advective-dominated accretion flow in NGC 4395
One possibility to explain the low luminosity for NGC 4395 is the presence of an advective-dominated accretion flow, or ADAF (e.g., Narayan & Yi 1995; Narayan, Mahadevan & Quataert 1998). Such a disc is optically thin and cooled by radial advection of heat rather than radiation. Such discs differ from the optically thick variety is several ways. ADAFs have a low radiative efficiency, are thermally and viscously stable and have a vertical thickness similar to their radius (i.e., the geometrically thin approximation does not hold). The combination of an outer, optically thick disk with an inner ADAF seems capable of explaining some apparently under-luminous, hot black-hole binary systems (e.g., Esin, McClintock & Narayan 1997), although it is unclear physically how to join the two parts of the disc. ADAFS have also been proposed to explain under-luminous galactic nuclei, most notably for Sagittarius A∗ (Narayan et al. 1998). For NGC 4395 an ADAF could allow for a ‘normal’ mass black-hole while maintaining consistency with the bolometric luminosity. However, our estimation of the black-hole mass implies a radiative efficiency higher than usually associated with ADAFs. For an upper limit for the mass of the black-hole see also Ho (1998).
It has been claimed that dwarf AGN vary considerably less than luminous Seyferts, both in the X-rays (Ptak et al. 1998) and the optical (Shields & Filippenko 1992; Ho, Filippenko & Sargent 1996). Ptak et al. (1998) propose that this is because dwarf AGN are ADAFs, and have characteristically larger X-ray emitting regions. However in NGC 4395 we see clear large amplitude variability quite consistent with more luminous Seyferts. Perhaps typical dwarf AGN have large black holes together with low accretion rates and advection dominated flows, whereas NGC 4395 might have a small black hole and a higher accretion rate (see section 4.5 and Ho 1998).
4.9 Constraints on nuclear starburst models
A plausible model for the IR,optical, UV and at least part of the X-ray emission in low luminosity AGN, and perhaps all AGN, is the starburst model developed by Terlevich and collaborators (see, e.g., Terlevich, Tenorio-Tagle & Franco, 1992). NGC 4395 offers a unique opportunity to test this paradigm: with a blue nuclear absolute magnitude of a single compact supernova remnant is enough to account for its luminosity. We have significant constraints from our spectroscopy, and from both short and long term variability.
In the starburst model, Type 1 AGN correspond to a phase in the evolution of a metal rich star cluster with an age around 10-20 Myr, where the luminosity is dominated by Type II supernovae which are exploding within a dense medium. These compact supernova remnants (cSNR) evolve rapidly and so are highly luminous. The energy output is mostly in the extreme UV and X-ray region of the spectrum. The optical continuum is a mixture of evolved stars and emission from the SNRs, but fast moving fragments are also expected to produce the BLR line emission. Indeed, the spectra of at least some luminous SN exploding in HII regions have a striking resemblance to that of the BLR of Seyfert galaxies (Filippenko 1989). These cSNR in some well documented cases radiate about ergs in under two years, thus reaching peak luminosities well in excess of ergs s-1 (Aretxaga et al. in preparation).
Our discovery of CaIIK absorption in NGC 4395, without a corresponding 4000 Å break, is strong evidence for a young stellar population, as discussed in section 3.2. However the observed variability rules out the possibility that the blue light is simply young stars. It is conceivable that the optical continuum is a mixture of early-type stars and variable cSNR emission (or of course a mixture of early-type stars and variable accretion disc emission). As the CaIIK equivalent width is a sensitive function of stellar type, the dilution required to match our observed 1 Å equivalent width depends on the age of the cluster. It would be important to test the predictions of such mixture models explicitly against the whole spectrum. We do not attempt this here, but may do so in later work.
A significant constraint on starburst explanations of NGC 4395 is the long term stability. Although we have seen factor 2 variability on relatively short time-scales, comparison with the Filippenko & Sargent (1989) observations, and indeed with the POSS image discussed by Filippenko, Ho & Sargent (1993), shows that there has been no significant long term change in mean brightness beyond a factor of 2 in the last years. The secular variability in the starburst model comes from the evolution of cSNRs. In more luminous Seyferts, the superposition of cSNR events at a rate governed by the total mass of the starburst could potentially explain the characteristic month-time-scale flaring.
In the case of NGC 4395, we should be looking at the decline of a single cSNR whose secular blue light-curve is given by (Aretxaga & Terlevich 1994, Aretxaga, Cid Fernandes & Terlevich, 1997). The peak luminosity of the remnant will be a function of the circumstellar density (), with more luminous events ocurring in denser regions. We note that the observed absolute magnitude of NGC 4395 () is much fainter than the absolute magnitude of a single cSNR near peak ( and for and cm-3, respectively). This, together with the low rate of change seen in the last 40 years, as mentioned above, suggests that we are observing the late evolution of the cSNR. Using the law we find that a cSNR of age years old evolving in a medium with density cm-3 would have shown a decline of 10 magnitudes since maximum and of just 0.2 magnitudes in the last 40 years. On the other hand, with a density of cm-3 a year old cSNR would have declined about 8.5 magnitudes since maximum and about 0.1 magnitudes in the last 40 years. Both cases are in agreement with the observations.
We can also compare predicted line strengths by using the cSNR models of Terlevich (1994). If a significant fraction of the nuclear blue luminosity is due to a starburst, then the predicted SN rate is yr-1. We have seen that the nucleus has,
ergs s-1
ergs s-1
ergs s-1
ergs s-1
and the FWHM of the broad component of the broad lines, while difficult to measure, is about 1000 Km/sec.
From table 1.1 and 1.2 of Terlevich (1994) it is possible to see that this set of parameters corresponds to a cSNR evolving in a medium with cm-3 and age equal or slightly larger than the last entry corresponding to about 32 years 111There is a typographical error in table 1 of Terlevich 1994: the time for the last entry is 31.5 years not 25.6 years. The predicted values for 34 yrs are:
ergs s-1
ergs s-1
ergs s-1
and the FWHM of the broad component about twice the shock velocity or 700 km s-1. The line properties are then in rough agreement with a cSNR of about 34 years old, somewhat younger than the age derived from the absolute blue magnitude. Further work is needed to see if the agreement can be improved.
We can also make an estimate of the expected X-ray fluxes of such a cSNR. According to the analytical approximations (Terlevich 1994), for a cSNR evolving in a CSMat(?) and t = 34 yr , the leading shock should have an X-ray luminosity of ergs s-1 in the keV band, and a temperature of K. At a distance of 5.21 Mpc and assuming a Raymond & Smith model for Solar abundance with Log(T) and a hydrogen column of 21.15, the predicted count rate in the ROSAT HRI band pass is counts s-1 and in the ROSAT PSPC band pass would be counts s-1 with hardness ratio H.R. . Thus we conclude that the predicted fluxes for ROSAT are in good agreement with our observations.
The short time-scale variability in the starburst model is produced by cooling instabilities in the strongly radiative shock (Terlevich et al. 1995; Plewa 1995) and also the result of fragments or density fluctuations in the ejecta interacting with the outer thin shell (Cid Fernandes et al. 1996). These mechanisms are capable of producing strong variability in luminous AGN on time-scales from hours to weeks. However it might be expected that such an old remnant would have become relatively stable. It is currently not clear whether fast optical and X-ray variability can be produced in such a case, and further theoretical work is needed.
In summary, we have some evidence that a single cSNR could explain the observed low luminosity optical and X-ray flux from NGC 4395, if the remnant is some tens to hundreds of years old. However, the observed short term (days to months), large-amplitude optical and X-ray variability, including changes in optical continuum shape, pose a major challenge for such a model. Detailed modelling is required to further test this hypothesis.
5 Summary
In this paper we present optical broad-band images and spectra as well as ROSAT X-ray data for the nearest, most feeble known Seyfert 1 galaxy NGC 4395. The main results can be summarised as follows:
1. The optical continuum has been observed to vary by a factor at 6800 Å and by a factor of at 3800 Å in a period of 6 months (between July 1996 and January 1997), becoming bluer when brighter. A power law fit shows that the spectral shape changed from an index to .
2. One week of broad-band monitoring was obtained in June 1996. The B and I bands show per cent variability in just 24 hours. The inferred spectral shape is consistent with a power law fit with and implies a change by a factor of at 4400 Å in just one month, when compared with the low state spectroscopy from July 1996. This evidence shows that NGC 4395 varies in much more dramatic way than classic Seyfert galaxies.
4. UV spectroscopy shows a clear hump at Å consistent with the small blue bump observed in classic AGN. The extrapolation of the featureless UV continuum to higher frequencies assuming gives just enough ionizing photons to explain the observed H fluxes. However a deficit of photons is found when the extrapolation is done assuming a steeper power law as implied by the optical low state spectral shape. Anisotropic emission from the central source and/or a different ionizing mechanism might need to be considered to explain the lack of UV photons.
5. HRI and PSPC ROSAT data show that the flux from a weak source consistent with the position of the nucleus changed by a factor of 2 in 15 days. NGC 4395 appears to be times less X-ray loud than classic AGN. The low luminosity can be explained as substantial absorption along the line of sight. Spectral analysis of the PSPC data is consistent with some intrinsic absorption.
6. Applying reverberation mapping results from classic AGN to NGC 4395 we infer a radius for the BLR of just pc! This implies that the central source is emitting at . However, these results were calculated by extrapolating the observed properties of AGN times more luminous than NGC 4395 and, therefore, must be revisited when more observations on very low luminosity AGN become available.
7. We report the discovery of a weak CaIIK absorption line (EW Å), suggesting the presence of a young stellar cluster coincident with the nucleus of NGC 4395. The starlight component from the cluster is estimated to be less than 30% of the total flux at 4000 Å. The cluster may be directly observed as a diffuse component in HST optical imaging, suggesting a 10% contribution. We expect the IR CaII triplet to be detectable. Thus high resolution spectroscopy can provide a direct measurement of the dynamical mass of the young cluster.
8. We show that NGC 4395 can also potentially be explained by a starburst with a single compact SNR of age 50–500 years producing the broad lines, X-rays and the NLR. The observed rapid variability is a potential problem for this model. Although on theoretical grounds it is expected that these radiatively dominated remnants to be highly variable, it is unfortunate that no short term variability study is available for known compact SNRs.
Acknowledgements
PL acknowledges the support of a PPARC – Fundación Andes research studentship. We thank Luis Ho and collaborators who kindly provided us with their spectroscopic data of NGC 4395. We also thank Elena Terlevich for providing helpful comments of this work. The Jacobus Kapteyn and Isaac Newton telescopes are operated on the island of La Palma by the Royal Greenwich Observatory in the Spanish Observatorio del Roque de los Muchachos of the Instituto de Astrofísica de Canarias. The DSS plate used in this paper was based on photographic data of the National Geographic Society – Palomar Observatory Sky Survey (NGS-POSS) obtained using the Oschin Telescope on Palomar Mountain. The NGS-POSS was funded by a grant from the National Geographic Society to the California Institute of Technology. The plates were processed into the present compressed digital form with their permission. The Digitized Sky Survey was produced at the Space Telescope Science Institute under US Government grant NAG W-2166. Data were reduced using Starlink facilities. PL thanks Andrew Cooke for his useful help throughout the writing of this paper.
References
- [] Aretxaga I. & Terlevich R., 1994, MNRAS, 269, 462
- [] Aretxaga I., Cid Fernandes R. & Terlevich R., 1997, MNRAS, 286, 271
- [] Bartel N., Shapiro I.I., Corey B.E., Marcaide J.M., Rogers A.E.E., Whitney A.R., Cappallo R.J., Graham D.A., Romney J.D. & Preston R.A., 1982, ApJ, 262, 556
- [] Bica E., 1988, A&A, 195, 76
- [] Barth A.J., Reichert G.A., Filippenko A.V., Ho L.C., Shields J.C., Mushotzky R.F. & Puchnarewicz E.M., 1996, AJ, 112, 1829
- [] Burstein D. & Heiles C., 1984, ApJS, 54, 33
- [] Cardelli J.A., Clayton G.C. & Mathis J.S., 1989, ApJ, 345, 245
- [] Carone T.E. et al., 1996, ApJ, 471, 737
- [] Clavel J. et al., 1991, ApJ, 366, 64
- [] Cid Fernandes R., Plewa T., Różyczka M., Franco J., Terlevich R., Tenorio-Tagle G. & Miller W., 1996, MNRAS, 283, 419
- [] Ciliegi P., Elvis M., Wilkes B.J., Boyle B.J. & McMahon R.G., 1997, MNRAS, 284, 401
- [] David L.P., Harnden F.R., Kearns K. & Zombeck M.V., 1997, The ROSAT HRI Calibration Report, U.S. ROSAT Science Data Center, SAO.
- [] Dietrich M. et al., 1994, A&A, 284, 33
- [] Done C., Ward M.J., Fabian A.C., Kunieda H., Tsuruta S., Lawrence A., Smith M.G. & Wamsteker W., 1990, MNRAS, 243, 713
- [] Edelson R.A. & Malkan M.A., 1986, ApJ, 308, 59
- [] Edelson R.A., Krolik J.H. & Pike G.F., 1990, ApJ, 359, 86
- [] Edelson R.A. et al., 1996, ApJ, 470, 364
- [] Elvis M., Wilkes B., McDowell J.C., Green R.F., Bechtold J., Willner S.P., Oey M.S., Polomski E. & Cutri R., 1994, ApJS, 95, 1
- [] Esin A.A., McClintock J.E. & Narayan R., 1997, ApJ, 489, 865
- [] Fabbiano G., 1988, ApJ, 325, 544
- [] Fabian A.C. & Terlevich R., 1996, MNRAS, 280, L5
- [] Ferland G. & Netzer H., 1983, ApJ, 264, 105
- [] Filippenko A.V., 1985, ApJ, 289, 475
- [] Filippenko A.V., 1989, AJ, 97, 726
- [] Filippenko A.V. & Sargent W.L.W., 1988, ApJ, 324, 134
- [] Filippenko A.V. & Sargent W.L.W., 1989, ApJ, 342, L11
- [] Filippenko A.V, Ho L.C. & Sargent W.L.W., 1993, ApJ, 410, L75
- [] Halpern J.P. & Steiner J.E., 1983, ApJ, 269, L37
- [] Hasinger G., Turner T.J., George I.M. & Boese G., 1992, GSFC OGIP Calibration Memo CAL/ROS/92-00
- [] Hawkins M.R.S., 1996, MNRAS, 278, 787
- [] Ho L.C., 1998, in Chakrabarti S.K, eds, Observational Evidence for Black Holes in the Universe
- [] Ho L.C., Filippenko A.V. & Sargent W.L.W., 1996, ApJ, 462, 183
- [] Ishisaki Y. et al., 1996, PASJ, 48, 237
- [] Kaspi S. et al., 1996a, ApJ, 470, 336
- [] Kaspi S., Smith P.M., Maoz D., Netzer H., & Jannuzi B.T., 1996b, ApJ, 471, L75
- [] Kassebaum T.M., Peterson B.M., Wanders I., Pogge R.W., Bertram R. & Wagner R.M., 1997, ApJ, 475, 106
- [] Kinney A.L., Antonucci R.R.J., Ward M.J., Wilson A.S. & Whittle M., 1991, ApJ, 377, 100
- [] Koratkar A., Deustua S.E., Hekcman T., Filippenko A.V., Ho L.C. & Rao M., 1995, ApJ, 440, 132
- [] Kraan-Korteweg R.C., 1986, A&AS, 66, 255
- [] Kriss G.A., Hartig G.F., Armus L., Blair W.P., Caganoff S. & Dressel L., 1991, ApJ, 377, L13
- [] Kwan J. & Krolik J.H., 1981, ApJ, 250, 478
- [] Laor A., Fiore F., Elvis M., Wilkes B.J. & McDowell J.C., 1997, ApJ, 477, 93
- [] Laor A., Fiore F., Elvis M., Wilkes B.J. & McDowell J.C., 1994, ApJ, 435, 611
- [] Lawrence A., Rigopoulou D., Rowan-Robinson M., McMahon R.G., Broadhurst T. & Lonsdale C.J., 1994, MNRAS 266 L41
- [] Lawrence A., Elvis M., Wilkes B.J., McHardy I. & Brandt N., 1997, MNRAS 285 879
- [] Malkan M.A., 1983, ApJ 268 582
- [] Maoz D., 1994, in Gondhalekar K., Horne K. & Peterson B.M., eds, ASP Conference Series, Vol 69, Reverberation Mapping of the Broad-Line Region in Active Galactic Nuclei
- [] Maoz D., Koratkar A., Shields J.C., Ho L.C., Filippenko A.V. & Sternberg A., 1998, AJ, 116, 55
- [] Matthews L.D., Gallagher III J.S., Krist J., Burrows C. & the WFPC2 IDT., 1996, Bull. American Astron. Soc., 188, 04.03
- [] Matthews L.D., Gallagher III J.S., Krist J., Watson A.M., Burrows C, Griffiths R.E. & the WFPC2 IDT., 1998, in preparation
- [] Morrison R. & McCammon D., 1983 , ApJ, 270, 199
- [] Mushotzky R.F., 1993, in Beckman J.E., Colina L. & Netzer H., eds, The Nearest Active Galaxies
- [] Mushotzky R.F. & Wandel A., 1989, ApJ, 339, 674
- [] Narayan R. & Yi I., 1995, ApJ, 452, 710
- [] Narayan R., Mahadevan R. & Quataert E., 1998, in press
- [] Narayan R. Mahadevan R., Grindlay J.E., Popham G., & Gammie C., 1998, ApJ, 492, 554
- [] Netzer H. & Peterson B.M., 1997, in Maoz D., Sternberg A. & Leibowitz E.M., eds, Astronomical Time Series
- [] Netzer H., Wamsteker W., Wills B.J. & Wills D., 1985, ApJ, 292, 143
- [] Osterbrock D.E., 1989, in Astrophysics of Gaseous Nebulae and Active Galactic Nuclei, University Science Books.
- [] Papadakis I.E. & Lawrence A., 1995, MNRAS 272 161
- [] Peterson B.M. et al., 1991, ApJ, 368, 119
- [] Peterson B.M. et al., 1994, ApJ, 425, 622
- [] Peterson B.M., 1994, in Gondhalekar, K., Horne K. & Peterson B.M., eds, ASP Conference Series, Vol 69, Reverberation Mapping of the Broad-Line Region in Active Galactic Nuclei
- [] Petre R., Mushotzky R.F., Serlemitsos P.J., Jahoda K. & Marshall F.E., 1993, ApJ 418 644
- [] Plewa T., 1995, MNRAS, 275, 143
- [] Ptak A., Yaqoob T., Mushotzky R., Serlemitsos P. & Griffiths R., 1998, ApJ, 501, L37
- [] Puchnarewicz E.M., Mason K.O., Romero-Colmenero E., Carrera F.J., Hasinger G., McMahon R., Mittaz J.P.D., Page M.J. & Carballo R., 1996, MNRAS, 281, 1243
- [] Reichert G.A. et al., 1994, ApJ, 425, 582
- [] Robinson A., Binette L., Fosbury R.A.E. & Tadhunter C.N., 1987, MNRAS, 227, 97
- [] Rosenblatt E.I., Malkan M.A., Sargent W.L.W. & Readhead A.C.S., 1992, ApJS 81 59
- [] Rowan-Robinson M., 1995, MNRAS, 272, 737
- [] Sandage A. & Tammann G.A., 1981, A Revised Shapley-Ames Catalog of Bright Galaxies (RSA), Carnegie Institiution of Washington
- [] Sandage A. & Bedke J., 1994, The Carnegie Atlas of Galaxies, Carnegie Institiution of Washington
- [] Sauvage M. & Vigroux L., 1991, in Hyanes R. & Milne D., eds, IAU Symp 148, The magellanic Clouds
- [] Serlemitsos P.J., Ptak A. & Yaqoob T., 1996, in Eracleous M., Koratkar A., Leitherer C. & Ho L.C., eds, The Physics of LINERs in View of Recent Observations
- [] Shields J.C. & Filippenko A.V., 1992, in Filippenko A.V., eds, ASP Conference Series, Vol 31, Relationshhips between Active Galactic Nuclei and Starburst Galaxies
- [] Shuder J.M., 1981, ApJ, 244, 12
- [] Sramek R., 1992, in Filippenko A.V., eds, ASP Conference Series, Vol 31, Relationshhips between Active Galactic Nuclei and Starburst Galaxies
- [] Stark A.A., Gammie C.F., Wilson R.W., Bally J., Linke R.A., Heiles C. & Hurwitz M., 1992, ApJS, 79, 77
- [] Stickland D.J., Lloyd C., Pike C.D. & Walker E.N., 1987, Observatory, Vol 107, No 1077, p 74
- [] Terlevich E., Díaz A.I. & Terlevich R., 1990, MNRAS, 242, 271
- [] Terlevich R., 1994, in Clegg R.E.S., Stevens I.R., Meikle W.P.S., eds, Circumstellar Media in the Late Stages of Stellar Evolution
- [] Terlevich R., Tenorio-Tagle G., Różyczka M., M, Franco J. & Melnick J., 1995, MNRAS, 272, 198
- [] Terlevich R., Tenorio-Tagle G., Franco J. & Melnick J., 1992, MNRAS, 255, 713
- [] Walter R. & Fink H.H., 1993, A&A, 274, 105
- [] Wandel A., 1991, A&A, 241, 5
- [] Wanders I. & Peterson B.M., 1996, ApJ, 466, 174
- [] Whittet D.C.B., Bode M.F. & Murdin P., 1987, Vistas in Astronomy, Vol 30, No 2, p 135
- [] Wills B.J., Netzer H. & Wills D., 1985, ApJ, 288, 94
- [] Wilson A.S., Ward M.J. & Haniff C.A., 1988, APJ, 334, 121
- [] Wray J.D., 1988, The Color Atlas of Galaxies, Cambridge University Press, Cambridge
- [] Yee H.K.C., 1980, ApJ, 241, 894