Supernova 1996L: evidence of a strong wind episode before the explosion. ††thanks: Based on observations collected at ESO-La Silla (Chile)
Abstract
Observations of the type II SN 1996L reveal the presence of a slowly expanding ( km s-1) shell at cm from the exploding star. Narrow emission features are visible in the early spectra superposed on the normal SN spectrum. Within about two months these features develop narrow symmetric P-Cygni profiles. About 100 days after the explosion the light curve suddenly flattens, the spectral lines broaden and the H flux becomes larger than what is expected from a purely radioactive model. These events are interpreted as signatures of the onset of the interaction between the fast moving ejecta and a slowly moving outer shell of matter ejected before the SN explosion. At about 300 days the narrow lines disappear and the flux drops until the SN fades away, suggesting that the interaction phase is over and that the shell has been swept away. Simple calculations show that the superwind episode started 9 yr before the SN explosion and lasted 6 yr, with an average M⊙/yr.
Even at very late epochs (up to day 335) the typical forbidden lines of [OI], CaII], [FeII] remain undetected or very weak. Spectra after day 270 show relatively strong emission lines of HeI. These lines are narrower than other emission lines coming from the SN ejecta, but broader than those from the CSM. These high excitation lines are probably the result of non-thermal excitation and ionization caused by the deposition of the -rays emitted in the decay of radioactive material mixed in the He layer.
keywords:
Supernovae and Supernova Remnants: general – Supernovae and Supernova Remnants: 1996L1 Introduction
In a supernova explosion the outer layers of the progenitor star are ejected at very large velocities. In the case of core-collapse supernovae, which come from massive stars, when the ejecta impacts on the circumstellar material (CSM) shed by the star during its evolution, a shock front is generated and a fraction of the kinetic energy of the ejecta is converted into radiation. The intensity of the emission depends mainly on the density of the CSM and on the velocity contrast between the ejecta and the CSM. If the density of the CSM is relatively small, the emission from the CSM-ejecta interaction becomes visible only after the SN has faded, that is several years after the explosion. If on the other hand the CSM near the SN is very dense, the interaction can dominate the SN emission even at early phases.
With improved statistics and quality of observations we have now observed objects fitting in the different scenarios. Indeed, in a recent review [Turatto et al. 1997] proposed a new classification system for type II supernovae (SNII) which is based on the strength of the CSM-ejecta interaction as determined by an analysis of its signatures.
At one end of the sequence are the classical SNII, where the emission is determined by thermal balance in the ejecta and the CSM-ejecta interaction is negligible, at least in the early phases. Depending on the shape of their light curve these are divided into plateau (II-P) and linear (II-L) SNe. The current interpretation is that this subdivision corresponds to a range in the mass of the H envelope (from M⊙ in IIP to M⊙ in II-L), which in turn is related to different pre-SN mass loss histories.
At the other extreme are those SNe in which the ejecta interact with a dense CSM soon after the explosion and the SN light is by the emission arising from the interaction [Terlevich 1994]. The best example of this kind of objects is SN 1988Z [Turatto et al. 1993].
In some SNII the evidence of the interaction becomes apparent only when the SN luminosity fades. The fact that, so far, all known objects of this kind are of type IIL is consistent with the understanding that SNe IIL experience strong mass loss during their evolution.
In an even more rare group of SNe the presence of a dense CSM around the exploding stars is revealed early-on from the peculiar emission line profiles, although the ejecta-CSM interaction begins only months later. So far, the best representative object of this class (labeled SNIId by Turatto et al. 1997, where ’d’ stands for ’double’ profile because of the simultaneous presence of broad profiles from the ejecta and narrow ones from the CSM) was SN 1994aj (Benetti et al. 1997, Paper I).
In this paper we present and discuss the case of SN 1996L, whose photometric and spectroscopic properties are very similar to those of SN 1994aj and which therefore can be considered a new member of the SNIId class.
2 Observations
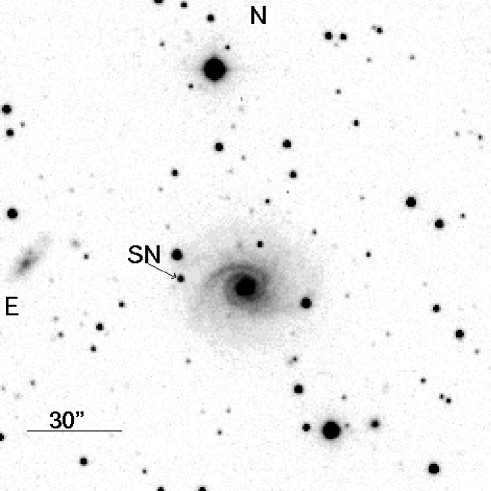
SN 1996L was discovered by McNaught [McNaught 1996] on Mar. 19.6 in the outskirts of the galaxy ESO 266-G10 (Fig. 1). The SN was rather faint at discovery ( mag). Based on a spectrum obtained two days later [Benetti et al. 1996], the SN was classified as type II because of the presence of H Balmer lines in emission superposed on a blue continuum. The Balmer lines had peculiar profiles, showing two emission components, one broad and one narrow, both at the rest wavelength of the lines. This finding prompted an observational campaign.
2.1 Photometry
CCD photometric and spectroscopic observations were obtained on 12 different nights using four different telescopes. Data reduction followed the standard procedures described elsewhere (e.g. Paper I).

The measured magnitudes and the estimated internal
errors are listed in Tab. 1.
The B, V and R light curves of SN 1996L are shown in Fig. 2. The light curves are clearly of the linear type, although some modulation is present during the early decline, as was also the case in other SNe (e.g. SN 1994aj).
| date | J.D. | B | V | R | I | instr. |
|---|---|---|---|---|---|---|
| 2400000+ | ||||||
| 21/3/96 | 50163.7 | ()* | 3.6 | |||
| 16/4/96 | 50189.8 | 3.6 | ||||
| 20/4/96 | 50193.7 | Dutch | ||||
| 11/5/96 | 50214.6 | NTT | ||||
| 12/5/96 | 50215.6 | NTT | ||||
| 15/5/96 | 50218.5 | Dutch | ||||
| 8/6/96 | 50243.5 | 3.6 | ||||
| 18/11/96 | 50405.8 | Dutch | ||||
| 7/12/96 | 50424.8 | 3.6 | ||||
| 31/1/97 | 50479.8 | Dutch | ||||
| 6/2/97 | 50485.8 | 3.6 | ||||
| 9-10/2/97 | 50490.0 | 3.6 |
derived from spectrophotometry
3.6 = ESO 3.6m telescope + EFOSC1
NTT = ESO NTT + EMMI
Dutch = Dutch 0.90m + CCD Camera
As a measure of the overall luminosity decline we use the parameter [Patat et al. 1993], obtaining the values , mag (100d)-1. These values are similar to those of the SNe II-L 1980K and 1994aj, whose light curves are also shown in Fig.2. Since the light curves of SN 1996L appear to be very similar to those of the other two SNe, although they may not be identical, in the following we will adopt as reference epoch (Mar 12, 1996), which gives the best fit of the light curves of SN 1996L with those of SN 1980K and 1994aj. This choice leads to an estimate of the time of maximum, which should have occurred about a week before discovery, with an uncertainty of days. We also estimate that the SN reached a maximum magnitude .
Unfortunately observations were interrupted because of the seasonal gap, but apparently the luminosity decline slowed down significantly between 90 and 270 days ( mag (100d)-1). After day 270, the R light curve decreased rapidly again, with mag (100d)-1.
SN 1996L suffers moderate galactic reddening, E(B-V) [Burstein & Heiles 1984] and there is no evidences of additional extinction in the parent galaxy.
The heliocentric velocity of the parent galaxy is as measured from the HII emission lines visible in the long slit spectra. This corresponds to .
Correcting for the extinction, we obtain . This is very close to the absolute magnitude at maximum of SN 1994aj (, Paper I), and lies between the average values for ‘regular’ and ‘bright’ SNe II-L ( and , respectively, for , Patat et al. 1993).
The main data of SN 1996L and those of its parent galaxy are summarized in Tab. 2.
2.2 Spectroscopy
The journal of the spectroscopic observations is given in Tab.3. The table lists for each spectrum the date (col.1), the phase (col.2), the equipment used (col.3), the exposure time (col.4), the wavelength range (col.5), and the resolution, which is the measured FWHM of the night-sky lines (col.6). In order to improve the S/N ratio, in some cases exposures taken on different nights have been averaged. In those cases we list the cumulative exposure time.
| Parent galaxy | ESO 266–G10 (PGC 36065) |
|---|---|
| Galaxy type | Sa: † |
| RA (2000) | |
| Dec (2000) | 25’11”.6 |
| Recession velocity [km s-1] | |
| Distance modulus (H) | 35.60 |
| Galactic AB | 0.30‡ |
| Offset from nucleus | 29”.5E 2”.2N |
| Date of maximum | JD (Mar 12, 1996) |
| magnitude at max | |
| decline rate [mag (100d)-1] | , |
† NED
‡ Burnstein & Heiles ApJS 54, 33 (1984)
| Date | phase∗ | inst.∗∗ | exp | range | res. |
|---|---|---|---|---|---|
| (days) | (min) | (Å) | (Å) | ||
| 21/3/96 | +9 | 3.6 | 20 | 3750-6950 | 15 |
| 16/4/96 | +34 | 3.6 | 30 | 3750-6950 | 15 |
| 25/4/96 | +44 | 1.5 | 180 | 3060-10470 | 13 |
| 11-12/5/96 | +61 | NTT | 120 | 3640-8940 | 13 |
| 7/12/96 | +270 | 3.6 | 20 | 6000-9800 | 15 |
| 5-9-10/2/97 | +335 | 3.6 | 240 | 3750-9800 | 15 |
* - relative to the estimated epoch of maximum, JD=2450155
** - See note to Table 1 for coding. 1.5 = ESO 1.5m + B&C
The flux calibration of the spectra was checked against the photometry and in case of disagreement the spectra were adjusted.
Figure 3 illustrates the spectroscopic evolution of SN 1996L from phase +9d to +335d.

The distinctive features of SNII, the HI Balmer lines, dominate the spectrum of SN 1996L at phase +9d. At this epoch, the spectrum shows a very blue continuum (Tbb K with the adopted reddening). The Balmer lines have two components, a relatively broad emission and a superposed narrow component. As in SN 1994aj, the Balmer lines never show any evidence of broad P-Cygni absorption. Generally this is attributed to the fact that net H emission caused by the collisional excitation of H [Branch et al. 1981] obliterates the P-Cygni absorption originating from the redistribution of the photospheric continuum. This effect is usually strongest in H, because of the lower energy required compared, for instance, to H, and because of the larger optical depth of this line. In the case of SN 1996L, however, H, H, and H do not show broad P-Cygni absorptions either. As for other SNII, we believe that the narrow component arises from the CSM excited by the hard UV and X–ray flash emitted at shock break-out.
| phase | H | H | H | HeINaID | |||||||||
|---|---|---|---|---|---|---|---|---|---|---|---|---|---|
| (days) | Broad | (Em)n | (Ab)n | Broad | (Em)n | (Ab)n | Broad | (Em)n | (Ab)n | broad | |||
| (Å) | 6779.5 | 6783 | 5024 | 5028 | 4497: | 4487 | 6076: | ||||||
| +9 | FWHM (Å) | 80 | 19 | 44 | 18 | 50: | 16 | 48: | |||||
| ∗ | 26 | 18 | 12 | 10 | 6: | 4 | 6: | ||||||
| (Å) | 6789.5 | 6780 | 5069 | 5025 | 5004: | 4495 | 4473 | 6110 | |||||
| +34 | FWHM (Å) | 133 | 18 | 80 | 95 | ||||||||
| ∗ | 56 | 15 | 8.5 | 4.8 | 0.6 | 1.8 | 0.7 | 18 | |||||
| (Å) | 6786 | 6781 | 6765 | 5031 | 5007 | ||||||||
| +44 | FWHM (Å) | 150 | |||||||||||
| ∗ | 55.5 | 6.5 | 2.4 | 3.4: | 0.6: | ||||||||
| (Å) | 6777 | 6779 | 6764 | 5049 | 5031 | 5013 | 6095 | ||||||
| +61 | FWHM (Å) | 135 | 15 | 13 | 55 | 54 | |||||||
| ∗ | 32 | 2.8 | 1.6 | 5.0 | 1.0 | 0.6 | 5 | ||||||
| (Å) | 6781 | 6787 | 6091 | ||||||||||
| +270 | FWHM (Å) | 83 | 16 | 32 | |||||||||
| ∗ | 12 | 1.5 | 2.0 | ||||||||||
| (Å) | 6782 | 6787 | 5026: | 6091 | |||||||||
| +335 | FWHM (Å) | 83 | 21 | 17 | 35 | ||||||||
| ∗ | 4.0 | 0.6 | 0.7 |
Flux is in units of erg s-1 cm
As time progresses the spectrum of the SN becomes rapidly cooler, and the narrow H emission develops an absorption component, until two months after maximum it displays a symmetric P-Cygni profile (cf. Sect. 3).
In Fig. 4 we compare the spectrum of SN 1996L at a phase +61d with that of SN 1994aj at a phase +51d. The spectra are very similar to one another, suggesting that the presupernova histories of the two objects were analogous. The greatest difference is the lack of the broad NaID absorption in the spectrum of SN 1996L.
The FeII and TiII lines show the usual P-Cygni profiles, from which an expansion velocity of about 1700 km s-1is derived. This is smaller than the velocity derived for SN 1994aj (about 2500 km s-1).
About one year after maximum H was still the dominant feature in the spectrum of SN 1996L. As in SN 1994aj, forbidden lines are very weak (CaII] 7291-7323 Å), or absent. However, unlike SN 1994aj, the spectra of SN 1996L at phases 270 and 335 days show emission lines of HeI 5015, 5876 (blended with NaID), 6678, and 7065 Å. The expansion velocity deduced from the FWHM of the HeI lines is about 1700 km s-1. The 7065 Å line is remarkable for its strength when compared to other HeI lines such as 5876 which, according to recombination theory, should be stronger.

3 H profile and flux evolution
It is interesting to study the evolution of the H line. Figure 5 shows an enlargement of the spectra of SN 1996L and Table 4 reports the main line parameters derived from multiple Gaussian fitting (using the ALICE package in MIDAS).
The H profile at 9d consists of a broad, symmetric emission component ( km s-1) and a narrow emission superposed to it and centred at the same wavelength which is barely resolved ( km s-1, after correction for instrumental resolution). The profiles of H and H are similar to that of H.
The H profile undergoes major modifications with time. The broad component becomes progressively broader, until at phase 61d it reaches a km s-1. Because of the high S/N ratio of this spectrum, a small asymmetry in the broad component is revealed. The red-wing zero intensity velocity of km s-1 is in fact somewhat larger than the corresponding blue-wing velocity, km s-1. Such an asymmetry, which was also observed in SN 1994aj at a similar phase, could be explained if the scattering optical depth of H photons is significant. Electron scattering is most probably responsible for this large optical depth. The expansion velocity on SN 1996L is smaller than in SN 1994aj and the H asymmetry is less pronounced. Also, the narrow emission becomes more and more asymmetric with time, and between phases 44d and 61d it turns into a P-Cygni profile (the intensity of the absorption being similar to that of the emission). The blue wing of the absorption indicates a maximum velocity of km s-1, whereas the minimum of the trough corresponds to km s-1, which is comparable to the velocity of the CSM emission lines at early phases. The profile of the narrow component is very similar to that of SN 1994aj (see Fig. 4), but slightly narrower: the velocities in SN 1994aj were 2000 km s-1for the blue wing and 900 km s-1for the minimum of the absorption (Paper I).
It is noteworthy that a narrow P-Cygni feature appears also in H. Although the S/N is not good enough to analyze the profile of H in detail, the expansion velocity is consistent with that of H.
As for SN 1994aj, we believe that the narrow component originates in the CSM, which is excited by the hard radiation emitted at shock break-out. The CSM is probably the result of a strong wind episode taking place in the SN progenitor some time before the explosion.
When we recovered the SN, at phase 270d, the narrow feature had lost its P-Cygni profile and consisted of an unresolved emission line of much lower intensity. The FWHM of the broad emission had decreased to a velocity of km s-1. By this time we suggest that the bulk of the interaction between the SN ejecta and the CSM, which started about 100 days after maximum (see Sec. 2.1), is over. This is also suggested by the R and H light curves (see below). At these phases the H profile is quite different from that of SN 1994aj at similar phases. In SN 1994aj the broad component had a flat-top profile, which is the signature of a shell, interspersed with narrow absorptions (see Paper I).

In Fig. 6 we show the absolute H light curve of SN 1996L (see also Tab. 4) and compare it with those of the type II-L SNe 1994aj, 1990K and 1980K. The H flux in SN 1996L reached a maximum around phase +34 days, during the line broadening phase, when the narrow component consisted only of pure emission. The H luminosity of SN 1996L is similar to that of SN 1994aj up to about 50 days after maximum, but at later phases SN 1996L declines much more rapidly.

4 Discussion
In the previous sections we have seen that SN 1996L shares many of the properties of another SNII with a double P-Cygni profile, SN 1994aj, which was discussed in Paper I. Since SN 1996L was discovered soon after maximum it was possible to follow the evolution of the strong narrow H emission into a P-Cygni shaped line and then its progressive disappearance. We believe that the narrow Balmer emission lines are produced by the recombination of the CSM ionized by the UV and X-ray flash emitted at shock break-out. This is the same mechanism as for the narrow lines observed in SN 1993J in the first few days after the explosion [Benetti et al. 1994]. The emission intensity in SN 1996L is two orders of magnitude larger but coronal lines of [FeX] and [FeXIV] were visible in SN 1993J while they are not in SN 1996L. When the recombination is sufficient for the Sobolev optical depth of H in the slow-moving CSM shell to be significant (typically values larger than one are required in at least some velocity shells), the shell can scatter the continuum radiation and the emission line takes on a P-Cygni profile. In SN 1996L this happened about 50 days after maximum. It should be noted that for significant recombination to occur on this time scale the density of the CSM must be relatively high, .
The P-Cygni profile is narrow because the CSM has a low velocity. The velocity of the most highly ionized gas as measured in the early emission lines ( km s-1), is similar to that of the minimum of the P-Cygni profile ( km s-1), suggesting that both features originate in the same location.
The early light curve of SN 1996L shows the fast decline typical of SNe II-L, which is indicative of a small envelope mass at the time of explosion. This is thought to be the result of large mass loss during the evolution of the progenitor which is also the origin of the dense CSM.
About three months after maximum, when other SNII enter the so-called radioactive tail with a decline rate of about mag (100d)-1 [Turatto et al. 1990], the decline of the light curve of SN 1996L suddenly slows down, to a rate of ( mag (100d)-1). Since this is much slower than the 56Co decay rate, an additional energy input is clearly required to power the light curve. In analogy with the case of SN 1994aj (Paper I), we propose that the extra energy comes from the interaction of the SN ejecta with the dense CSM. At around 300 days the decline rate increases again ( mag (100d)-1), suggesting that at this epoch the ejecta has swept away most of the circumstellar shell and that the bulk of the interaction is over. After this sharp decline marking the end of the interaction phase, the light curve should finally settle on the radioactive tail, but because of the distance of the SN this last transition was not observable.
Given the maximum expansion velocity of the ejecta (6900 km s-1), and assuming that the interaction began on day 100, an inner radius of cm is derived for the pre-SN wind. If the wind velocity was 700 km s-1, as derived from the width of the narrow lines, this means that the strong wind episode terminated about 3 years before the explosion. If the bulk of the interaction ended at a phase of about 300 days, the outer edge of the wind has a radius cm. This implies that the strong wind episode lasted about 6 years. If we assume that the wind was steady, with constant mass loss rate and terminal outflow velocity , and thus produced an density profile, we can obtain a lower limit for the mass in the CS shell (see Paper I):
This is an order of magnitude smaller then the estimated mass of the CS shell in SN 1994aj (Paper I).
If we assume that the mass loss was constant for a period of about 6 years, we obtain a mass loss rate of M⊙/yr for SN 1996L.
We can also obtain a rough estimate of the wind density and the mass loss rate from the observed H luminosity during the interaction phase using the expression
where is the efficiency with which the kinetic energy is converted into H radiation, is the mass loss rate in M⊙/yr, the wind velocity and the velocity at the CSM-wind contact discontinuity. The value of is not well known, but it should be of the order of [Chugai 1990]. If we adopt for SN 1996L a mean value of km s-1for , then from L(H)=4.47 erg s-1 we obtain g/cm, which is half the value obtained in Paper I for SN 1994aj. Since the velocity of the CS shell of SN 1996L is about 700 km s-1, then the mass loss rate should be M⊙/yr. This is roughly consistent with the value derived above.
Fig. 6 shows that after day 30 the H luminosity of SN 1996L is significantly smaller than that of SN 1994aj. After day 270, the H luminosity decline of SN 1996L is comparable to the H light curves computed by Chugai (Patat et al. 1995; Chugai, 1998, private communication) assuming that H at late times is powered only by the radioactive decay of Co to Fe. A comparison of the models with the observations in the first 2-3 months, before the beginning of the interaction phase, suggests that the ejecta mass is M⊙, and most likely M⊙. The last two H points appear to follow a model for an ejecta mass in excess of 5 M⊙, but they are probably still affected by the interaction. Observations at later epochs, which are beyond the limits of 4-m class telescopes, would be necessary to establish conclusively the mass of the ejecta.
Another interesting difference between SN 1996L and SN 1994aj is that strong He lines are present in the spectra of SN 1996L at late phases. In our last spectrum the ratio of the 5876 and the 7065Å line is . This is only an upper limit because the 5876Å line could be blended with the NaID lines. Since in LTE conditions the ratio should be 5, and the temperature at such epochs is too low for He to be photoionized, non–thermal excitation could be responsible for the very non-LTE conditions which must be invoked to explain both the presence of the HeI lines and their unusual ratios.
We remarked above that at about 300 days the ejecta-CSM interaction is essentially over. Therefore, the most probable cause of these non-LTE effects could be the mixing in the He mantle of radioactive material synthesized in the explosion, mainly 56Ni which decays into 56Co. 56Ni dredge-up has been already seen in other SNII, e.g. SN 1987A [Graham 1988], and SN 1995V [Fassia et al. 1998]. Since the envelope mass of SN 1996L is probably very small, at 300 days the envelope should be sufficiently thin that inner regions are exposed. Moreover, the ratio of the strengths of the broad H component and of HeI 6678 Å is sensitive mostly to the He abundance. At phase +335d this ratio is about 10, which is much smaller than the normal ratio of about 100 which occurs for a normal He abundance. This finding reinforces the hypothesis that by this time we are seeing deep into the SN ejecta, near the He-rich envelope. This hypothesis is supported by the fact that the He lines are broader (1700 km s-1) than the CS shell lines (FWHM km s-1), but narrower than those from the shocked ejecta (FWHM km s-1). Therefore the He lines could arise from the inner, slower ejecta.
5 Conclusions
The observations presented in this paper demonstrate that SN 1996L belongs to the newly defined class of type IId SNe, whose prototype is SN 1994aj. SNIId are characterized by showing signatures of an interaction between the SN ejecta and CSM ejected by the progenitor star. The interaction starts a few months after the explosion.
Another common property of SNIId is that, in spite of the considerable CSM mass detected around these objects and the implied large mass loss prior to explosion, the [OI] 6300-6364 Å lines are not detected. This strongly suggests that the progenitors of these supernovae had main sequence masses smaller than M⊙ [Chugai & Danziger 1994].
Interacting SNII show a wide range of properties, as summarized in a recent
paper by Chugai [Chugai 1997].
The two main parameters defining the observed phenomena are the pre-SN mass
loss rate and the wind characteristics (uniform or clumpy).
Interacting SNe include SNe IIn, SN 1979C and other SNe II-L recovered long
after the explosion (such as SN 1980K).
Along this sequence the explosions appear to have occurred in a increasingly
less dense CSM, suggesting a trend towards smaller mass loss rates by the
progenitor stars [Chugai 1997].
In particular, Type IIn supernovae (called IIdw in Chugai’s paper) are
thought to occur inside a dense wind ( M⊙/yr,
where is the wind velocity in units of 10 km s-1).
The wind can be either clumpy (eg. SN 1988Z) or uniform (eg. SN 1987F).
Interaction masks the thermal emission from the ejecta.
Less extreme cases are those of SN 1979C, whose pre-SN wind was uniformly
distributed and had a mass loss rate of
M⊙/yr,
or SN 1980K where the wind has only a moderate density,
M⊙/yr.
Additional parameters seem to be required to describe the wide range of properties displayed by the class of SN IId, which are the epoch and the duration of the last strong wind episode, relative to the time of explosion.
If the pre-SN wind lasted for many years and continued almost until explosion, the interaction starts soon after the SN event and outshines the SN itself, giving rise to a SNIIn. If on the other hand the pre-SN wind episode ends a few years before the explosion, then the supernova is of type IId and has the properties described in this paper for SN 1996L. Finally, if the pre-SN wind ended more than about a hundred years before the explosion, the material in the wind shell is so diluted by the time the SN ejecta can reach it that the observable signatures of the interaction are very weak and may not be detected as is the case for some SNII-L and for SNII-P.
ACKNOWLEDGMENTS We are grateful N.N. Chugai for communicating his Hlight curve results prior to publication. SB would also like to thank R. Terlevich for stimulating discussions.
References
- [Benetti et al. 1994] Benetti, S., Patat, F., Turatto, M., Contarini, G., Gratton, R., Cappellaro, E., 1994, A&A, 285, L13
- [Benetti et al. 1996] Benetti, S., Barthel, P., de Vries, W., 1996, IAUC 6346
- [Benetti et al. 1997] Benetti, S., Cappellaro, E., Danziger, I.J., Turatto, M., Patat, F. Della Valle, M., 1997, MNRAS., in press (Paper I)
- [Branch et al. 1981] Branch, D., Falk, S.W., McCall, M.L., Rybski, P., Uomoto, A.K., Wills, B.J., 1981, ApJ 244, 780
- [Burstein & Heiles 1984] Burstein, D., Heiles, C., 1984, ApJS 54, 33
- [Cappellaro et al. 1995a] Cappellaro, E., Danziger, I.J., Turatto, M., 1995a, MNRAS 277, 106
- [Cappellaro et al. 1995b] Cappellaro, E., Danziger, I.J., Della Valle, M., Gouiffes, C., Turatto, M., 1995b, A&A 293, 723
- [Chugai 1990] Chugai, N.N., 1990, SA 16, L457 AJ 111, 1286
- [Chugai 1997] Chugai, N.N., 1997, Astronomy Reports, 41, 672
- [Chugai & Danziger 1994] Chugai, N.N., Danziger I.J., 1994, MNRAS 268, 173
- [Fassia et al. 1998] Fassia, A., Meikle, W.P.S., Geballe, T.R., Walton, N.A., Pollacco, D.L., Rutten, R.G.M., Tinney, C., 1998, MNRAS 299, 150
- [Graham 1988] Graham, J.R., ApJ 335, L53
- [McNaught 1996] McNaught, R.H., 1996, IAUC 6346
- [Patat et al. 1993] Patat, F., Barbon, R., Cappellaro, R., Turatto, M., 1993, A&A 282, 731
- [Patat et al. 1995] Patat, F., Chugai, N., Mazzali, P.A., 1995, A&A 299, 715
- [Terlevich 1994] Terlevich, R.J., 1994, Circumstellar Media in the Late Stages of Stellar Evolution eds. R.E.S. Clegg, I.R. Stevens, W.P.S. Meikle, Cambridge Univ. Press, Cambridge, p. 153
- [Turatto et al. 1990] Turatto, M., Cappellaro, E., Barbon, R., Della Valle, M., Rosino,L., 1990, AJ 100, 771
- [Turatto et al. 1993] Turatto, M., Cappellaro, E., Danziger, J., Benetti, S., Gouiffes, C., Della Valle, M., 1993, MNRAS 262, 128
- [Turatto et al. 1997] Turatto, M., Benetti, S., Cappellaro, E., Danziger, I.J., Mazzali, P.A., 1997, in SN 1987A: Ten years After, Fifth CTIO/ESO/LCO Workshop, eds. Phillip, M.M. and Suntzeff, N.B., in press
- [Uomoto & Kirshner 1986] Uomoto, A., Kirshner, R.P., 1986, ApJ 308, 685