The mass of X-Ray Nova Scorpii 1994 (=GRO J1655–40)
Abstract
We have obtained high and intermediate resolution optical spectra of the black-hole candidate Nova Sco 1994 in May/June 1998, when the source was in complete (X-ray) quiescence. We measure the radial velocity curve of the secondary star and obtain a semi-amplitude of =215.52.4 km s-1, which is 6 per cent lower than the only previously determined value. This new value for thus reduces the binary mass function to = 2.730.09 . Using only the high resolution spectra we constrain the rotational broadening of the secondary star, , to lie in the range 82.9–94.9 km s-1(95 per cent confidence) and thus constrain the binary mass ratio to lie in the range 0.337–0.436 (95 per cent confidence). We can also combine our results with published limits for the binary inclination to constrain the mass of the compact object and secondary star to the ranges 5.5 – 7.9 and 1.7 – 3.3 respectively (95 per cent confidence). Finally, we report on the detection of the Lithium resonance line at 6707.8Å, with an equivalent width of 558 mÅ.
keywords:
accretion, accretion discs – binaries: close – stars: individual: X-Ray Nova Sco 1994 (GRO J1655–40) – X-rays: stars.1 Introduction
The soft X-ray transient, Nova Sco 1994 (=GRO J1655–40) has been studied extensively over the past 3 years in X-rays and at optical wavelengths [Tingay et al. 1995, Bailyn et al. 1995a, Harmon et al., 1995, Hjellming & Rupen 1995, Bailyn et al. 1995b, Paciesas et al. 1996, van der Hooft et al., 1997, van der Hooft et al., 1998 (hereafter vdH98)]. Strong evidence that the compact object in GRO J1655-40 is a black hole was presented by Bailyn et al. (1995b) who initially established a spectroscopic period of days, and determined a mass function . An improved value of was presented by Orosz & Bailyn (1997; hereafter OB), who measured the radial velocity semi-amplitude of the secondary star to be km s-1and classified it as an F2–F6 type star. Both vdH98 and OB analyzed their quiescent optical light curves of Nova Sco 1994 which they combined with the OB value for to show that the black hole has a mass () in the range 6.29–7.60 .
However, in calculating the radial velocity semi-amplitude, OB used both quiescent data (taken in 1996 February 24–25) and outburst data (taken in 1995 April 30–May 4). Using outburst data in this way can lead to an incorrect result as substantial X-ray heating of the secondary star shifts the ‘effective centre’ of mass of the star (see Wade & Horne 1988 and Phillips, Shahbaz & Podsiadlowski 1998). This results in a significant distortion of the radial velocity curve and hence a spuriously high velocity semi-amplitude. The masses of the binary components derived from this will therefore be incorrect.
In this paper we determine the radial velocity curve of the secondary star in Nova Sco 1994 using only data taken when the system was in quiescence. From our high resolution spectroscopy we determine the rotational broadening of the secondary star, which, when combined with the new value for the mass function and limits to the binary inclination (vdH98). allows us to determine more precisely the individual component masses.
| Date | Exp. time | Resolution | Wavelength range |
|---|---|---|---|
| 29/5/1998 | 121800s | 0.83 Å | 6131–6764 Å |
| 30/5/1998 | 21800s | 4.2 Å | 4452–7015 Å |
| 31/5/1998 | 21800s | 4.2 Å | 4452–7015 Å |
| 2/6/1998 | 131800s | 0.83 Å | 6131–6764 Å |
2 Observations and Data Reduction
Intermediate and high resolution optical spectra of Nova Sco 1994 were obtained on 1998 May 28, 29, 30 and June 1 with the 3.5-m New Technology Telescope (NTT) at the European Southern Observatory (ESO) in Chile using the ESO Multi Mode Instrument (EMMI). We used the red arm with an order-separating OG 530 filter and gratings #6 and #8 which gave dispersions of 0.31 Å per pixel and 1.26 Å per pixel respectively (see Table 1). The TEK 20482048 CCD was used, binned with a factor two in the spatial direction in order to reduce the readout noise. The dispersion direction was not binned. Very good seeing allowed us to use a slit width of which resulted in spectral resolutions of 0.83 Åand 4.2 Å for the gratings #6 and #8 respectively (see Table 1). Cu-Ar arc spectra were taken for wavelength calibration. Template field stars of a variety of spectral types were also observed with intrinsic rotational broadening much less than the resolution of our high resolution data.
The data reduction and analysis was performed using the Starlink figaro package, the pamela routines of K. Horne and the molly package of T. R. Marsh. Removal of the individual bias signal was achieved through subtraction of the mean overscan level on each frame. Small scale pixel-to-pixel sensitivity variations were removed with a flat-field frame prepared from observations of a tungsten lamp. One-dimensional spectra were extracted using the optimal-extraction algorithm of Horne (1986), and calibration of the wavelength scale was achieved using 5th order polynomial fits which gave an rms scatter of 0.02 Å. The stability of the final calibration was verified with the OH sky line at 6562.8Å whose position was accurate to within 0.1 Å.
| Parameter | NTT (this paper) | NTT + CTIO (OB) |
|---|---|---|
| Orbital period∗ (days) | 2.62168 | 2.62168 |
| T (HJD 2,440,000+) | 9838.4198 | 9838.4198 |
| velocity (km s-1) | 215.5 2.4 | 233.3 4.9 |
| velocity (km s-1) | 141.9 1.3 | 142.4 2.9 |
| phase shift | 0.05 0.003 | 0.03 0.005 |
| 0.99 | 4.9 | |
| () | 2.73 0.09 | 3.46 0.22 |
∗Taken from van der Hooft et al. (1998) and fixed.
1- uncertainties are given, see text.
3 The radial velocity of the companion star
Our first task was to measure the radial velocity of the F-type secondary star. The radial velocities were measured from the spectra by the method of cross-correlation (Tonry & Davis 1979) with a template star. Prior to cross-correlation the spectra were interpolated onto a logarithmic wavelength scale (pixel size 14.5 km s-1) using a interpolation scheme to minimize data smoothing (Stover et al. 1980), and then normalised. We masked the interstellar feature at 6280 Å and H before correlating the spectra. We used HR2927 as our template star after we had broadened it by 90 km s-1in order to simulate the spectrum of Nova Sco 1994 (a more accurate value for the rotational broadening is derived in the next section). The radial velocity of the template star (derived using the position of the H absorption line to be 6.7 km s-1) was then added to the radial velocities of Nova Sco 1994.
Using the orbital ephemeris given by vdH98 we phase-folded the heliocentric radial velocities and then fitted a sine wave (see Table 2 and Figure 1), obtaining a of 0.99. We then combined the data with the quiescent radial velocity data of OB and repeated the fitting procedure obtaining a significantly worse value of =4.9. Note that our high resolution data has a factor of 4 better spectral resolution than that of OB; the uncertainty in our individual radial velocity measurements being typically 6 km s-1.
| Name | Sp. Type | ||
|---|---|---|---|
| HR3325 | F4 | 2.5 | 0.99 |
| HR2927 | F6 | 1.7 | 0.98 |
| HR870 | F7 | 2.2 | 0.99 |
| HR9046 | F8 | 3.1 | 0.94 |
| HR9057 | F8 | 2.3 | 0.96 |
| HR6192 | G3 | 2.6 | 0.82 |
| HR7864 | G5 | 3.2 | 0.88 |
| HR7281 | G8 | 4.4 | 0.62 |
4 The spectral type and rotational broadening of the companion star
We determine the spectral type of the companion star by minimizing the residuals after subtracting different template star spectra from the Doppler-corrected average spectrum. This method is sensitive to the rotational broadening and the fractional contribution of the companion star to the total flux. The template stars we use are in the spectral range F0–F8, – and were obtained during this observing run but also from previous runs at La Palma and with comparable dispersion.
First we determined the velocity shift of the individual high resolution spectra of Nova Sco 1994 with respect to each template star spectrum, then Doppler-averaged to the rest frame of the template star (see section 3). In order to determine the rotational broadening, , we follow the procedure described by Marsh, Robinson & Wood (1994). Basically we subtracted a constant, , representing the fraction of light from the template star, multiplied by a rotationally broadened version of that template star. The optimal values of and are obtained by minimising (see Table 3). The above analysis was performed in the spectral ranges 6380–6520 Å and 6600–6750 Å which excludes H. This was the only region common to all the templates stars and the high resolution spectra of Nova Sco 1994. We used a linear limb-darkening coefficient of 0.52 (Al-Naimiy 1978) appropriate for 6500 Å and an effective temperature of 6500 K (typical for a F star). Figure 3 shows the results for those templates with . It should be noted that the main sequence template stars all gave , as also found by OB. From Table 3 it can be seen that the minimum occurs at spectral type F6 with a of 91.23.7 km s-1. The 90 per cent confidence levels shown were obtained using a Monte Carlo simulation (see section 5 for details), after the of the fit was multiplied by a scaling factor so that the was 1 (Lampton et al. 1976).
| Limb darkening | (=) | |
|---|---|---|
| coefficient () | (km s-1) | |
| 0.00 | 86.5 (3.3, 3.6) | 0.360 (0.028, 0.033) |
| 0.52 | 91.2 (3.7, 3.7) | 0.400 (0.036, 0.030) |
The analysis above assumes that the limb-darkening coefficient appropriate for the radiation in the line is the same as for the continuum. However, in reality this is not the case; the absorption lines in early-type stars will have core limb-darkening coefficients much less than that appropriate for the continuum (Collins & Truax 1995). In order to determine the extreme limits for we also repeated the above analysis for the F6 template star using zero limb-darkening and found =86 km s-1(90 per cent confidence). We thus constrain to lie in the range 82.9–94.9 km s-1(95 per cent confidence; since we have two one-tailed distributions representing the upper and lower limits).
As can be seen from Figure 3 (top) the determination of the spectral type depends critically on the choice of template spectral type and luminosity class. Even if we had many template stars we would find that using stars of the nominally same spectral class and type would give differing results. In Figure 3 we also show a fit to the data; this is what would be expected if there were no systematic effects.
In order to estimate this systematic effect in our analysis of Nova Sco 1994 we performed a Monte Carlo simulation involving the same analysis but now using a a template star of known spectral type (F5; HR870) as the target. To this target we added noise to produce a spectrum of comparable quality to our Doppler-averaged Nova Sco 1994 spectrum. We then repeated the broadening and optimal subtraction procedure using the same 21 templates star as was used for the Nova Sco 1994 analysis, thereby determining the best fit. We found that we could determine the spectral type of the trial template star to within 1 sub-class. Figure 3 (bottom) shows a single simulation; note the systematic effects, i.e. the scatter within each spectral type bin.
5 The binary system parameters
Since the companion star fills its Roche lobe and is synchronised with the binary motion, the rotational broadening provides a direct measurement of the binary mass ratio, (=/), through the expression ] (Horne, Wade & Szkody 1986). Substituting our values for and we calculate (see Table 4). In order to determine the uncertainty in we used a Monte Carlo simulation, in which we draw random values for the observed quantities which follow a given distribution, with mean and variance the same as the observed values. For the random distribution to taken to be Gaussian as the uncertainty is symmetric about the mean value. However for the uncertainty is asymmetric and so we had to determine the actual distribution numerically. This was done by first calculating the maximum likelihood distribution using the actual fit values (after rescaling the values so that the was 1) and then determining the cumulative probability distribution. By picking random values (from a uniform distribution) for the probability we obtain random values for . Given the uncertainty in the limb darkening coefficient and hence , we find to lie in the range 0.337 – 0.436 (95 per cent confidence).
Using our values for and with the orbital period, , and the binary inclination, , we can determine the masses of the compact object, and the companion, star using . The binary inclination is given by vdH98, and lies in the range 63.7∘ and 70.7∘. It should be noted that the solutions for the binary inclination and hence binary masses, determined by vdH98 depend on the flaring angle of the accretion disc. Here we use the range for the binary inclination which encompasses the range of flaring disc angles assumed by vdH98. Table 5 shows the values we obtain for the masses which depend on the limb-darkening coefficient used to determine and the binary inclination. The 90 per cent confidence level was determined using a Monte Carlo simulation (see Figure 4) similar to that described above. Given the uncertainties in the limb-darkening coefficient (and thus in and ) and the binary inclination, we find and to lie in the range 5.5 – 7.9 and 1.7 – 3.3 respectively (95 per cent confidence).
By modelling the optical light curves of Nova Sco 1994 vdH98 and OB have also determined . They find to lie in the range 0.24–0.42 (3-) and 0.289–0.385 (3-) respectively. (However, it should be noted that the errors given by OB are only internal statistical errors, whereas the analysis of vdH98 includes the systematic uncertainties.) Using optical spectroscopy (see section 5), we find to lie in the range 0.337–0.436 (95 per cent confidence). Also from optical spectroscopy, the projected radial velocity semi-amplitude for the compact object has been determined by Soria et al., (1998) to be 76.27.5 km s-1. We can use this along with our value for (see section 3) to determine ; =0.3540.035 (1-). As one can see, the four independent measurements for above are fully consistent with each other. This consistency is also seen in the determination of the binary inclination; van der Hooft 1997, vdH98, and OB determine values for which are all also consistent with each other.
| Limb darkening | Inclination | ||
|---|---|---|---|
| coefficient (u) | () | () | |
| 0.00 | 63.7 | 6.4–7.4 | 2.0–2.8 |
| 0.52 | 63.7 | 6.8–7.9 | 2.4–3.3 |
| 0.00 | 70.7 | 5.5–6.3 | 1.7–2.4 |
| 0.52 | 70.7 | 5.8–6.7 | 2.1–2.9 |
6 The detection of lithium?
High lithium abundances appear to be a common feature of late-type secondary stars in neutron stars and black hole SXTs, a result with is totally unexpected given the post-main sequence dilution and the mass transfer history of these stars (Martín et al., 1994). In order to counteract the depletion of lithium, caused by convective mixing, it is necessary to invoke a process to produce lithium. Several mechanisms have been put forward to explain the high lithium abundance in the neutron star and black hole SXTs; lithium synthesis in the supernova explosion that formed the compact object (Woosley et al., 1990), or reactions during the strong SXT outbursts (Martín et al., 1994).
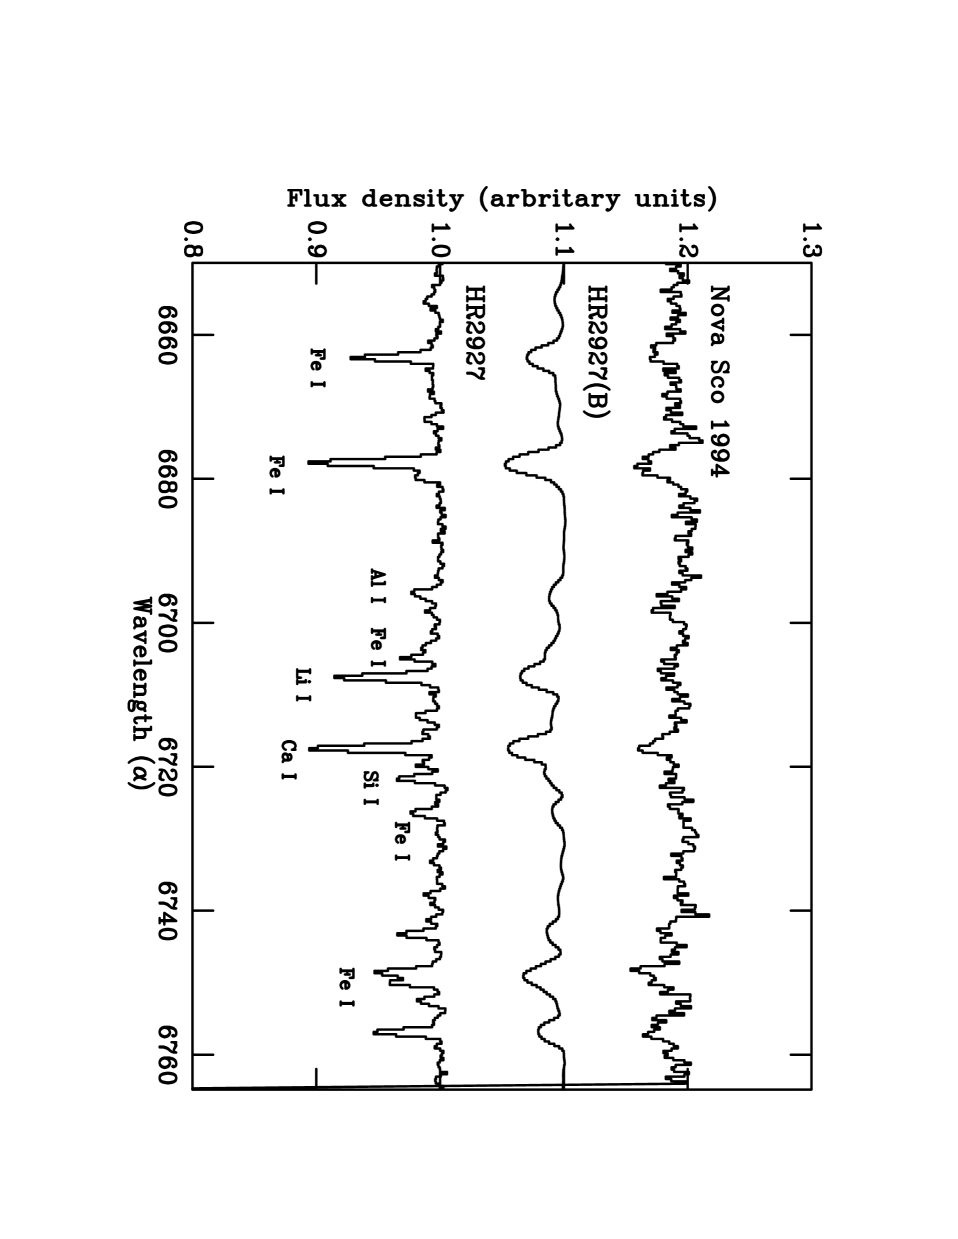
We can use the ratio of Li Ca equivalent width (=RLi/Ca), which is not sensitive to veiling for deriving upper limits to the surface Li abundance (see Figure 5). For the other SXTs A0620-00, V404 Cyg and Cen X–4 RLi/Ca has been found to be 1 (Martín et al., 1994); for Nova Sco 1994 we find RLi/Ca=0.480.08. The equivalent widths of Li and Ca are 558 mÅ and 11410 mÅ rrespectively.
The interpretation of the lithium abundance in Nova Sco 1994 is somewhat difficult. The secondary stars in SXTs are tidally locked and therefore have high rotational velocities, hence, convective depletion may be inhibited by reducing the angular momentum transport in the base of the convection zone. One might expect there to be a correlation between rotation rate and lithium abundance (Pallavicini, Cerruti-Sola & Duncan 1987), since convective mixing may cause additional depletion if lithium is taken to layers where it can be burnt. However, the link between rotation and lithium in subgiant stars is not yet well established; de Medeiros, do Nascimento Jr & Mayor (1997) have found that the lithium abundance is independent of rotational velocity. Indeed the sample tabulated by Balachandran (1990) shows a remarkable range of lithium equivalent width (2–100 mÅ) within F6 stars but there is no correlation with rotational velocity. Thus it is difficult to compare the actual lithium equivalent width in Nova Sco 1994 with that in “normal” F6 stars, such as our template star HR2927 in Fig. 5. All we can say is that we have detected lithium in Nova Sco 1994, but whether it is intrinsic to the secondary star remains unclear. Spallation appears to be the most obvious mechanism as it is the most probable cause of the high Li abundance seen in other SXT, but in Nova Sco 1994 mechanisms related to the spectral type, luminosity of the star and magnetic braking have to be considered as well.
7 Discussion
From Figure 2 it can be seen that after removal of the secondary star from the average spectrum of Nova Sco 1994, there is narrow residual emission (EW=10.00.5Å; FWHM=146 km s-1) which could be either due to chromospheric activity on the secondary star, and/or X-ray heating on the inner face or emission from the bright spot. H emission arising from the quiescent accretion discs in SXTs usually have a FWHM of a few thousand km s-1; the residual feature we see has a FWHM of only a few hundred km s-1(e.g. Casares et al., 1997), so it must arise from regions on the secondary star or the outer edge of the accretion disc (Marsh et al,, 1994). Our data do not have sufficient phase resolution to allow us to distinguish between the above possibilities; only a detailed phase-resolved radial velocity study of the narrow component will solve its origin.
However, it is interesting to note that the narrow emission can be powered solely by X-ray heating. An upper limit to the X-ray flux on Nova Sco 1994 is set by ASM observations at erg cm2 s-1. The X-ray irradiation at the secondary star would then be erg cm2 s-1, where we have used a distance of 3.2 kpc (Hjellming & Rupen 1995) and a binary separation of 16.6 R⊙. At such levels the secondary would be receiving sufficient energy to power the narrow H emission.
In calculating the radial velocity semi-amplitude of the secondary star OB used both quiescent (1996 February 24–25) and outburst data (1995 April 30–May 4), and fitted the resulting curve with a sine wave. It has been known, especially in studies of dwarf novae (Wade & Horne 1988 and Davey & Smith 1992) that using outburst data in this way leads to incorrect results. The effect of substantial heating of the secondary causes the centre of light, given by the strength of the absorption lines, to shift from the centre of mass. This results in a significant distortion of the radial velocity curve leading to a spuriously high radial velocity semi-amplitude (Davey & Smith 1992). The binary masses derived from this will therefore be incorrect.
Phillips, Shahbaz & Podsiadlowski (1998) have estimated by fitting only the outburst radial velocity data of OB. They use a crude model based on X-ray heating of the secondary star and estimate to lie in the range 194–214 km s-1(90 per cent confidence), assuming =0.33. Note that this range compares well with our value of =215.52.4 km s-1obtained by fitting our high resolution radial velocity data of Nova Sco 1994 in complete quiescence. We therefore conclude that the masses of the Nova Sco 1994 system are somewhat lower than the OB value, but the compact object mass is still sufficiently high () to imply that it is a black hole system.
Acknowledgements
We would like to thank Jerry Orosz for providing the OB radial velocity data and Sam Phillips and Mark Seaborne for useful discussions.
References
- [1] Al-Naimiy H.M., 1978, Ap&SS, 53, 181
- [2] Bailyn C.D. et al., 1995a, Nat, 374, 701
- [3] Bailyn C.D., Orosz J.A., McClintock J.E., Remillard R.A., 1995b, Nat, 378, 157
- [4] Balachandran S., 1990, ApJ, 354, 310
- [5] Casares J., Martín E.L., Charles P.A., Molaro P., Rebolo R., 1997, NewA, 1, 299
- [6] Collins G.W., Truax R., 1995, ApJ, 439, 860
- [7] de Medeiros L.R., do Nascimento Jr, J.D., Mayor M., 1997, A&A, 317, 701
- [8] Davey S.C., Smith R.C., 1992, MNRAS, 257, 476
- [9] Horne, K., Marsh, T.R., 1986, MNRAS, 218, 761
- [10] Harmon B.A., et al. 1995, IAU Circ. 6205
- [11] Hjellming R.M., Rupen M.P., 1995, Nat. 375, 464
- [12] Horne K., 1986, PASP, 98, 609
- [13] Horne K., Wade R.A., Szkody P., 1986, MNRAS, 219, 791
- [14] Lampton M., Margon B., Bowyer S., 1976, ApJ, 208, 177
- [15] Martín E.L., Rebolo R., Casares J., Charles P.A., 1994, ApJ, 435, 791
- [16] Marsh T.R., Robinson E.L., Wood J.H., 1994, MNRAS, 266, 137
- [17] Orosz J.A., Bailyn C.D., 1997, ApJ, 477, 876 (OB)
- [18] Pallavicini R., Cerruti-Sola M., Duncan D.K., 1987, A&A, 174, 116
- [19] Paciesas W.S., et al, 1996, in Compact Stars in Binaries: IAU Symposium 165, eds E.P.J. van den Heuvel, J. van Paradijs & E. Kuulkers, Dordrecht, Kluwer Academic Publisheds, 363
- [20] Phillips S.N., Shahbaz T., Podsiadlowski Ph., 1998, MNRAS, in press
- [21] Soria R., Wickramasinghe D.T., Hunstead R.W., Wu K., 1998, ApJ, 495, L95
- [22] Stover, R.L., Robinson, E.L., Nather, R.E., Montemayer, T.J., 1980, ApJ, 240, 597
- [23] Tingay S.J., et al., Nat., 374, 141
- [24] Tonry, J., Davis, M., 1979, AJ, 84, 1511
- [25] van der Hooft F. et al., 1997, MNRAS, 286, L43
- [26] van der Hooft F F., Heemskerk M.H.M., Alberts F., van Paradijs J., 1998, A&A, 329, 538 (vdH98)
- [27] Wade R.A., Horne K., 1988, ApJ, 324, 411
- [28] Woosley S.E., Hartman R.D., Hoffman R.D., Haxton W.C., 1990, ApJ, 356, 272
- [29] Zhang S.N., Wilson C.A., Harmon B.A., Fishman G.J., Wilson P.B., Paciesas W.S., Scott M., Rubin B.C., 1994, IAU Circ 6046