Absorption Line Signatures of Gas in
Mini Dark Matter Halos
Abstract
Recent observations and theoretical calculations suggest that some QSO absorption line systems may be due to gas in small dark matter halos with circular velocities on the order of . Kepner, Babul & Spergel (1997) have shown that gas in these “mini-halos” can readily be in a multi-phase state. Additional observational evidence suggests that, in general, many absorption line systems may also be multi-phase in nature. Thus, computing the absorption lines of mini-halos, in addition to providing signatures of small halos, is a natural way to explore multi-phase behavior. The state of gas in mini-halos is strongly affected by the background UV radiation field. To address this issue a code was developed that includes many of the chemical and radiative processes found in CLOUDY and also incorporates spherically symmetric multi-wavelength radiative transfer of an isotropic field, non-equilibrium chemistry, heating, cooling and self-consistent quasi hydro-static equilibrium gas dynamics. With this code detailed simulations were conducted of gas in mini-halos using different types of background spectra: power-law, power-law + HeII break, Haardt & Madau (1996) and O star. From these simulations the absorption line signatures of the gas were computed and compared with a variety of observations: high redshift metal lines, He lines and low redshift metal line systems. Based on these results the mini-halo model absorption line signatures appear to be consistent with many current observations given a sufficiently soft spectrum. Thus, in any given instance it is difficult to either rule in or rule out a mini-halo, and in most cases additional data (e.g. optical counterparts or the lack thereof) or contextual information (e.g. evidence of significant star formation, which would disrupt gas in a mini-halo) is necessary to break this degeneracy. Finally, the mini-halo model is a useful tool for analyzing absorption line data in a multi-phase context and should become even more applicable as new space based observations become available.
1 Introduction
Quasar absorption lines due to metals are sensitive probes of physical conditions and chemical abundances. With current instrumentation they can be detected from = 0 to 4 and therefore can be used to track the chemical and physical evolution of galaxies and the intergalactic medium over most of the history of the universe. Metals are now routinely detected in all types of QSO absorption line systems with HI column densities ranging from to cm-2. Typically these absorption systems are analyzed using idealized single-phase photoionization models where the absorber is treated as a constant density plane-parallel slab illuminated from one side (e.g., Bergeron & Stasińska 1986; however, see Donahue & Shull 1991; Giroux, Sutherland & Shull 1994). Recently these models have considered rather detailed and realistic ionizing radiation fields including reprocessing of the radiation as it propagates through intervening absorption systems and intergalactic space (e.g., Giroux & Shull 1997; Khare & Ikeuchi 1997), but they still usually assume a single-phase medium. However, by analogy with the ISM in our own galaxy, it seems more probable that QSO absorption lines arise in multi-phase media, and there is observational evidence which suggests that this is indeed the case in some absorbers. For example, in some absorbers the single-phase slab models cannot reproduce all of the observed metal column densities (Giroux, Sutherland & Shull 1994; Petitjean, Riediger, & Rauch 1996; Tripp, Lu, & Savage 1997; Churchill & Charlton 1999). It is also readily apparent in some absorbers that high resolution profiles of low and high ionization stages do not have identical component structure in velocity space; some components are strong in high ion profiles and are weak or not detected in low ion profiles (see, e.g., Figures 2-21 in Lu et al. 1996). This suggests the presence of multiple absorbing phases similar to those observed in the Milky Way ISM. Not surprisingly, the densities are also not constant within a given absorber component; by observing common absorption lines toward closely-spaced images of a gravitationally lensed QSO, Rauch (1997a) has shown that the metal densities vary on the scale of a few hundred parsecs or less (see his Figure 5). Therefore it now seems worthwhile to consider more sophisticated photoionization models which allow for multiple absorbing phases and changing densities along the line of sight.
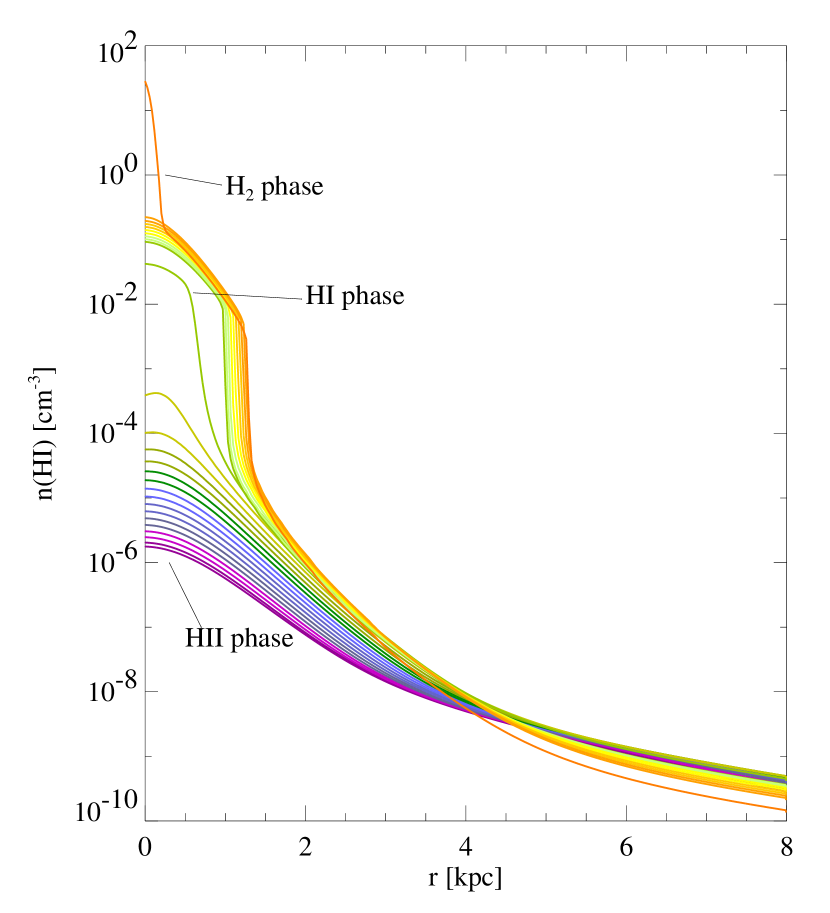
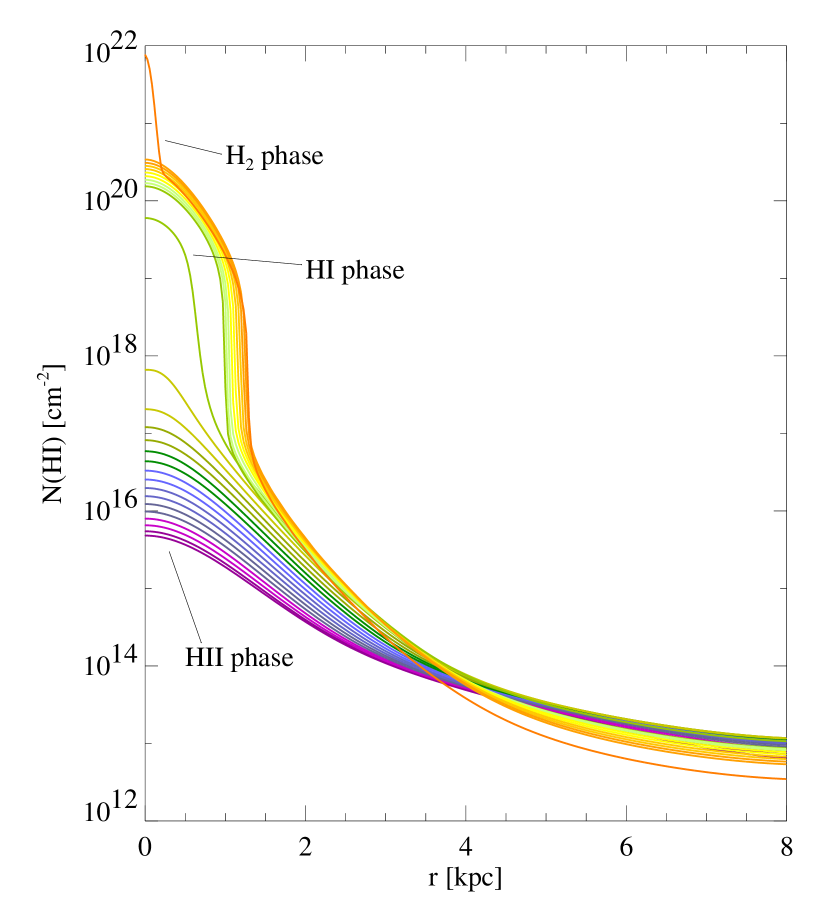
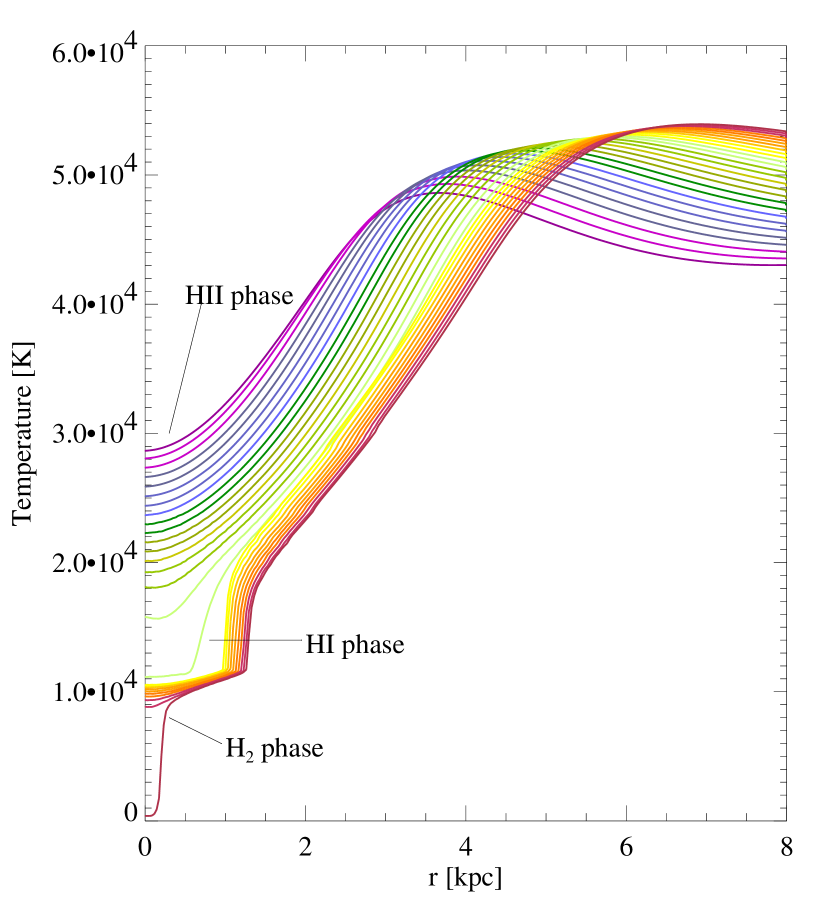
In this paper the absorption line signatures are calculated for gas in small dark matter halos (i.e., mini-halos) with small circular velocities ( 30 km s-1). Kepner, Babul & Spergel (1997) have shown that gas in this type of potential can be a multi-phase absorber with a core and an ionized envelope, and the character of the core depends on the intensity of the UV background radiation. As the intensity of the UV background decreases, the core passes through three stages characterized by the predominance of ionized, neutral, and molecular hydrogen (see Figures 1–3). The model includes full radiative transfer, gas dynamics, and non-equilibrium chemistry and produces physically self-consistent hydrostatic gas density and temperature radial profiles. Given the extragalactic UV background as input, the model can track the properties of the mini-halos from 4 to = 0. Since previous papers have shown the detailed dependencies of the metal line ratios on the assumed shape of the UV background (e.g., Giroux & Shull 1997; Songaila 1998), the primary goal of this paper is to explore the effects of the two-phase core-envelope structure on the metal ratios and to determine if mini-halos have any distinctive absorption signatures.
Observationally, there is evidence that the mini-halo model is a plausible model for some QSO absorbers. Abel & Mo (1998) have suggested that if density perturbations collapse to form mini-halos before reionization, then due to their high densities, the mini-halos will remain largely neutral when the UV background turns on resulting in a population of objects with N(HI) cm-2 which can explain the number density of Lyman limit (LL) absorbers observed at high redshifts. Likewise, the simulations of Bond & Wadsley (1997) predict large numbers of mini-halos with . If the mini-halos form after reionization, then they will be substantially more ionized. This is the model considered in this paper – the objects begin fully ionized and subsequently develop self-shielded cores as the background intensity decreases. One objection to the mini-halo model is that it cannot explain the complex component structure and velocity spread usually observed in QSO heavy element absorption profiles. However, in the hierarchical model of galaxy formation, ensembles of dwarf-like objects coalesce to form larger galaxies, and in this case the individual components in the coalescing object may be well-described as mini-halos. Rauch et al. (1996) have shown that the two-point correlation function of high z C IV absorbers is consistent with the hierarchical formation scenario. In this scenario, the number of mini-halos should decrease with redshift as they merge into larger systems. Nevertheless, some of the mini-halos may survive down to = 0, and Blitz et al. (1998) have recently suggested that the more distant high velocity clouds in the vicinity of the Milky Way are in fact mini-halos which have not yet accreted onto the galaxy.
Some higher column density QSO absorbers may also be due to mini-halo-like objects. For example, Steidel et al. (1997) have been unable to identify the damped Ly system at = 0.656 in the spectrum of 3C 336 despite an exhaustive galaxy redshift survey and deep Hubble Space Telescope (HST) and ground-based IR imaging. They conclude that this absorber is probably due to a dwarf galaxy with very close to the QSO. This damped system has N(HI) cm-2, and a wide variety of metals are detected in this absorber in the HST Faint Object Spectrograph and ground-based spectra of the QSO obtained by Steidel et al. (1997), but unfortunately none of their spectra have adequate resolution to compare the absorption line kinematics to the mini-halo model. On a different sight line, Rao & Turnshek (1998) have identified two low redshift damped Ly absorbers in the spectrum of QSO OI 363, and they note that “none of the galaxies visible in the vicinity of the quasar is a luminous gas-rich spiral with low impact parameter,” again raising the possibility that these high column density systems are due to dwarf-like objects. Kepner, Babul & Spergel (1997) have shown that when a mini-halo attains a self-shielded H I core, the H I column density in the core can exceed cm-2. However, if the damped absorbers are due to several clustered mini-halos which will eventually coalesce, then the N(H I) of the individual mini-halos may be lower while the total H I column (integrated along the line of sight) is sufficient to produce a damped absorber.
Finally, as suggested by Rees (1986) and Miralda-Escudé & Rees (1993), it is possible that some of the Ly clouds may be due to mini-halos, and Mo & Morris (1994) have shown that the observed number density of Ly clouds at various redshifts can be reproduced by the mini-halo model. Rees (1988) points out that due to merging of mini-halos in the hierarchical galaxy formation model, at low redshifts surviving mini-halos will be less likely to be found in regions of large-scale overdensity. Some of the recent studies of the relationship between Ly clouds and galaxies have found Ly clouds apparently in galaxy voids (e.g., Morris et al. 1993; Stocke et al. 1995; Tripp, Lu & Savage 1998); these may be mini-halos which have survived to low by virtue of their location in regions of low galaxy density.
After the mini-halo model was introduced, it was criticized because a huge number of halos per unit redshift would be required to reproduce the observed density of absorption lines since the mini-halos have small spatial cross-sections. Also, observations of double sight lines to QSO pairs indicate that some Ly absorbers have very large spatial extents (e.g., Dinshaw et al. 1995,Dins97 1997). It now seems clear that all of the absorbers cannot be attributed to mini-halos. However, recent hydrodynamic simulations of cosmological structure growth suggest that a variety of phenomena cause QSO absorption lines ranging from very large gaseous filaments to mini-halo-like objects. Furthermore, large numbers of mini-halos are found within the large filamentary structures in simulations at high redshift (e.g., Bond & Wadsley 1997) as well as simulations pushed to = 0 (Davé et al. 1999). Interestingly, recent H I 21 cm imaging has revealed this predicted type of structure at very low redshift: Hoffman et al. (1999) have discovered three mini-halo-like objects embedded in the much larger gas envelope which surrounds the Sm galaxies NGC 4532 and DDO 137 in Virgo. These objects have the expected masses of mini-halos and show no traces of star formation in deep CCD images in B and R.
Given these observational and theoretical motivations, we have revisited the mini-halo model for QSO absorption lines. The rest of this paper is organized as follows. §2 presents the basic physical model behind the mini-halo. §3 describes the code used to compute properties of mini-halos. §4 discusses the various input spectra and presents comparisons of observations with the mini-halo absorption signatures. §5 discusses the results and §6 gives our conclusions.
2 Mini-halo Model
The simulations attempt to follow the evolution of the gas in a fixed halo potential. For these purposes, the dark matter halo is specified by two parameters: the circular velocity and the virialization redshift , which can be translated into a halo radius and halo mass by assuming that the overdensity at virialization is (Gunn & Gott 1972)
| (1) |
where the mean density is given by the usual expressions for a CDM cosmological model: , , .
The dark matter halo profile is taken from Burkert (1995) and is based on fits of dwarf galaxy rotation curves,
| (2) |
which in turn can be related to the halo radius and mass by
| (3) |
While recent numerical work suggests that the halo density profiles of large galaxies are proportional to in the centers and at the edges (Navarro, Frenk & White 1996), these profiles do not fit the dwarf galaxy observations (Moore 1994; Flores & Primack 1994).
The ultraviolet background is able to heat the gas to a temperature of roughly K. In large halos, where , the gas pressure is relatively unimportant and the gas content is determined by the global value of : (assuming ). However, for smaller halos collapsing out of a hot IGM the gas pressure resists the collapse (Thoul & Weinberg 1996) and . A simple estimate as to where this transition occurs and how much gas should reside in the halo can be made using the Jeans mass and Bondi accretion limits. If the gas mass in the uncollapsed halo is greater than the Jeans mass, then the gas should collapse of its own accord. This provides an upper limit to amount of gas in the halo
| (4) |
where , , . For an upper limit can be computed for by estimating the amount of mass that could be accreted via Bondi accretion in a Hubble time. Thus,
| (5) |
where , . Note, the factor has been included in and so that when .
3 Simulating Mini-halos
Calculating the absorption signatures is significantly complicated by the large effect a background UV radiation field can have on gas in small halos (Dekel & Silk 1986; Efstathiou 1992; Quinn, Katz, & Efstathiou 1996; Kepner, Babul & Spergel 1997). To address this issue a code was developed that includes many of the chemical and radiative processes found in CLOUDY (Ferland et al. 1998) and also incorporates multi-wavelength radiative transfer, non-equilibrium chemistry and gas dynamics. The full details of the code are given in Kepner, Babul & Spergel (1997) and are briefly summarized here.
The code computes the quasi-hydrostatic equilibrium states of gas in spherically symmetric dark matter halos (roughly corresponding to dwarf galaxies) as a function of the amplitude of the background UV field. The code integrates the full equations of radiative transfer, heating, cooling and non-equilibrium chemistry for nine species of H and He including H2, as well as all the ionization states of the metals C, O, Mg and Si. These metals were chosen because they are commonly observed in absorption line systems. The density and temperature profiles are evolved through an iterative procedure. The initial gas density profile is specified by hydrostatic equilibrium and by our assumption that the gas is in thermal equilibrium with the background radiation field. At each redshift a new equilibrium temperature profile is computed for current value of the background radiation field, which evolves with redshift. For a given temperature profile, DM potential and total gas mass, it is then a simple matter to compute the density profile necessary to maintain hydrostatic equilibrium.
The important role of the detailed chemistry of primordial gas (in particular the formation of ) has been known and studied since it was first proposed as a mechanism for the formation of globular clusters (Peebles & Dicke 1968). The potential number of reactions in this simple mixture of H and He is enormous (Janev et al. 1987). Abel et al. (1997) have selected a subset of these reactions to model the behavior of primordial gas for low densities ( cm-3) over a range of temperatures (K K). Among the processes included in this model are the photo-attachment of neutral hydrogen, the formation of molecular hydrogen via H-, charge exchange between H2 and H+, electron detachment of H- by neutral hydrogen, dissociative recombination of H2 with slow electrons, photodissociation of H, and photodissociation of H2. In addition, these species have been supplemented with the appropriate chemical and radiative processes for four commonly detected metals: C, O, Mg, and Si. For the metals, this required obtaining additional collisional ionization rate coefficients (Voronov 1997), radiative recombination rates (Verner & Ferland 1996a), dielectronic recombination rates (Aldrovandi & Pequignot 1973; Shull & Van Steenberg 1982; Arnaud & Rothenflug 1985; Nussbaumer & Storey 1983), charge exchange rates (Kingdon & Ferland 1996), and photoionization cross sections (Verner et al. 1996b; Verner & Yakovlev 1995).
Fully 3D radiative transfer requires estimating the contribution to the flux at every point from every other point along all paths for each wavelength. At the minimum this is a 6D problem. However, in most instances symmetries can be introduced which result in a more tractable situation. The simplest situation occurs when the gas can be assumed to be optically thin throughout. This approximation is sufficient in the majority of cosmological situations. The next simplest geometry is that of a slab (or a sphere under the assumption of a radially perpendicular radiation field), which leaves an intrinsically 2D problem. Although this approach may not be a bad approximation for a sphere in an isotropic radiation field, this code accounts for all the different paths that penetrate a given spherical shell, which leaves an inherently 3D problem. Taking into account the different paths effectively “softens” the optical depth, smoothing out transitions from optically thin to optically thick regimes.
Perhaps the most important aspect of the model is the balance between the heating and cooling processes. This balance is what allows the establishment of a quasi-static temperature profile for a specific radiative flux. If the balance between the heating and cooling is not established, then the hydrostatic equilibrium solution to the gas profile will evolve too rapidly. Fortunately, this situation only comes about when the gas in the halo becomes dense and a large amount of H2 is formed. This point presumably marks the onset of star formation, which would dramatically alter the situation, and so the calculation is halted when H2 cooling dominates. The temperature profile is evolved via the heating and cooling functions found in Anninos et al. (1997), which includes photoionization heating and cooling due to collisional excitation, collisional ionization, recombination, molecular hydrogen, bremsstrahlung and Compton cooling.
The microphysical processes couple to the larger scale density profile primarily through radiative heating, which sets the temperature profile. The rate of radiative heating (primarily due to HI, HeI and HeII) is in turn strongly dependent on the column densities of each species, which is set by the temperature. Thus, the resulting system is described by differential equations on the small scale with integral constraints on the large scale. The difficulty of solving such a system is the large variety of time scales involved. Solving the entire set simultaneously is prohibitive. The approach taken here has been to use code modules which solve for each of the processes independently. Iterating between the modules then provides an adequate approximation to the true solution (see Kepner, Babul & Spergel 1997 for a more complete discussion).
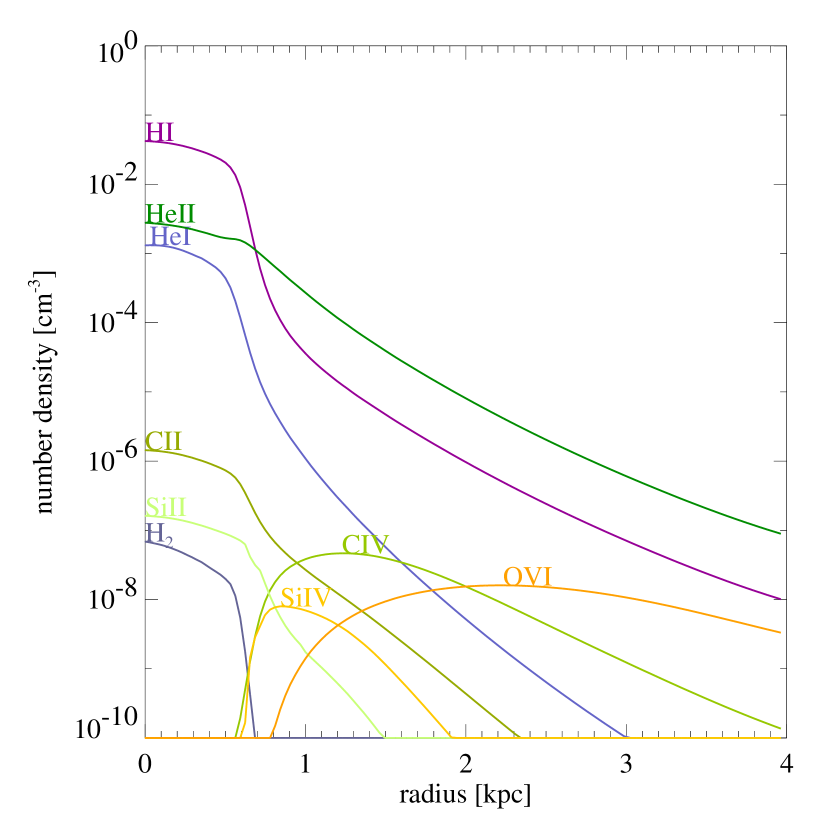
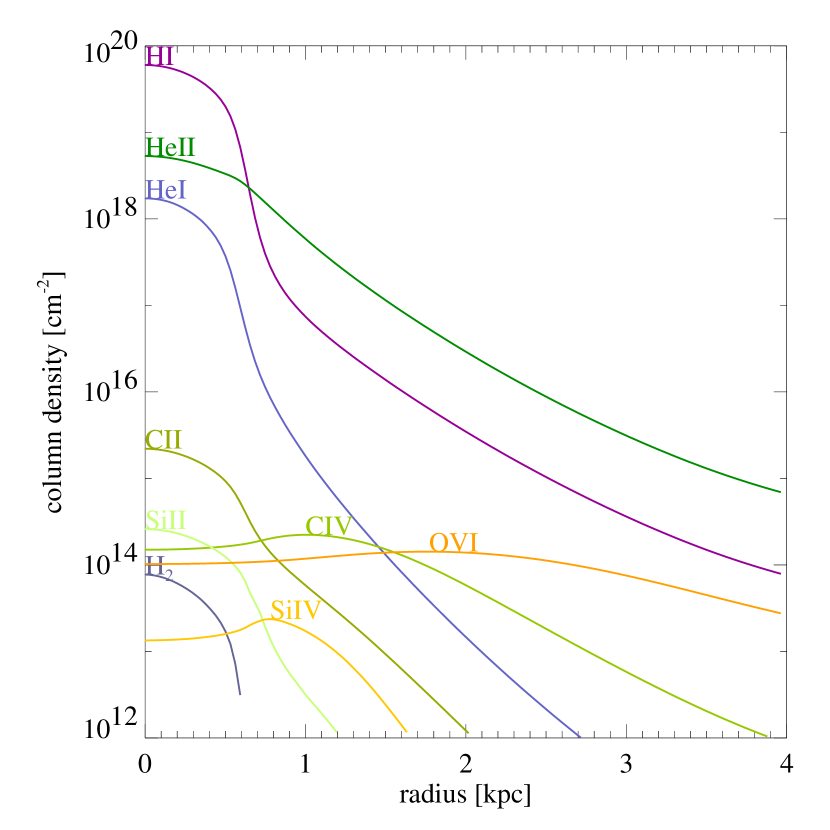
For a given input spectrum (e.g. power law with ), as the amplitude of the UV background is decreased the gas in the core of the dwarf goes through three stages characterized by the predominance of ionized (HII), neutral (HI) and molecular (H2) hydrogen. The last stage (H2) marks the onset of runaway cooling and presumably star-formation. Figures 1, 2, and 3 show this evolution as illustrated by the HI density, HI column density and gas temperature profiles. Figures 4 and 5 show the number density profiles and computed column density profiles of several species for a mini-halo in the neutral (HI) phase.
Although these calculations include C, O, Mg and Si for computing the strengths of absorption lines, metals are ignored in the cooling of the gas. Metals can have a number of important effects on the chemistry and dynamics of gas clouds: dust grains will absorb ionizing radiation and serve as formation sites for molecular hydrogen; atomic lines of C and other heavy elements can be important coolants. Are these processes important in dwarf galaxies at high redshift? Observations of QSO Lyman forest clouds suggest that the metal abundances in meta-galactic gas is times the solar value at (Songaila & Cowie 1996). At these abundances, heavy element cooling is unimportant (Bohringer & Hensler 1989). An upper limit on the mass in dust grains can be obtained by assuming that most of the carbon at high redshift is incorporated into dust grains. If the size distribution of the grains is similar to the local ISM, then this suggests a cross-section per hydrogen atom of cm2 (Draine & Bertoldi 1996). In the mini-halo model, the maximum column density occurs when the cloud is most centrally condensed, which occurs just before the onset of formation and is roughly N(HI) cm-2 (see Figure 1). Thus the maximum optical depth at these wavelengths is approximately . The contribution of dust to H2 formation in our galaxy can be approximated by a , where (Draine & Bertoldi 1996). If we scale by the metallicity, then the dust term will be negligible in comparison to the other terms contributing to formation whenever cm-3, which is nearly always the case in the neutral H core.
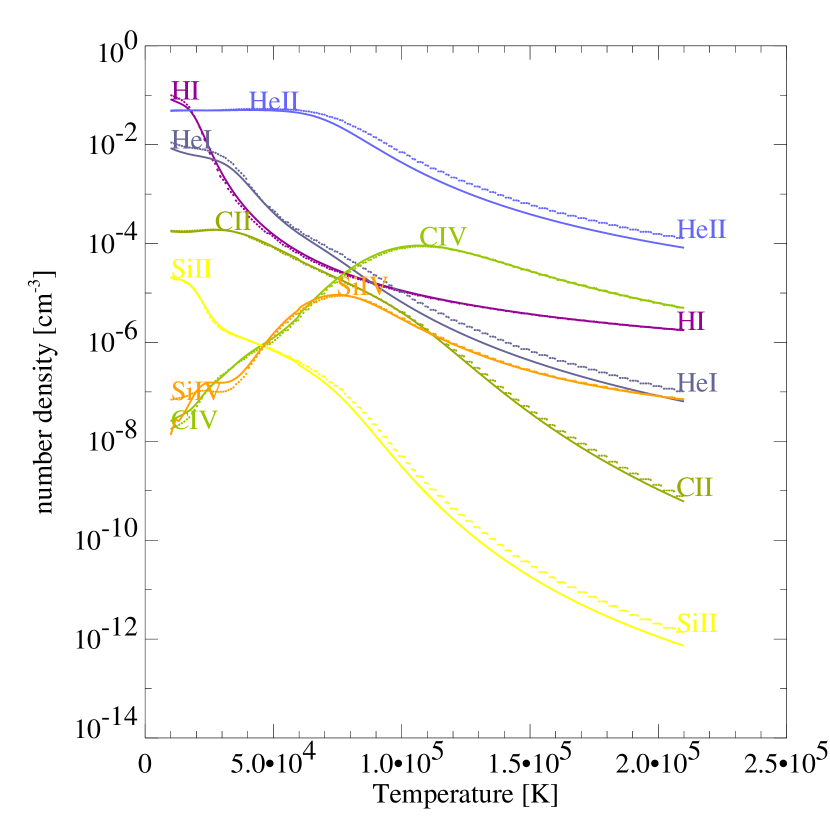
As a test of the accuracy of the chemistry and radiative parts of the code, an optically thin static gaseous halo illuminated by simple power-law spectrum was tested. Figure 6 compares the number densities of various species computed with the mini-halo code with the results of a similar calculation performed with CLOUDY. The two codes are in good agreement.
4 Comparison with Observations
Having laid the groundwork for the mini-halo model, it is possible to proceed with several observational comparisons. Heavy element absorption lines in the higher column density QSO absorbers have been measured and studied intensively for some time. With the advent of the echelle spectrograph on the Keck telescope (Vogt et al. 1994), it has become routine to also detect metals in high redshift Ly clouds (Tytler et al. 1995; Cowie et al. 1995). For example, Songaila & Cowie (1996) have reported that CIV is detected in 75% of Ly clouds with N(HI) cm-2.
Based on single-phase photoionization models constructed with CLOUDY, Giroux & Shull (1997) and Songaila (1998) have shown that in absorbers with N(HI) cm-2, the observed SiIV/CIV column density ratios at high redshift require an overabundance of Si relative to C by factors of 2-3 and/or an ionizing spectrum which is softer than expected based on detailed calculations of the background due to QSOs and AGNs. This can be achieved by a strong contribution to the ionizing spectrum from local hot stars (Giroux & Shull 1997) or by putting a large break in the ionizing spectrum at the HeII edge (Songaila 1998). In addition, Songaila & Cowie (1996) and Songaila (1998) have suggested that the SiIV/CIV ratio decreases rapidly at 3 (Note: other observations do not show this change, e.g., Boksenberg 1997), which can be interpreted as evidence that the ionizing spectrum changes abruptly at this redshift perhaps due to the completion of intergalactic He reionization (see also Heap et al. 1999).
It has also become possible to detect helium absorption in the spectra of QSOs. Absorption due to HeII has now been detected in the spectra of several high QSOs with the HST (Jakobsen et al. 1994; Tytler et al. 1995; Hogan, Anderson & Rugers 1997; Reimers et al. 1997; Heap et al. 1999) as well as the Hopkins Ultraviolet Telescope (Davidsen, Kriss & Zheng 1996)). In some cases voids in the HI Ly forest closely match voids in the HeII absorption (Reimers et al. 1997; Heap et al. 1999), which suggests that a substantial portion of the He absorption is due to unresolved discrete HeII lines corresponding to the HI Ly forest. If many of the Ly clouds are due to mini-halos, then the He absorption lines due to mini-halos should be consistent with the observed He absorption. Also, HeI absorption lines have been reported in some Lyman limit absorbers (Reimers & Vogel 1993).
By stacking the spectra of low redshift Ly clouds in the rest frame, Barlow & Tytler (1998) have shown that low clouds also contain metals with apparently higher metallicities than their high redshift counterparts (however, see Shull et al. 1998 for a counterexample of a rather low metallicity absorber at low redshift). Therefore observations of low QSOs with the Space Telescope Imaging Spectrograph (STIS) should enable detailed studies of abundances and physical conditions in the low redshift clouds whose optical counterparts are more readily observable.
In this section these observations are compared to the predicted properties of the mini-halo model. §4.1 summarizes the various input spectra assumed for the model. The resulting metal line ratios are presented in §4.2. The observed high redshift metal-line ratios are compared with the mini-halo metal line ratios in §4.3. In §4.4 a similar comparison is made with He lines. Finally, as an example of the kind of comparisons that will be possible in the future, the model is applied to a low redshift OVI absorber in §4.5. For the calculations in this section the metallicity is fixed at 1/10 solar. The metal line ratios are independent of metallicity as long as the metallicity is low enough so that radiative cooling by heavy elements is not important, in which case the metal column densities directly scale with N(HI) and metallicity.
4.1 Input Ionizing Spectra
Several spectral shapes are used as inputs: (1) a power-law with spectral index (i.e., ), (2) a power-law with and a factor of 50 break at the HeII edge, (3) an O star with = 50,000K from the ATLAS9 models computed and distributed by R.L. Kurucz, and (4-6) the UV background due to QSOs and AGNs calculated by Haardt & Madau (1996) at redshifts z = 0, 2, and 4. The power-law and power-law + HeII break spectra are standard approximations of the UV background due to QSOs and AGNs but neglect much of the radiation reprocessing which occurs in intervening gas; the detailed effects of intervening absorption and re-emission are included in the Haardt & Madau (1996) models. The O star spectrum is not particularly realistic for a real QSO absorber but is useful for illustrating the differences between a mini-halo ionized by UV radiation predominantly from local hot stars and a mini-halo photoionized by the background radiation from distant quasars. The shapes of these spectra are shown in Figure 7. The spectra have been normalized so that (h = 13.6 eV) = 1.0. The mini-halo model evolves the spectra by decreasing its overall amplitude, beginning high and slowly dropping off. This is meant to crudely approximate the evolution of the amplitude of the radiation field with redshift. As the amplitude of the radiation field drops, the gas in the core of the mini-halo enters the HI phase, while the outer parts are still ionized. The various column densities computed from the mini-halo that are shown in the subsequent sections are done so during the HI phase, which provides the best example of a multi-phase absorber.
4.2 Mini-Halo Metal Line Ratios
Figures 8 and 9 show the metal line column density ratios predicted by the mini-halo model for all six spectra shown in Figure 7. Various ions of C, O, Si and He are selected with transitions which can be detected from the ground, with the exception of the He lines at 912Å, which must be observed from space. (Note: See Table 4 in Morton, York, & Jenkins 1988 for transition wavelengths. Oscillator strengths for these lines are found in Morton 1991, and some important recent f-value revisions are summarized by Tripp, Lu, & Savage 1996.) The ratio N(CII)/N(CIV) is chosen as the standard abscissa in this type of plot because the CII and CIV lines are extremely strong and therefore can be detected in low metallicity gas. However, these lines are also prone to saturation and must be used cautiously.
The model ratios are primarily a function of the ionization parameter U, the ratio of the H ionizing photon density to the total hydrogen density, which decreases as N(CII)/N(CIV) increases. The value of U for the six input spectra is shown as a function of N(CII)/N(CIV) in Figure 10. In terms of the mini-halo model depicted in Figures 1-5 low N(CII)/N(CIV) corresponds to the outer part of the halo and high N(CII)/N(CIV) corresponds to the inner part.
For the ratios shown in Figures 8 and 9, U ranges from to . Figure 8 shows that over this range of U, the metal ratio differences resulting from the different input spectra (in particular the with a HeII break and the Haardt & Madau 1996 spectra) are usually within a factor of 3, which is typically less than the scatter in the observed ratios (see below). Notable exceptions are the O star ratios, which not surprisingly are quite different, even from the w/break spectra, and the OVI/CIV and the SiIV/CIV ratios which in some cases differ by two orders of magnitude.
The right panels of Figures 8 and 9 show the mini-halo metal ratios at = 0, 2, and 4 based on the Haardt & Madau (1996) modeling of the UV background, which show very little change in the metal ratios between = 4 and = 2, i.e., the abrupt change at = 3 in the SiIV/CIV ratio reported by Songaila & Cowie (1996) is not expected in mini-halos given the Haardt & Madau (1996) UV background. Again, the largest changes (greater than a factor of 3) from = 4 to = 0 are in the OVI/CIV and SiIV/CIV ratios; it seems that the other ratios do not change much over this entire redshift range if the ionizing UV background is predominantly due to QSOs and AGNs.
4.3 Metal Line Ratios in High Redshift Absorbers
In Figure 11 observed column density ratios from a sample of high redshift () absorbers are plotted with the mini-halo model ratios for three radiation fields: Haardt & Madau (1996) at , w/break and O star. The SiIV/CIV and SiII/CIV ratios are plotted versus the CII/CIV ratio. All of observed column densities in this Figure were measured with the Keck 1 echelle spectrograph and include a mix of Lyman limit and Ly forest absorbers (shown with open diamonds) from Songaila (1998) as well as four higher column density damped Ly absorbers (filled squares) from Lu et al. (1996).
The damped absorbers are the four systems from the Lu et al. (1996) sample which have low enough HI column densities that the mini-halo model still applies — their column densities range from log N(HI) = 20.20 to log N(HI) = 20.52. Most of these systems are complex multiple-component absorbers, so a single mini-halo obviously cannot produce the observed absorption profiles. However, as noted in §1, if these absorption systems are collections of merging smaller objects as postulated in the hierarchical galaxy formation model, then the individual clumps may be well-described by the mini-halo model. Alternatively, some of the absorption may be due to mini-halos accreting onto bigger galaxies. In either case, it would be useful to compare these models to the observed properties of the individual components, but unfortunately such data are not yet widely available. The large amount of data contained in Keck spectra makes it difficult to provide a full listing of each component. With a few exceptions (e.g., Ganguly, Churchill, & Charlton 1998), most Keck publications provide in tabular format only the total column densities integrated over all components. Nevertheless, these total column densities provide weighted averages of the column densities of the individual components and can be used to test the validity of photoionization models.
Figure 11 shows that the multi-phase mini-halo model developed here leads to many of the same conclusions reached by, among others, Giroux & Shull (1997) and Songaila (1998) on the basis of single-phase constant density slab models. Specifically, it appears that the models with the straight power-law and the Haardt & Madau (1996) ionizing radiation fields fall well below many of the observed ratios when N(CII)/N(CIV) . This problem is alleviated by adopting the much softer O star spectrum. The power-law with a break at the HeII edge comes closer to the observed ratios but still falls short. Evidently in this model the flux must drop by substantially more than a factor of 50 at the HeII break or Si must be over-abundant relative to C (compared to the solar ratio) in these high absorbers.
4.4 Helium Absorption Lines
Recently detected HeII absorption has raised the question as to whether or not this absorption is entirely due to HeII associated with the discrete HI Ly clouds or whether a diffuse smoothly distributed IGM makes a contribution. A variety of calculations have been performed to try to reproduce the observed HeII optical depth (e.g., Giroux, Fardal & Shull 1995; Fardal, Giroux & Shull 1998). These models are not completely constrained by the observations and require a variety of inputs (e.g. the amplitude, shape and evolution of the background radiation field). These authors find that a radiation field similar to Haardt & Madau (1996) with N(HeII)/N(HI) 100 provides the best results. The mini-halo model is consistent with this value (see Figure 12) for absorbers with N(HI) , which are believed to dominate the discrete component of the HeII optical depth.
HeI absorption has also been claimed to be detected from space in four Lyman limit systems (Reimers et al. 1992; Reimers & Vogel 1993). These results have been used to try and provide additional constraints on the the global He/H value. The limited number of observations make detailed comparisons difficult, but the observed N(HeI)/N(HI) are consistent with the mini-halo model if a harder () spectrum is used (see Figure 13), but this spectrum is unlikely to be consistent with the metal line data. Interestingly, similar slab based calculations were unable to match these observations (Reimers & Vogel 1993). These Lyman limit systems may correspond to a region along the core edge where the multi-phase and geometric effects of the mini-halo model are greatest (see Figures 4 and 5). If this were true, one might expect to see a class of HeI absorbers corresponding to LL systems. However, we note that the identification of the He I absorption lines in the Reimers et al. (1992) data is equivocal due to the low resolution of the data and requires verification with higher resolution spectroscopy.
4.5 Low Redshift Absorbers
Barlow & Tytler (1998) have recently shown that most low Ly clouds do contain metals, and their metallicities are higher than the high clouds. STIS, the Cosmics Origins Spectrograph (COS - to be installed in HST in 2003), and to a lesser extent FUSE will provide a wealth of new data on metals in low absorbers. As an example of the type of analysis that will be possible, the mini-halo is compared with the observations of the intervening absorber at z = 0.225 toward H 1821+643 (Savage, Tripp & Lu 1998). This absorber has a good measurement of the OVI column density (log N(O VI) = 14.290.03) and upper limits on CIV, SiIV and SiII (see Table 3 in Savage, Tripp & Lu 1998). Figure 14 shows these limits along with the mini-halo model predictions. Comparing the mini-halo OVI column density in the allowed region of Figure 14 for gas with 1/10 solar metallicity results gives a value of N(OVI) indicating that mini-halos would be needed to explain this absorber. This is not allowed because the high resolution OVI absorption profile shown in Figure 3 of Savage, Tripp & Lu (1998) only shows evidence of one component. Furthermore, the good correspondence of the red wing of the OVI and HI Lyman profiles in this absorber (again, see Fig. 3 in Savage, Tripp & Lu 1998) suggests that there is an appreciable amount of HI absorption which occurs in the same gas that produces the OVI absorption. The mini-halo model will produce a negligible amount of HI absorption if it is required to also satisfy the above constraints on the metals. Therefore the mini-halo model is unable to explain this absorber on two counts (1) not enough OVI, and (2) not enough HI. The more likely explanation is a larger, more diffuse object.
5 Discussion
The previous sections presented a variety of results comparing mini-halos with absorption line observations. This section considers the implication of a few of these results in more detail. §5.1 examines the overall abundance of mini-halos. In §5.2 looks at the implications of the metal-line comparisons and some possible alternative explanations. §5.3 looks at other possible probes of the mini-halo model.
5.1 Abundance of Mini-Halos
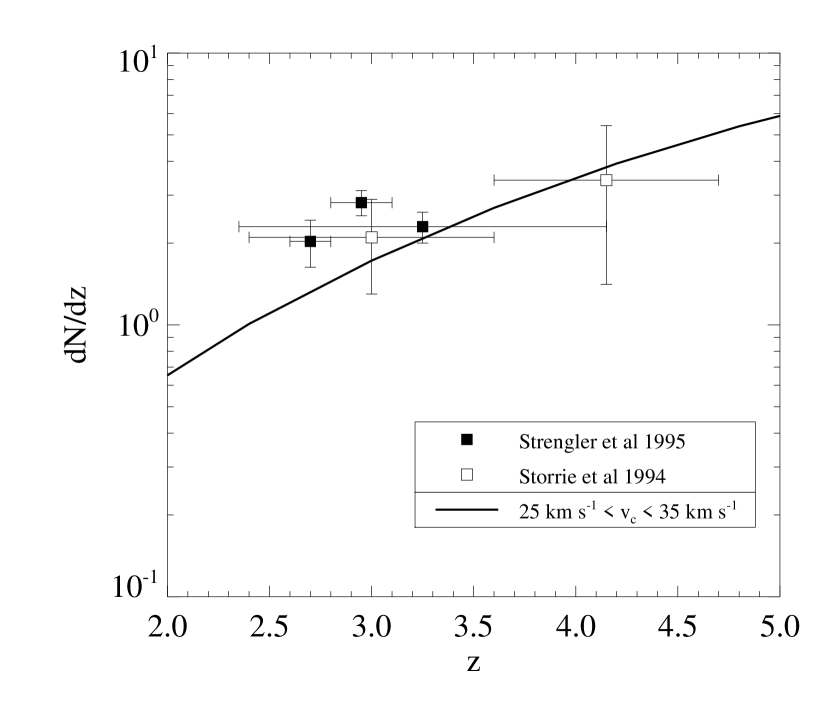
The abundance of these mini-halos can be roughly calculated with Press-Schechter formalism. Although, it is important to keep in mind that Press-Schechter theory is most accurate at the largest scales (i.e., clusters of galaxies) and becomes more uncertain for estimating the distribution of smaller objects. Following the calculation in Abel & Mo (1998), which uses the method of Lacey & Cole (1994) to account for merging of halos, it is possible to estimate the number of halos per unit redshift with (see Figure 15). These simple estimates assume column density profiles similar to those calculated in the previous section. Although these calculations are far from definitive, they are consistent with the observations of Storrie-Lombardi et al. (1994) and Stengler-Larrea et al. (1995). It is not inconceivable that a significant fraction of absorption line systems could be attributable to gas in mini-halos. However, recent observations and cosmological simulations suggest that it is unlikely that all of the QSO absorption line systems are due to mini-halos (see §1).
If some of the present day offspring of mini-halos are high velocity clouds like those believed to be falling into the Milky Way (Blitz et al. 1998), then the abundance of these clouds gives an idea of the likelihood of observing one of these objects near a large galaxy. Estimates of the covering fraction of high velocity clouds around our own galaxy would suggest a probability of finding a mini-halo within 1.5 Mpc of a larger galaxy is around 0.2.
5.2 Explaining the high redshift absorbers
As shown in Figure 11, it appears that the models with the straight power-law and the Haardt & Madau (1996) ionizing radiation fields fall well below many of the observed ratios when N(CII)/N(CIV) . This problem is alleviated by adopting the much softer O star spectrum. The power-law with a break at the HeII edge comes closer to the observed ratios but still falls short. If the flux increases at energies higher than the HeII break, as might be expected due to the decreasing HeII absorption cross section with increasing photon energy, then the observed ratios become even harder to fit with the power-law + HeII break spectrum (Rauch et al. 1997b). The flux may not recover as rapidly as expected due to smearing of the absorption by He at different redshifts along the line of sight, but nevertheless this scenario provides motivation for considering alternatives. Songaila (1998) suggests the power-law + HeII break ionizing spectrum provides a natural explanation for the change in the SiIV/CIV ratio at . At He is not yet fully reionized and consequently the universe has substantial opacity at the He break. At , He reionization is complete so the He break vanishes leading to smaller SiIV/CIV ratios.
An alternative is that the ionization of some of the absorbers is dominated by radiation from hot stars (Giroux & Shull 1997). Figure 11 shows that if the ionizing radiation can be approximately described by an O-star spectrum (dashed line in Fig 11), then the observed ratios are reproduced by the model. In this respect, it is interesting to note that the highest SiIV/CIV ratios measured by Songaila (1998) are quite similar to the SiIV/CIV ratios observed in the ISM of the Milky Way. For example, Sembach, Savage, & Tripp (1997) have measured the CIV/SiIV ratio in the Galactic ISM using sight lines to 31 stars observed with HST and IUE, and they derive N(CIV)/N(SiIV) = 3.81.9, close to the highest ratios in Figure 11. The high ionization of these Milky Way sight lines is probably produced by photoionization from hot stars or collisional ionization with additional photoionization from re-emission in the hot gas (see §8 in Sembach, Savage, & Tripp 1997).
It is not entirely unreasonable to suggest that hot stars make a substantial contribution to the photoionization of high absorbers. At some point in the past, galaxies must have undergone widespread waves of star formation. Based on the apparent increase in the metallicity of damped Ly absorbers at , Lu et al. (1996) have suggested that this redshift marks the first epoch of major star formation in galaxies. This star formation will be accompanied by copious UV emission, and if this UV light is able to escape, then it could be a substantial source of photoionization.
In this scenario, what are some possible explanations for the change in the SiIV/CIV ratio at = 3 reported by Songaila (1998)? One possibility is that the SiIV/CIV ratio is a function of absorber HI column density, and the portion of Songaila’s sample with 3 has a larger fraction of systems with higher HI columns. In this case, the different Si IV/C IV ratios could be caused by self-shielding due to He and/or H in higher column density absorbers, for example. The Songaila (1998) sample contains Lyman limit [N(HI) cm-2] and Ly forest absorbers, but H I column densities are not provided. However, the CII and SiII column densities can be used as rough proxies for the HI column since absorbers with higher N(HI) will have higher CII and SiII column densities as well.
To check for a possible N(HI) dependence, Figure 16 plots the CIV/SiIV column density ratio from the Songaila (1998) sample (diamond symbols) vs. N(SiII) (left panel) and vs. N(CII) (right panel). [Note: the SiII detections or limits are available for most of the absorbers in the Songaila (1998) sample while CII measurements or limits are available for a fraction of the systems.] In addition, the four damped systems from Lu et al. (1996, square symbols) have also been added. In this Figure, absorbers are indicated with filled symbols while systems are marked with open symbols, and systems with only upper or lower limits are shown with arrows. Finally the Milky Way value of CIV/SIV obtained by Sembach, Savage, & Tripp (1997) is bracketed by the horizontal dashed lines.
Figure 11 suggests several interesting points:
-
1.
As mentioned earlier, there appears to be a significantly larger fraction of systems with low N(CIV)/N(SiIV) at .
-
2.
Many of the high column systems have N(CIV)/N(SiIV) ratios consistent with the ratios in our own Milky Way ISM.
-
3.
There are almost no high column systems (N(SiII) or N(CII) ) with high N(CIV)/N(SiIV) at any redshift.
-
4.
There appears to be a significantly larger fraction of high column systems (N(SiII) or N(CII) ) at .
One hypothesis that is consistent with these points (the third and the fourth in particular) is that the lower column systems with higher N(CIV)/N(SiIV) exist but were not detected at . However, for this hypothesis to be true, there must also be a dependence of N(CIV)/N(SiIV) on column density. Thus, it would be useful to examine the dependence of the CIV/SiIV ratio on HI column density using direct measurements of N(HI).
5.3 Other probes
The absorption signatures discussed so far are for species whose populations are dominated by the background radiation field. To fully probe the multi-phase density and temperature structure of the mini-halo requires examining other species that are involved in more complex chemistry, such as molecular hydrogen. So far H2 detections are rare, but as they become more common the mini-halo model can be used to make definite predictions. These may be particularly useful in higher column systems that correspond to the core of the mini-halo where H2 is most prevalent (see Figures 4 and 5).
Another useful probe might be CII*. CII is a strong line that is often detected and CII* has been detected in a few cases. For illustration purposes,the value of CII* is calculated assuming statistical balance between collisional de-excitation and collisional + radiative excitation between the level 0 (2P) and level 1 (2P) states:
| (6) |
where the coefficients are computed as follows: HI (Harel et al. 1978), H2 (Flower & Launay 1977), He (assumed to be 0.5 times H2), e- (Keenan et al. 1986) and A10 (Nussbaumer & Storey 1988). At maximum N(CII*)/N(CII) , which is unlikely to be detected and more importantly is swamped by CII* excitation by the cosmic microwave background (Lu et al. 1996). In any case, additional diagnostics like these can be explored and tested with the mini-halo model.
6 Conclusions and Further Work
In this paper the absorption line signatures of gas in mini dark matter halos were computed. The motivation for this comes from two perspectives. First, mini-halos may exist in significant numbers and be the source of many absorption line systems. Second, absorption line systems in general may be multi-phase objects and the mini-halo model provides one means of exploring multi-phase structures.
The mini-halo model can be compared with a wide variety of observations both ground and space based. A few such comparisons are made here: high redshift metal line systems, He absorption line systems and a low redshift OVI absorber. It appears that the mini-halo model is consistent with the high redshift metal line systems and leads to many of the same conclusions made with single-phase slab models. In particular, a very soft spectrum is required to fit the observed N(SiIV)/N(CIV) data. Likewise, the mini-halo model N(HeII)/N(HI) is consistent with calculations by other researchers based on the observed HeII optical depth. Perhaps, one interesting result is that the mini-halo model with a spectrum is consistent with the HeI observations in Lyman limit systems, where other models have had a more difficult time matching this result. Finally, a comparison with a single OVI absorber indicates that the mini-halo is not a good explanation for this object and that a larger more diffuse system is more likely.
Based on these results it appears that the mini-halo model absorption line signatures are consistent with most current observations. Thus, in any given instance it is difficult to either rule in or rule out a mini-halo and in most cases additional data (e.g. optical counterparts or the lack thereof) or a detailed examination of predicted line profiles may be necessary to break the degeneracy. There are a number of simplifications in the model presented here, and several issues should be explored in future studies. First, the effects of any star formation on the mini-halos should be considered; even a very small number of supernovae could substantially affect the structure of a mini-halo by driving a wind and blowing out gas. This may increase the likelihood that mini-halos will cause QSO absorption lines by increasing their spatial cross sections. Second, the impact of shock heating on the mini-halo absorption line signatures should be evaluated. Shocks are generated by the collapse of initial density perturbations, and these are seen to cause substantial heating of gas in the vicinity of galaxies in cosmological hydrodynamic simulations (e.g., Davé et al. 1999; Cen & Ostriker 1999). Finally, the input radiation fields can be refined. For example, a considerably more sophisticated model for the radiation from a star forming galaxy than the simple O-star spectrum should be developed. New hot star model atmospheres emit more ionizing continuum (e.g., Schaerer & DeKoter 1997), and this may alter the metal line ratios. The mini-halo model is a useful tool for analyzing the absorption line data in a multi-phase context and should become even more applicable as new space based observations become available.
References
- (1) Abel, T., Anninos, P., Zhang, Y., & Norman, M.L. 1997, astro-ph/9608040, New Astronomy, 2, 181
- (2) Abel, T. & Mo, H. J. 1998, ApJ, 494, L151
- (3) Aldrovandi, S. & Pequignot, D. 1973, Astronomy & Astrophysics, 25, 137
- (4) Anninos, P., Zhang, Y., Abel, T., & Norman, M.L. 1997, astro-ph/9608041, New Astronomy, 2, 209
- (5) Arnaud, M. & Rothenflug, R. 1985, A&AS, 60, 425
- (6) Barlow, T. A., & Tytler, D. 1998, AJ, 115, 1725
- (7) Bergeron, J. & Stasińska, G. 1986, A&A, 169, 1
- (8) Blitz, L., Spergel, D. N., Teuben, P. J., Hartmann, D., & Burton, W. B. 1998, astro-ph/9803251, ApJ, in press
- (9) Bohringer, H., & Hensler, G. 1989, A&A, 215, 147
- (10) Boksenberg, A., 1997, astro-ph/9710258, in Proc. of the 13th IAP Colloquium: Structure and Evolution of the IGM from QSO Absorption Line Systems, eds. P. Petitjean & S. Charlot, (Paris:Nouvelles Frontieres), 85
- (11) Bond, J. R., & Wadsley, J. W. 1997, in Proc. of the 13th IAP Colloquium: Structure and Evolution of the IGM from QSO Absorption Line Systems, eds. P. Petitjean & S. Charlot, (Paris:Nouvelles Frontieres), 143
- (12) Burkert, A. 1995, ApJ, 447, L25
- (13) Cen, R., & Ostriker, J. P. 1999, ApJ, in press (astro-ph/9806281 v3)
- (14) Churchill, C. W., & Charlton, J. C. 1999, AJ, submitted (astro-ph/9809042)
- (15) Cowie, L. L., Songaila, A., Kim, T.-S., & Hu, E. M. 1995, AJ, 109, 1522
- (16) Davé, R., Hernquist, L., Katz, N., & Weinberg, D. H. 1999, ApJ, in press (astro-ph/9807177)
- (17) Davidsen, A.F., Kriss, G.A., & Zheng, W. 1996, Nature, 380, 47
- (18) Dekel, A., & Silk, J. 1986, ApJ, 303, 39
- (19) Dinshaw, N., Foltz, C. B., Impey, C. D., Weymann, R. J., & Morris, S. L. 1995, Nature, 373, 223
- (20) Dinshaw, N., Weymann, R. J., Impey, C. D., Foltz, C. B., & Morris, S. L. 1997, ApJ, 491, 45
- (21) Donahue, M., & Shull, J. M. 1991, ApJ, 383, 511
- (22) Draine, B.T., & Bertoldi, F. 1996, ApJ, 468, 269
- (23) Efstathiou, G. 1992, MNRAS, 256, 43P
- (24) Fardal, M. A., Giroux, M. L. & Shull, J. M. 1998, AJ, 115, 2206
- (25) Ferland, G. J., Korista, K. T., Verner, D. A., Ferguson, J. W., Kingdon, J. B., & Verner, E. M. 1998, PASP, 110, 761
- (26) Flores, R. & Primack, J.R. 1994, ApJ, 427, 1
- (27) Flower & Launay 1977, J. Phys. B, 10, 879
- (28) Ganguly, R., Churchill, C. W., & Charlton, J. C. 1998, ApJ, 498, L103
- (29) Giroux, M. L., Fardal, M. A. & Shull, J. M. 1995, ApJ, 451, 477
- (30) Giroux, M. L., & Shull, J. M. 1997, AJ, 113, 1505
- (31) Giroux, M.L., Sutherland, R.S., & Shull, J. M. 1994, ApJ, 435, L97
- (32) Gunn, J., & Gott, R. 1972, ApJ, 176, 1
- (33) Haardt, F. & Madau, P. 1996, ApJ, 461, 20
- (34) Harel, Lopez, McCarroll, Riera & Wahnon 1978, J. Phys. B, 11, 71
- (35) Heap, S. R., Williger, G. M., Smette, A., Hubeny, I., Sahu, M., Jenkins, E. B., Tripp, T. M., & Winkler, J. N. 1999, ApJ, submitted (astro-ph/9812429)
- (36) Hoffman, G. L., Lu, N. Y., Salpeter, E. E., & Connell, B. M. 1999, AJ, in press (astro-ph/9811095)
- (37) Hogan, C. J., Anderson, S. F., & Rugers, M. H. 1997, AJ, 113, 1495
- (38) Jakobsen, P. et al 1994, Nature, 370, 35
- (39) Janev, R.K., Langer, W.D., Evans, Jr. K., & Post, Jr. D.E. 1987, Elementary Processes in Hydrogen-Helium Plasmas (Springer-Verlag)
- (40) Keenan et al 1986, MNRAS, 220, 571
- (41) Kepner, J., Babul, A. & Spergel, D. 1997, ApJ, 487, 61
- (42) Khare, P., & Ikeuchi 1998, PASJ, 50, 13
- (43) Kingdon, J.B. & Ferland, G.J. 1996, ApJS, 106, 205
- (44) Lacey, C. & Cole S. 1994, MNRAS, 271, 676
- (45) Lu, L., Sargent, W. L. W., Barlow, T. A., Churchill, C. W., & Vogt, S. S. 1996, ApJS, 107, 475
- (46) Lu, Sargent, Barlow, & Rauch 1998 astro-ph/9802189
- (47) Miralada-Escude, J. & Rees, M. 1993, MNRAS, 260, 617
- (48) Mo, H. J., & Morris, S. L. 1994, MNRAS, 269, 52
- (49) Moore, B. 1994, Nature, 370, 629
- (50) Morris, S. L., Weymann, R. J., Dressler, A., McCarthy, P. J., Smith, B. A., Terrile, R. J., Giovanelli, R., & Irwin, M. 1993, ApJ, 419, 524
- (51) Morton, D. C. 1991, ApJS, 77, 119
- (52) Morton, D. C., York, D. G., & Jenkins, E. B. 1988, ApJS, 68, 449
- (53) Navarro, J.F., Frenk, C.S., & White, S.D.M. 1996, astro-ph/9611107, ApJ, submitted
- (54) Nussbaumer, H. & Storey, P. 1983, A&A, 126, 75
- (55) Nussbaumer, H. & Storey, P. 1988, A&A, 193, 237
- (56) Peebles, J., & Dicke, R. 1968, ApJ, 154, 891
- (57) Petitjean, P., Riediger, R., & Rauch, M. 1996, A&A, 307, 417
- (58) Quinn, T., Katz, N., & Efstathiou, G. 1996, MNRAS, 278, L49
- (59) Rao, S. M., & Turnshek, D. A. 1998, ApJ, 500, L115
- (60) Rauch, M., Sargent, W. L. W., Womble, D. S., & Barlow, T. A. 1996, ApJ, 467, L5
- (61) Rauch, M. 1997a, in Structure and Evolution of the Intergalactic Medium from QSO Absorption Line Systems, ed. P. Petitjean & S. Charlot, (Paris:Editions Frontieres), 109
- (62) Rauch, M., Haehnelt, M. G., & Steinmetz, M. 1997b, ApJ, 481, 601
- (63) Rees, M. J. 1986, MNRAS, 218, 25P
- (64) Rees, M. J. 1988, in QSO Absorption Lines: Probing the Universe, ed. J. C. Blades, D. Turnshek, & C. A. Norman, (Cambridge:Cambridge Univ. Press), 107
- (65) Reimers, D. et al. 1992, Nature, 360, 561
- (66) Reimers, D. et al. 1997, A&A, 327, 890
- (67) Reimers, D. & Vogel, S. 1993, A&A, 276, L13
- (68) Savage, B. D., Tripp, T. M., & Lu L. 1998, AJ, 115, 436
- (69) Schaerer, & DeKoter 1997, A&A, 322, 598
- (70) Sembach, K. R., Savage, B. D., & Tripp, T. M. 1997, ApJ, 480, 216
- (71) Shull, J. M., Penton, S. V., Stocke, J. T., Giroux, M. L., van Gorkom, J. H., Lee, Y. H., & Carilli, C. 1998, AJ, 116, 2094
- (72) Shull, J.M. & Van Steenberg, M. 1982, ApJS, 48, 95
- (73) Songaila, A., & Cowie, L. L. 1996, AJ, 112, 335
- (74) Songaila, A. 1998, AJ, 115, 2184
- (75) Steidel, C. C., Dickinson, M., Meyer, D. M., Adelberger, K. L., & Sembach, K. R. 1997, ApJ, 480, 568
- (76) Stengler-Larrea, E.A. et al 1995, ApJ, 444, 64
- (77) Stocke, J. T., Shull, J. M., Penton, S., Donahue, M., & Carilli, C. 1995, ApJ, 451, 24
- (78) Storrie-Lombardi, L.J., McMahon, R.G., Irwin, M.J. & Hadard, C. 1994, ApJ, 427, L13
- (79) Thoule, A., & Weinberg, D.H. 1996, ApJ, 465, 608
- (80) Tripp, T. M., Lu, L., & Savage, B. D. 1996, ApJS, 102, 239
- (81) Tripp, T. M., Lu, L., & Savage, B. D. 1997, ApJS, 112, 1
- (82) Tripp, T. M., Lu, L., & Savage, B. D. 1998, ApJ, 508, 200
- (83) Tytler, D., Fan, X. M., Burles, S., Cottrell, L., Davis, C., Kirkman, D. & Zuo, L. 1995, in QSO Absorption Lines, ed. G. Meylan, (Berlin: Springer), 289
- (84) Verner, D.A. & Ferland, G.J. 1996, ApJS, 103, 467
- (85) Verner, D.A., Ferland, G.J., Korista, K.T. & Yakovlev, D.G. 1996, ApJ, 465, 487
- (86) Verner, D.A. & Yakovlev, D.G. 1995, A&AS, 109, 125
- (87) Vogt, S.S. et al 1994, Proc. SPIE, 2198, 326
- (88) Voronov, G.S. 1997, Atomic Data and Nuclear Data Tables, 65, 1