Long slit spectroscopy of diffuse ionized gas in NGC 55††thanks: Based on observations obtained at ESO/La Silla
Abstract
Spectroscopic measurements of emission line ratios and velocities are presented for ionized gas across the central plane of NGC 55, a late-type galaxy in the Sculptor group. The low metallicity in NGC 55 leads to relatively low line ratios of [S ii]/H and [N ii]/H for H ii regions as well as the diffuse ionized gas. These are the first spectroscopical measurements of line ratios in ionized gas exterior to the stellar disc of NGC 55. Analysis of the line ratios and the relative velocities of different features suggests that photoionization is a plausible explanation for the ionization of this diffuse gas. The observed shell structures and the corresponding velocities support the idea of diffuse gas being pushed into the halo by supernova explosions and stellar winds.
Key Words.:
ISM: bubbles – ISM: general – H ii regions – Galaxies: individual: NGC 55 – Galaxies: ISM1 Introduction
When examining ionized gas, it is common practice to distinguish between classical H ii regions (Strömgren spheres around OB stars) and diffuse ionized gas (DIG), the gas outside the boundaries of the Strömgren spheres. While H ii regions are created by photoionization, the ionization processes for the diffuse gas are less well known. Many attempts have been made to explain the DIG by photoionization models (e.g. Domgörgen & Mathis domma (1994)), while few studies address the possibility of shock excitation (e.g. Sivan et al. sivan (1986)). In recent years, DIG was found not only in the disc of galaxies, but also far above the disc in the halo of the Milky Way and in some edge-on galaxies at scale heights of more than 1 kpc (e.g. Reynolds rey (1985); Rand et al. rand (1990)). Questions therefore arise about where this extraplanar DIG (eDIG) comes from and how it is ionized. Dynamical models of galaxies like ‘galactic fountains’ (Shapiro & Field shap (1976)) and ‘chimneys’ (Norman & Ikeuchi nor (1989)) describe how gas can be transported from the disc into the halo. Supernova explosions heating the gas in the disc and pushing it up into the halo are important for both the dynamics and the ionization of the gas in the halo. Due to the high velocities in this ejected gas, shocks can arise and ionize the gas far above the disc. The model of runaway O stars leaving the disc and moving into the halo (e.g. Gies gies (1987)) as well as the theory of photons created by neutrino decay (Sciama scia (1990)) are further attempts to explain the ionization of extraplanar DIG.
To obtain more information about the physical properties of the DIG, spectroscopic data are needed. Up to now spectra of DIG were taken of the Milky Way (MW), NGC 891, NGC 4631, NGC 2188 and the Large Magellanic Cloud (LMC). A small sample of dwarf galaxies (Martin mart (1997)) and a sample of five late-type galaxies (Wang et al. wang (1997)) have also been examined spectroscopically. In this paper we present spectroscopic data of the central region of NGC 55, a highly inclined (), nearby (2 Mpc) SB(s)m-galaxy of the Sculptor group. Since late-type galaxies in general are rich in OB stars and bigger H ii regions (Kennicutt et al. keh (1989)), NGC 55, a late-type near edge-on galaxy, is ideal for examining the DIG with regard to the ionization process.
Due to its vicinity to the Milky Way, high spatial resolution allows us to distinguish between different morphological structures of the diffuse gas which are identified with the help of an H mosaic of NGC 55.
2 Observations and data reduction
2.1 Observations
The image of NGC 55 is a mosaic of three different images obtained at the 2.2 m telescope at ESO/La Silla. The RCA 5264–16 CCD chip that was used yielded a pixel size of . The field of view of each image was about x . The exposure time was 30 min for each H image (filter #387, =6569 Å, FWHM=81 Å) and 15 min for each R-band image (filter #464, =6683 Å, FWHM=1083 Å) used for continuum subtraction. The filter transmission was the same for the nitrogen lines ([N ii] 6548.1, 6583.4Å) and the H line (6562.8Å).
The spectra of NGC 55 were obtained at the 3.6 m telescope at ESO/La Silla. The B&C spectrograph with a GEC 2075–11–11 CCD chip yielded a pixel size of and 1.28 Å, respectively. The slit length was about in a wavelength range of 6258–6987 Å. The exposure time for each spectrum was 30 min.
2.2 Data reduction
All data for NGC 55 were reduced by standard procedures in MIDAS. Since the emission lines in the spectra covered the entire slit, it was not possible to use sky spectra from the same frames. Therefore sky spectra obtained from other galaxy spectra observed during the same night at the same telescope were compared with each other. It turned out that the line ratios among the sky lines remained constant during the night. Thus we could use these sky spectra for sky subtraction in the NGC 55 data. The correction of the spectroscopic data with regard to the response function of the CCD was negligible. To calculate line ratios and velocities, we took means over several rows (if necessary) before measuring the line position and its count rate by fitting a Gaussian curve to the line profile. Taking the averages we carefully prevented the smoothing of variations of possible astrophysical origin. Coordinates refer to equinox B1950.0.
3 Results and discussion
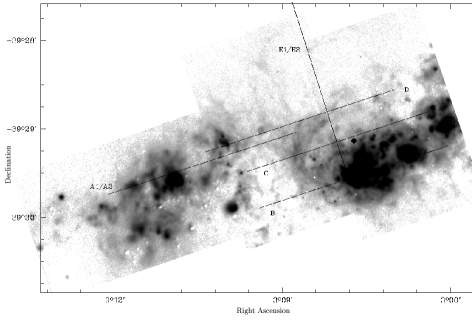
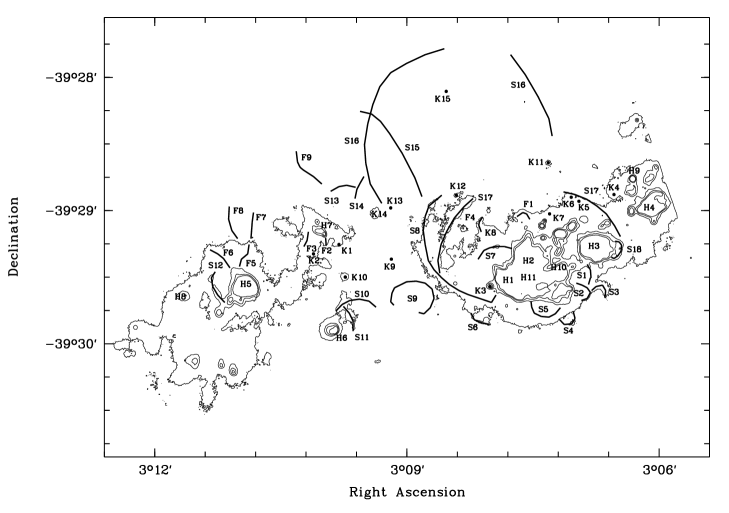
In Fig. 1 the central region of NGC 55 in H and the slit positions of the spectra are shown. The slits are parallel and perpendicular, respectively, to the disc. The center of rotation (lozenge in Fig. 1) was determined by H i measurements by Puche et al. (puch (1991)). All structures identified and named by capital letters (H = H ii region, S = shell, F = filament, K = knot) are shown in Fig. 2. We examined most of these structures spectroscopically.
3.1 Distribution of ionized gas
The integrated flux in H and NII is determined to be 2.810-11 erg sec-1 cm-2. The 3 detection limit in the H+[NII] image is 1.510-17 erg sec-1 cm-2/. Since the [NII] contribution is small (see Table 2), fluxes can be directly converted into emission measures (EM). Faint structures in Fig. 1 such as S16 are at this detection limit of EM20 pc cm-6, while the grey scale saturates at a level of EM=1100 pc cm-6.
Several large H ii regions are clearly visible in Fig. 1. Many shell-like structures seem to arise out of these H ii regions. The most striking features are the loop S8 with an extension of 540 pc (a distance of 2 Mpc is assumed throughout this paper) associated with the H ii complex H1/H2 and the superbubble S16. This bubble was discovered first by Graham & Lawrie (grala (1982)) in [O iii] 5007Å narrow band images. Corrected for the different distances used, the diameter of this superbubble was estimated by Graham & Lawrie to be 920 pc, which is similar to 960 pc determined by Ferguson et al. (fer (1996)). However, with our better spatial resolution we estimate its extension to be about 1270 pc. Our data have errors of 30–40 pc for larger features (130 pc). Another interesting shell is S17 with a radius of 410–520 pc. Most of the brightest H ii regions seem to lie inside this shell. This structure, however, is not closed; there is no boundary visible to the north of H1/H2. Diffuse gas seems to gush out of the shell as from a bursting balloon. The structures identified in Fig. 2 verify morphologically the model of diffuse gas ionized by H ii regions and pushed out into the halo by supernova explosions.
Nevertheless, not every shell-like structure has a corresponding H ii region, as the almost complete ring S9 shows. With a diameter of 170–230 pc this ring is too large to be a supernova remnant. One possible explanation for this feature is a source with a much shorter lifetime than the shell itself. Whether an ionizing source is hidden by dust can be checked in the future by NIR observations. Shells without visible source are also observed in other galaxies. However, it is still unknown, how these structures are formed and what their sources are (Hunter et al. hhg (1993)).
3.2 Spectroscopic data
After examining the structures of Fig. 1 and Fig. 2, respectively, we were able to identify most of them in the line profiles of our spectra. We calculated their line ratios, heliocentric velocities and their intrinsic line widths. We only used data with a signal-to-noise ratio of S/N3. Due to the interaction between NGC 55 and two neighbouring galaxies, the disc of NGC 55 is warped (Hummel et al. humm (1986)). Therefore its inclination is very uncertain, and it was impossible to calculate the exact distance of each structure to the midplane.
3.2.1 Relative velocities
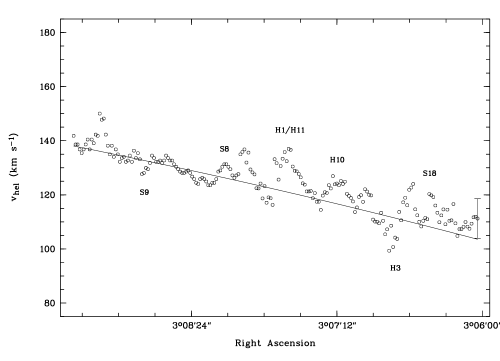
The emission lines of each spectrum yielded identical recession velocities along the slit within the errors of 0.16 Å (7 for H). Since H was the brightest line in each spectrum and could be traced along the entire slit, we used this line to get heliocentric recession velocities. These velocities were compared with the rotation curve (i.e. rotation velocity plus system velocity) fitted to H i measurements (Puche et al. puch (1991)). In Fig. 3 this comparison is shown for slit B. In all slits the DIG mostly corotates with the galaxy. Only the velocity of the diffuse gas in the vicinity of the shells S17 and S8 differs from galactic rotation. Thus, dynamics seems to play an important role in this area. To get velocities relative to the vicinity of each feature, we decided individually whether to use the rotation curve or the majority of the H ii motion as ambient velocity. Most of the H ii regions – fainter regions as well as brighter regions – have velocities of about 12 relative to the H i. These velocities are observed both as corrotation and antirotation. Unfortunately we do not have enough data to determine whether this result has a physical cause or whether it is just a random effect. However, most of the shells have relative velocities of 5–10 , whereas the DIG above the loop S8 inside the superbubble S16 is strongly blue shifted with relative velocities of more than 40 .
3.2.2 Line ratios
In the following we list for doublets the brighter component only, i.e. [S ii] 6716.4Å, [N ii] 6583.4Å and [O i] 6300.3Å.
| Name | Slit | Radius | ||||
|---|---|---|---|---|---|---|
| H1 | B | 0.0052 | 0.036 | 0.011 | 0.075 | |
| H1 | E2 | 0.0055 | 0.034 | 0.01 | 0.049 | |
| H3 | B | 0.0055 | 0.027 | 0.01 | 0.068 | |
| H5 | A2 | 0.004 | 0.039 | 0.011 | 0.063 | |
| H7 | D | 0.016 | 0.057 | 0.103 | ||
| H8 | A2 | 0.057 | 0.09 | |||
| H9 | C | 0.095 | ||||
| H10 | B | 0.0083 | 0.058 | 0.008 | 0.115 | |
| H11 | B | 0.004 | 0.026 | 0.01 | 0.068 | |
| K1 | A2 | 0.08 | 0.21 | |||
| K2 | A2 | 0.06 | 0.1 | |||
| K3 | B | 0.015 | 0.08 | 0.16 | ||
| K4 | C | 0.03 | 0.12 | 0.21 | ||
| K5 | C | 0.018 | 0.1 | 0.19 | ||
| K6 | C | 0.015 | 0.11 | 0.2 | ||
| K7 | C | 0.039 | 0.09 | 0.21 | ||
| K8 | C | 0.042 | 0.09 | 0.2 | ||
| K8 | E2 | 0.038 | 0.07 | 0.16 | ||
| K11 | D | 0.07 | 0.17 | |||
| K12 | D | 0.06 | 0.09 | |||
| K13 | D | 0.08 | 0.19 | |||
| K14 | D | 0.07 | 0.22 | |||
| S1 | 80 | |||||
| S2 | 100 | |||||
| S3 | 70 | |||||
| S4 | 100 | |||||
| S5 | 100 | |||||
| S6 | 130 | |||||
| S7 | E2 | 200 | 0.044 | 0.06 | 0.11 | |
| S8 | B | 540 | 0.08 | 0.19 | ||
| S8 | C | 540 | 0.09 | 0.16 | ||
| S8 | D | 540 | 0.06 | 0.11 | ||
| S9 | ∗230 | |||||
| S10 | 150 | |||||
| S11 | 120 | |||||
| S12 | A2 | 150 | 0.013 | 0.06 | 0.01 | 0.12 |
| S13 | 160 | |||||
| S14 | 170 | |||||
| S15 | A2 | 660 | 0.06 | 0.13 | ||
| S15 | D | 660 | 0.08 | 0.2 | ||
| S16 | A2 | 1270 | 0.06 | 0.13 | ||
| S16 | D | 1270 | 0.09 | 0.21 | ||
| S17 (E) | C | 520 | 0.06 | 0.13 | ||
| S17 (W) | C | 520 | 0.026 | 0.09 | 0.17 | |
| S17 | E2 | 520 | 0.13 | |||
| F1 | C | 0.043 | 0.08 | 0.19 |
Note: ∗ = diameter (in pc)
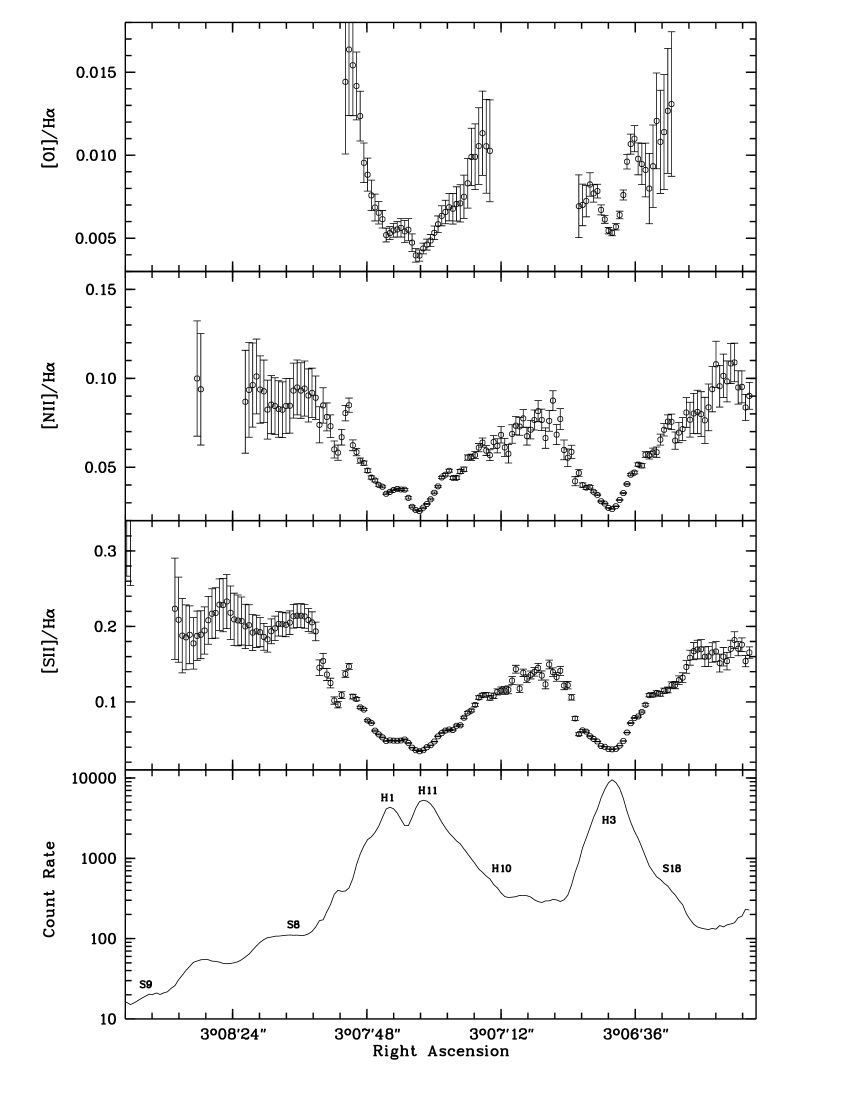
In Fig. 4 we show the different line ratios of slit B and the count rate of the H line. The run of the H intensity clearly demonstrates the contrast between H ii regions and the surrounding diffuse gas. If line ratios are compared to the H intensities, the same general behaviour can be observed along all slits: the larger the count rate or emission measure is, the lower are the line ratios. This was already shown for NGC 55 by Ferguson et al. (fer (1996)) in their Fig. 3, and it is also true when plotted against other lines, e.g. [S ii] and [N ii] (although we observe no gap between H ii regions and DIG like in Ferguson et al.). The line ratios reach a kind of saturation with increasing distance from the H ii regions. This can be observed for both line ratios of different emission lines (as shown in Fig. 4) and line ratios of different spectra.
Under the assumption of radiation bounded H ii regions, no ionization of diffuse gas by OB stars would be expected, and thus another ionization process has to be responsible for the H emission of the diffuse gas. If the H ii regions are density bounded, photons of the OB stars can still reach the diffuse gas surrounding the H ii regions. In this case, the photon field is very diluted and yields higher line ratios that do not increase with increasing distance of the H ii regions. This behaviour is observed in all line ratios of our spectra. Smaller variations in the line ratios can be explained by slight changes in the density and therefore in the opacity of the DIG, since the ionization parameter of photoionization models depends on the density of the gas (Domgörgen & Mathis domma (1994)).
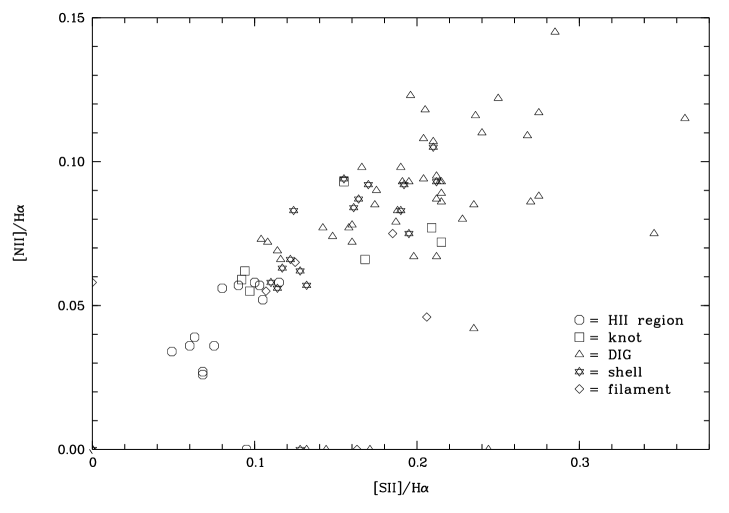
In Fig. 5 we compare the line ratios [N ii]/H and [S ii]/H with each other distinguishing between different features identified in the spectra. It is clearly visible that H ii regions have lower line ratios than the diffuse ionized gas. The line ratios of shell structures are in between and have a large spread reaching almost the values of the H ii regions and the lower values of the DIG. No difference in the line ratios could be established for DIG in the disc and DIG in the halo. The ratio [N ii]/[S ii] and thus the slope in Fig. 5 is almost constant (0.4). Therefore this ratio seems to be independent of the excitation process of nitrogen and sulfur (Goad & Roberts goad (1981)). In Table 1 the line ratios of the different structures and the radii of the shells are listed.
While it is not possible to derive the N/S ratio from the [N ii]/[S ii] ratio, changes in the ratio [N ii]/[S ii] can still partly reflect variations in the abundances of nitrogen and sulfur (Hawley & Grandi hagra (1977)). It is frequently argued that nitrogen is a secondary product of nucleosynthesis produced by stars of about 1 M⊙ developed from metal enriched clouds. On the contrary, sulfur is produced by massive stars of about 25 M⊙ developed from metal poor clouds (Rubin et al. rubin (1984)). Since late-type galaxies contain more massive stars than early-type galaxies (Kennicutt et al. keh (1989)), the ratio N/S should be lower in late-type galaxies, and so should be the ratio [N ii]/[S ii]. We summarized the [N ii]/H and [S ii]/H line ratios in Table 2 and compared them with line ratios of other galaxies. We measured somewhat lower line ratios for NGC 55 than Ferguson et al. (fer (1996)) (they found [S ii] line ratios of 0.05–0.3 for H ii regions and 0.2–0.7 for DIG). This can easily be explained by the fact that Ferguson et al. calculated [S ii]6716.4,6730.8Å/H+[N ii]6548.1,6583.4Å and that our line ratios are measured in the central region (with a denser photon field), whereas Ferguson et al. took mean values of the entire galaxy. However, as one can see in Table 2, most late-type galaxies (Sd, Sm) have lower [N ii]/[S ii] ratios than the early-type galaxies (Sa, Sb) – as predicted by the considerations above and confirmed by the line ratios given by Wang et al. (wang (1997)) (their Table 6). Due to the fact that NGC 55 has a relatively low star formation rate (0.3 M⊙ yr-1, Dettmar & Heithausen dehei (1989)) and that late-type galaxies and irregular galaxies had a rather constant star formation rate over a longer period (Kennicutt kenn (1983)), the nitrogen abundance decreases even more in NGC 55 and thus the ratio [N ii]/[S ii]. How sensitive this ratio is to variations in the nitrogen and sulfur abundances, is shown by model calculations by Domgörgen & Mathis (domma (1994)).
| Galaxy | Type | [S ii]/H | [N ii]/H | [N ii]/[S ii] | ||||
| min. | max. | min. | max. | |||||
| NGC 55, H ii | SB(s)m | 0.050.01 | 0.110.01 | 0.0250.001 | 0.0560.005 | |||
| NGC 55, DIG | 0.120.02 | 0.280.01 | 0.0650.010 | 0.120.01 | 0.4 | |||
| NGC 55, Shells | 0.11 | 0.21 | 0.055 | 0.095 | ||||
| IC 4662, H ii 1 | IBm | 0.0800.005 | 0.190.01 | 0.0350.004 | 0.0750.005 | |||
| IC 4662, DIG 1 | 0.1050.010 | 0.220.01 | 0.0550.005 | 0.1050.005 | 0.5 | |||
| IC 4662, Shells 1 | 0.12 | 0.17 | 0.058 | 0.062 | ||||
| IC 5052, H ii 1 | SBd | 0.0300.002 | 0.0800.005 | 0.0250.002 | 0.080.01 | 1.2 | ||
| IC 5052, DIG 1 | 0.120.02 | 0.170.02 | 0.100.01 | 0.1350.010 | ||||
| LMC, H ii 2 | 0.04 | 0.49 | 0.02 | 0.13 | 0.3–0.5 | |||
| LMC, Shells 2 | 0.06 | 0.84 | 0.03 | 0.24 | ||||
| NGC 4631, H ii 3 | SB(s)d | 0.12 | 0.13 | 0.09 | 0.17 | 0.5–1.3 | ||
| NGC 4631, DIG 3 | 0.36 | 0.50 | 0.18 | 0.49 | ||||
| NGC 891, H ii 4 | SA(s)b | 0.1 | 0.3 | 0.4 | 1.2–2.4 | |||
| NGC 891, DIG 4 | 0.25 | 0.60 | 0.4 | 1.1 | ||||
| MW, H ii 4 | 0.1 | 0.3 | 1.0 | |||||
| MW, DIG 4 | 0.3 | 0.5 | 0.3 | 0.5 | ||||
The low metallicity in late-type galaxies has two different effects on the line ratios. Since forbidden lines of metals are important cooling lines (Aller all (1971)), the gas has a higher temperature in galaxies of low metallicity, thereby increasing the strength of collisionally excited lines over the Balmer recombination lines. On the other hand low metal abundance leads to a hardening of the ionizing radiation due to less absorption in the UV and results in a higher ionization for low ionization species. Since we observe lower line ratios for metal poor galaxies, photoionization seems to be again the most important ionization process. The [N ii]/[S ii] however might also be affected by geometrical effects due to the very different ionization levels for these two species as discussed by Petuchowski & Bennett (pet1 (1993), pet2 (1995)).
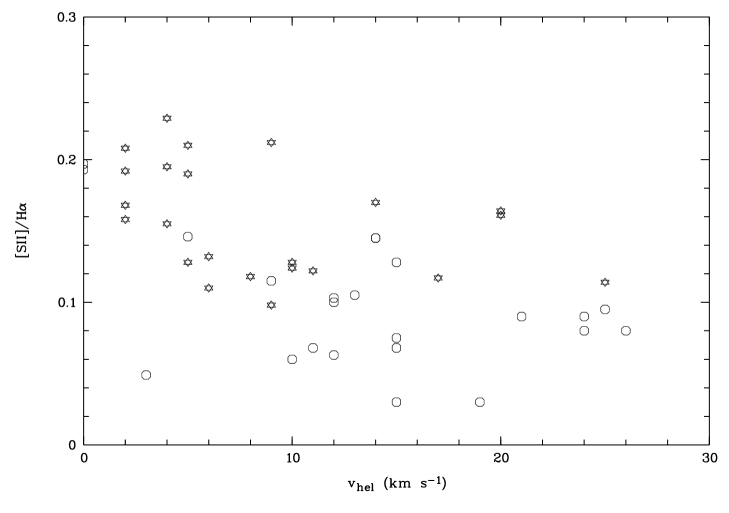
Due to the corotation of the eDIG with the disc and the observed shell structures reaching into the halo, the eDIG seems to be pushed out of the disc into the halo by supernova explosions. Therefore the question arises whether the diffuse gas can be ionized by shocks. Shock ionization produces much higher line ratios than photoionization (e.g. Peimbert et al. peim (1991)). The higher the expansion velocity of a shell is, the higher should be the line ratios due to shockionization. In Fig. 6 we compare the measured [S ii] line ratios of shells and H ii regions with their relative velocities. The trend for shells is more or less the reverse of what would be expected due to shockionization. The H ii regions show almost constant [S ii]/H ratios independent of their relative velocities. Thus, it seems to be unlikely that shockionization plays an important role in NGC 55.
Martin (mart (1997)) showed for her sample of 14 dwarf galaxies that photoionization of leaking H ii regions fits the lower line ratios, whereas additional emission from shock-excited gas is needed to explain the relatively high line ratios measured in lower surface brightness regions. Thus, it is still possible that we are missing very faint high velocity shock excited gas.
3.2.3 The superbubble
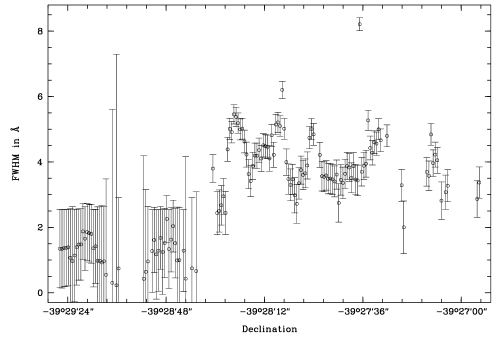
An interesting feature is the superbubble S16. Its line ratios in the lower part near the disc resemble the higher line ratios of the DIG (compare Tables 1 and 2). Unfortunately, the emission lines in the slits E1/E2 were too weak to calculate line ratios for the upper part of S16 at distances of more than 1 kpc above the disc. Nevertheless, it was possible to measure the H line at this height. As mentioned above, the DIG inside this bubble is blue shifted with relative velocities of more than 40 . At the same point where the relative velocity increases, the intrinsic line width (FWHM) increases rapidly from 1 Å up to about 4.25 Å (Fig. 7). The intrinsic line width generally is about 1 Å along all other slits. A FWHM of 4.25 Å corresponds to a velocity distribution of about 194 and therefore to an expansion velocity of at least 100 for the shell S16. The highest expansion velocity measured in the LMC is 68 (Hunter hunt (1994)).
Assuming that the density inside the superbubble S16 is low enough, photons of the OB stars in the H ii regions can ionize the diffuse gas high above the disc at the top of S16. This is valid also for the other shells observed.
Although NGC 55 and the LMC are very similar in most of their properties, they show slightly different properties in their shell populations. While the extent of LMC shells lies in the range of 35–1400 pc and their line ratios are 0.03–0.24 ([N ii]/H) and 0.06–0.84 ([S ii]/H), the ranges in NGC 55 are smaller for both the expansions of the shells (80–1270 pc) and the line ratios ([N ii]/H=0.055–0.095, [S ii]/H=0.10–0.21). Hunter (hunt (1994)) showed for the LMC, that the diffuse gas is ionized by photons of OB stars instead of shocks. However, one should note that this study refers to brighter DIG only.
4 Summary
In this paper we presented relative velocities and emission line ratios for various structures in the diffuse ionized gas of the late-type galaxy NGC 55 and compared these properties with each other and with properties of other galaxies. The essential results are summarized in the following.
-
•
Most of the H ii regions observed in NGC 55 have relative velocities of about 12 with regard to the ambient rotation velocity of NGC 55. The reason for this behaviour cannot be determined without more data. The in-plane shell structures have typical relative velocities of about 5–10 .
-
•
The observed kinematic and the shell structures indicate, that diffuse gas is expelled into the halo by supernova explosions or stellar winds.
-
•
Not every shell has a visible ionization source. Probably these shells have sources of shorter lifetimes. But the question remains, how these shells can stay in ionization equilibrium without visible ionizing sources.
-
•
Shockionization cannot play an important role in the ionization processes of the diffuse gas. The low metallicity, the coherence between the [S ii] line ratios and the relative velocities, the low line ratios themselves, the similarity between NGC 55 and the LMC, all indicate that photoionization is the most important ionization process in NGC 55.
-
•
The diffuse ionized gas in the disc and the eDIG do not differ from each other with regard to their line ratios. We have not found any evidence that it would be necessary to distinguish between a “quiescent” DIG and a “disturbed” DIG as Wang et al. (wang (1997)) did.
-
•
There seems to be a relationship between the Hubble-type of a galaxy and its line ratios. Late-type galaxies and irregular galaxies have lower line ratios than early-type galaxies. The [N ii]/[S ii] ratio is lower for late-type galaxies. Both are in accord with expectations for low metallicity environments.
Acknowledgements.
We thank R. J. Reynolds, J. S. Gallagher, D. Bomans and M. Rosa for their comments on early drafts of this paper. We also thank the referee J.-P. Sivan for his suggestions and comments which improved the paper. B. O. is thankful to her colleagues in the Department of Astronomy for their friendly support while writing this paper.References
- (1) Aller, L. H., 1971, Atoms, Stars, and Nebulae
- (2) Dettmar, R.-J., 1992, Fundamentals of Cosmic Physics, Vol. 15, 143
- (3) Dettmar, R.-J., Heithausen, A., 1989, ApJ 344, L61
- (4) Domgörgen, H., Mathis, J. S., 1994, ApJ 428, 647
- (5) Ferguson, A. M. N., Wyse, R. F. G., Gallagher III, J. S., 1996, AJ 112, 2567
- (6) Gies, D. R., 1987, ApJS 64, 545
- (7) Goad, J. W., Roberts, M. S., 1981, ApJ 250, 79
- (8) Golla, G., Dettmar, R.-J., Domgörgen, H., 1996, A&A 313, 439
- (9) Graham, J. A., Lawrie, D. G., 1982, ApJ 253, L73
- (10) Hawley, S. A., Grandi, S. A., 1977, ApJ 217, 420
- (11) Hummel, E., Dettmar, R.-J., Wielebinski, R., 1986, A&A 166, 97
- (12) Hunter, D. A., Hawley, W. N., Gallagher III, J. S., 1993, AJ 106, 1797
- (13) Hunter, D. A., 1994, AJ 107, 565
- (14) Kennicutt, R. C., 1983, ApJ 272, 54
- (15) Kennicutt Jr., R. C., Edgar, B. K., Hodge, P. W., 1989, ApJ 337, 761
- (16) Martin, C. L., 1997, ApJ 491, 561
- (17) Norman, C. A., Ikeuchi, S., 1989, ApJ 345, 372
- (18) Otte, B., 1996, Diploma-thesis, Ruhr-Universität Bochum, Germany
- (19) Peimbert, M., Sarmiento, A., Fierro, J., 1991, PASP 103, 815
- (20) Petuchowski, S. J., Bennett, C. L., 1993, ApJ 405, 591
- (21) Petuchowski, S. J., Bennett, C. L., 1995, ApJ 438, 735
- (22) Puche, D., Carignan, C., Wainscoat, R. J., 1991, AJ 101, 447
- (23) Rand, R. J., Kulkarni, S. R., Hester, J. J., 1990, ApJ 352, L1
- (24) Reynolds, R. J., 1985, ApJ 294, 256
- (25) Rubin, V. C., Ford Jr., W. K., Whitmore, B. C., 1984, ApJ 281, L21
- (26) Sciama, D. W., 1990, ApJ 364, 549
- (27) Shapiro, P. R., , Field, G. B., 1976, ApJ 205, 762
- (28) Sivan, J.-P., Stasińska, G., Lequeux, J., 1986, A&A 158, 279
- (29) Wang, J., Heckman, T. M., Lehnert, M. D., 1997, ApJ 491, 114