Abstract
Hierarchical structure formation models predict the existence of large numbers of low velocity dispersion dark halos. Galaxy surveys find far fewer galaxies than predicted by analytical estimates and numerical simulations. In this paper, we suggest that these dark halos are not missing, but have been merely misplaced in the galactic astronomy section of the journals: they are the High Velocity Clouds (HVCs). We review the predictions of our model for the Local Group origin of the HVCs and its implications for the formation and the evolution of our Galaxy. We describe recent observations that confirm many of earlier predictions and discuss future tests of the model.
1 The Missing Galaxy Problem
A generic prediction of hierarchical structure formation models is the existence of large numbers of low mass halos. The Press-Schechter formalism (Press & Schechter 1974) predicts that the galaxy mass function,
| (1) |
has a steep faint end slope, . Numerical simulations (Efstathiou et al. 1988; Gelb & Bertschinger 1994, Klypin et al. 1999) are consistent with the Press-Schechter approach: they also predict copious low mass halos.
Most galaxy surveys, however, do not seem to find large numbers of low luminosity, low velocity dispersion galaxies. Loveday (1998) summarizes a number of recent field surveys that find a faint end slope in the range . Groups have similar “flat” galaxy luminosity functions with slopes typically (Muriel, Valotto & Lambas 1998). While surveys that reach lower surface brightness limits find more dwarf galaxies (Bothun, Impey & McGaugh 1997, Dalcanton et al. 1998), even the inclusion of these systems does not appear to increase the faint end slope enough to reconcile theory and observation.
In our own Local Group, where the galaxy inventory is thought to be essentially complete, the discrepancy is even more severe. Simulations at the appropriate scale suggest that the Local Group should contain roughly 1000 objects with velocity dispersions larger than 10 km s-1(Klypin et al. 1999). Observers however have only been able to find galaxies in the Local Group (Mateo 1998).
Where are the missing dark halos? There is either something wrong with hierarchical structure formation, the numerical simulations, or there are a host of unidentified bound systems in the Local Group.
What are the likely properties of these low velocity dispersion halos? Star formation is likely to be inefficient in these low luminosity systems because the cosmological ultraviolet background can prevent or at least delay the formation of atomic and molecular hydrogen (Babul & Rees 1992; Kepner, Babul & Spergel 1997; Barkana & Loeb 1999). If these missing galaxies have not formed stars, they likely persist as small bound objects containing mostly ionized hydrogen and possibly a handful of stars. These dark halos may be the High Velocity Clouds (HVCs).
The HVCs are clouds of atomic hydrogen detected primarily by means of their 21-cm emission that cannot be in circular rotation about the Galactic Center. Because they are largely found at high Galactic latitude, and because the HI layer of the Milky Way is so thin, the characteristic distance to the HVCs can, in principle, be anywhere between several hundred parsecs and 1 Mpc. In this paper, we will argue that the evidence points to a Local Group origin for the HVCs. Oort’s (1964) original idea that the clouds represent infall onto the Milky Way was abandoned long ago because of the discovery of HVCs with positive galactocentric velocities. Nevertheless, we will argue that his insight that the HVCs represent the unaccreted remnants of galaxy formation is largely correct. We will also offer some speculations on the implications of the Local Group origin. A fuller, more detailed account of the arguments presented in this paper may be found in Blitz et al. (1999a). Some of the arguments in this article have already appeared as Blitz et al. (1999b).
2 Evidence for a Local Group Origin
2.1 Kinematic Data
The flux from HVCs is less than 10-4 of the normal Galactic emission. In the outermost parts of the Milky Way, a longitude-velocity plot of the normal Galactic emission shows that the contours are very nearly sinusoidal. The radial velocity, of the gas in circular orbit around the center obeys:
| (2) |
where is the circular velocity of a gas parcel at a distance from the Galactic Center, and where is the distance of the Sun from the Center. Thus, for gas close to the plane (cos 1), sinusoidal profiles for a flat rotation curve are indicative of gas at constant radius. Conversely, the galactocentric distance of gas along a sinusoid can be inferred from its maximum velocity (sin cos = 1). Longitude-velocity plots from the Leiden-Dwingeloo survey (Hartmann & Burton 1997) exhibit HI emission with maximum velocities of about 170 km s-1 (Blitz et al. 1999), implying that for a flat rotation curve, the HI disk of the Milky Way extends to a distance of 37 kpc from the Galactic Center.
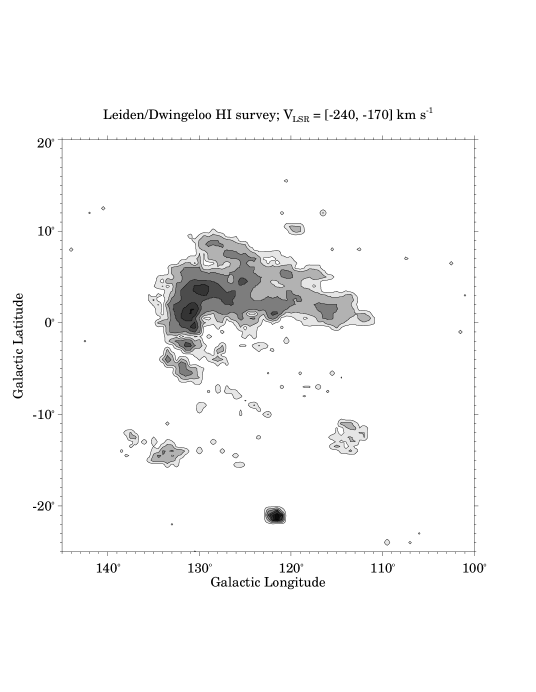
Although most of the HVCs are far from the Galactic plane, one large cloud known as Complex H (after Aad Hulsbosch who has spent years observing and categorizing the HVCs), lies directly in the plane and is shown in Figure 1. The velocity centroid of this cloud is –194 km s-1. If it were within the HI disk, the velocity difference between this cloud and the gas in normal galactic rotation would be between 30–200 km s-1 giving rise to a very large region of highly shocked gas with an energy of 1054 ergs, nearly independent of distance over a large portion of the disk. This much energy would give rise to a region of disturbed gas in the HI disk at least 25 degrees in extent as well as giving rise to strong H and perhaps x-ray emission, but none of these is evident. Cloud H must therefore lie beyond the HI disk at a distance of at least 40 kpc from the center. If it is at a distance of 50 kpc, the cloud has a diameter of 20 kpc, and an HI mass of 9 M⊙, a huge HI cloud comparable in mass to a dwarf spheroidal galaxy. If this cloud is typical of the others, then the typical distance of the HVCs will be 25 times larger (since the median angular size of the HVCs is 25 times smaller) and the reservoir of HI locked up in the HVCs is enough to make a Milky Way-sized galaxy.
The velocity dispersion and the velocity centroid of the cloud ensemble can also be used to determine what the most appropriate inertial frame of reference is. A non-inertial frame always gives rise to a larger velocity dispersion than an inertial frame because the former adds a position-dependent velocity in quadrature to each observed radial velocity. A non-zero velocity centroid suggests that the ensemble is moving relative to the observer. Figure 2 shows the distribution of the velocities of the HVCs in the LSR and GSR frames of reference; the latter are much smaller and suggest that the Galactic Center is a better inertial frame than the Local Standard of Rest. The mean velocity of –46 7 km s-1 implies that the Galactic Center is moving with respect to the barycenter of the ensemble. If we concentrate on the clouds with negative velocities seen in the lower panel of Figure 3, the centroid of these clouds is close to the Local Group barycenter ( = 147∘, = –25∘, = –82 km s-1). Relative to the LSR, the mean velocity of this group of clouds is –173 km s-1, relative to the GSR, it is –88 km s-1. However, relative to a frame of reference centered on the barycenter of the Local Group, the LGSR, the mean velocity is only –28 10 km s-1. These numbers suggest that the barycenter of the Local Group is the proper inertial frame for the HVCs and that the Milky Way is approaching the barycenter at a velocity of about 60–90 km s-1.


Recently, Burton & Braun (this volume) and Braun & Burton (1999) have suggested that there is a separate class of HVCs which they call “Compact HVCs” or CHVCs that are different from those discussed and analyzed above, but somehow share the kinematic properties of the conventional HVCs. In fact, the Burton & Braun clouds are simply a subset of the HVCs compiled by Wakker & van Woerden (1991) with a few additional clouds that fall between the latter’s sampled points. Even though the clouds listed in Burton & Braun are chosen from the smallish end of the Wakker & van Woerden sample, the former have a median surface area 1.0 deg2 compared to 1.5 deg2 for the Wakker & van Woerden sample (Blitz et al. 1999), and are not more compact than the typical HVCs. Even this difference may result largely because Braun & Burton use the beam deconvolved area and Blitz et al. (1999a) do not. In any event, the small difference hardly warrants a new designation. Apparently, Burton & Braun have succeeded in showing that a representative subset of HVCs has properties of and behaves similarly to the HVC population as a whole.
2.2 Dynamical Simulation
The Local Group is dynamically simple, thus it should be possible to simulate the dynamical history of the HVCs and reproduce both the spatial and kinematic distribution of the clouds. Since 98% of the mass of the Local Group is in the Milky Way and M31, we modelled the Local Group in Blitz et al. (1999a) as a modified, restricted 3-body system with the HVCs as test particles in a potential defined by the Galaxy and M31. The simulation begins with the HVCs on a regular grid and no initial velocity dispersion. The Milky Way and M31 are separated initially by 100 kpc and expand with the Hubble flow; M31 is taken to have twice the mass of the Milky Way. Enough mass is put into the two galaxies so that they are turned around from the Hubble flow until they reach their present separation and velocity of approach. After the start of the simulation, if a particle comes within 100 co-moving kpc of either galaxy, we assume that the cloud is accreted. This allows for a somewhat larger interaction radius than the geometric cross-section of the galaxies to allow for gravitational focusing, tidal disruption and dynamical friction.
The basic results of the model are insensitive to the exact value of the relative masses of the two galaxies, or the accretion radius. The model is exceedingly simple and contains no hydrodynamics (the test particles are non-interacting), though it is not self-consistent in that all of the mass is placed in the two galaxies at t=0 and accretion does not increase the masses of the galaxies. These shortcomings are compensated by the simplicity of the model. It contains no free parameters and no fine tuning is done to improve the comparison with the observations.

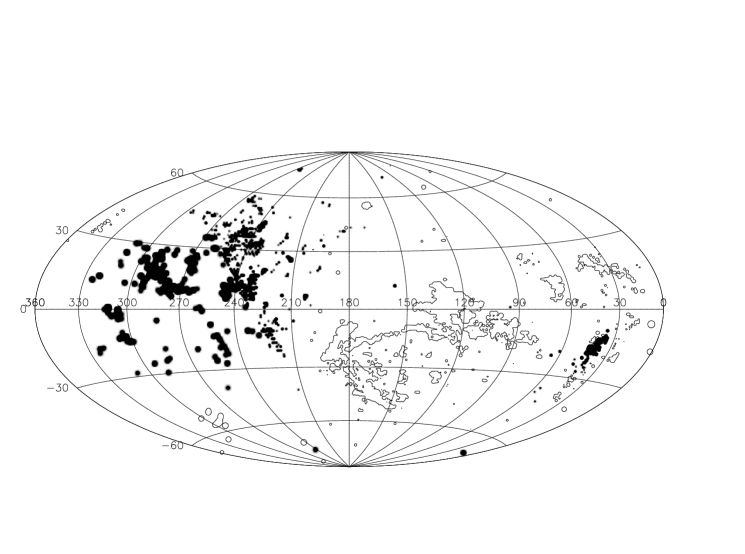
The results are shown in Figures 3 and 4. Figure 3 is a comparison of the simulated and observed spatial distributions of the HVCs with the Magellanic Stream and the A, C and M complexes removed. The comparison shows a rather good agreement considering the simplicity of the model. The model reproduces the two concentrations of clouds, the separation into positive and negative LSR velocities and the tilt in the positive and negative velocity cloud groups relative to the Galactic Plane. No extraneous groups of clouds are produced. No other model considered to date reproduces all of these features of the HVC spatial distribution. The separation into two groups occurs naturally in the model because the clouds are distributed along a wide filament along the line connecting the Milky Way and M31. The negative LSR velocity clouds are seen along the filament towards the Local Group barycenter, and the positive LSR velocity clouds are seen primarily in the antibarycenter direction. Both groups are falling toward the LGSR.


The Magellanic Stream was removed from the comparison because it is a group of clouds known to be of tidal orgin (Mathewson et al. 1974) and is thus not well represented by our model. Cloud C is by far the largest cloud in the HVC ensemble and covers more than 1600 deg2. Clouds A and M, which are also quite large, have similar velocities and may be related to this large complex. If the A, C and M complex is gravitationally bound, it must be tidally unstable and thus quite nearby. The complex is also very elongated, consistent with tidal shearing. Thus, because of its apparent proximity and tidal shearing, it is also not well represented by our dynamical model and is also excluded from the comparison.
Figure 4 is a comparison of the longitude-velocity plot of the observations and the simulations. Again, the Magellanic Stream and the A, C and M Complex are removed. The simulations reproduce the sinusoidal envelope of the cloud ensemble, the offset toward negative LSR velocities (due to the motion of the Milky Way toward the Local Group barycenter) and the magnitude of the envelope of the distribution. This agreement in the quantitative aspects of the distribution are particularly noteworthy because of the absence of free parameters in the model.
3 Implications and Speculations
If we accept the model at face value, it implies that the HVCs are formed with the earliest structures in the Universe and are the building blocks from which the Milky Way and M31 formed. The HVCs that we see today would then be the leftover building blocks that have not yet been accreted by either galaxy. If the Local Group is not unique, it suggests that structures similar to the HVCs are responsible for all initial galaxy formation, though there would be large differences in how galaxy evolution proceeds depending on the density of the environment (see below).
If the HVCs are almost as old as the Universe, they must be gravitationally bound and tidally stable. If they have typical distances of 1 Mpc as the model suggests, then the observed angular sizes and velocity dispersions imply that to be self-gravitating, about 90% of the matter in the HVCs must be dark; the dark matter may be either baryonic or non-baryonic. Table 1 gives mean derived parameters for the HVCs. For example, the clouds could have a 90% ionization fraction, in which case the emission measure would be cm-6 pc, an undetectable value at present. if the dark matter is the same as that in the halo of the Milky Way and M31, the ratio of luminous to dark matter is comparable in the HVCs and the galaxies, just what one would expect if the Milky Way and M31 were assembled from HVCs. In this case, the HVCs would also have characteristic masses of M⊙, similar to the mini-halos postulated by Ikeuchi (1986) and Rees (1986) to be the first structures to form after recombination.
Quantity Value HI mass 1.9 M⊙ Total Neutral Gas Mass 2.7 M⊙ Total Mass 2.8 M⊙ Diameter 28 kpc Distance 1 Mpc cm-3
Our dynamical model allows us to calculate a mass accretion history, which is shown in Figure 5. The present day mass accretion rate is estimated to be 0.8–1.2 M⊙ yr-1, approximately what is needed to fuel the present day star formation in the Milky Way (e.g., Blitz 1995). The orbits of some of the HVCs are likely to cross in the region between M31 and the Galaxy, giving rise to collisions between the HVCs. Typical collision velocities can be estimated from Figure 2 to be 200 km s-1 possibly giving rise to an x-ray halo surrounding the Milky Way and M31. This gas would probably have a temperature of about 106 K, and might be detectable. To predict whether or not such an x-ray halo exists, and how large it would be requires adding hydrodynamics to our simulation. The cooling time for the gas would be 1010 yr. Collisions between clouds could also be the source of the x-ray halos around poor groups and in denser extragalactic environments.

In our picture, the growth of the Galactic disk is fueled by the gradual accretion of HVCs and is consistent with numerical simulations. Figure 6, for example, shows the results of a hydrodynamical simulation in which a cloud similar to Complex H is being accreted by a disk galaxy similar to the Milky Way. The gas streamer shown in the simulation is similar to that seen in higher contrast versions of Figure 1. Our picture of Milky Way formation is thus more consistent with the episodic accretion model of Searle and Zinn (1968) than it is with the Eggen, Lynden-Bell and Sandage (1962) model. Episodic evolution, furthermore, would lead to metallicity correlations consistent with trends seen in disk stars (Edvardsson et al. 1994).

Finally, the HVCs might be the z=0 analogues of the Ly absorbing systems. If the HVCs are indeed ubiquitous in the Universe, they would correspond in column density to the Lyman limit systems. The frequency distribution of the Ly absorbers is a power law with a slope of –1.4 over 8 orders of magnitude in column density (Wolfe 1993). The slope of the frequency distribution of column densities in the HVCs has the same value of –1.4.
4 Predictions and Comparison with other Observations
In our original paper (Blitz et al. 1999a), we made several predictions based on our model.
-
1.
The HVCs should have substantially sub-solar metallicities. These are not expected to be zero, since no extragalactic gas has primordial abundances.
-
2.
The HVCs should have low internal pressures, inconsistent with a Galactic origin. If the clouds are self-gravitating, then the internal pressure within the clouds can be given by
(3) where is the gas surface density, = 2 for self-gravitating clouds, and k is Boltzmann’s constant (Bertoldi & McKee 1992). For self-gravitating HVCs bound by their HI alone and a surface density of cm-2, the expected mean hydrostatic pressure within a cloud is expected to be 0.016 – 1.6 K cm-3. If the cloud is in a dark matter potential with 10 times the HI mass, as we expect, the internal pressure would be about 10 times higher, thus pressures of the order of 0.1 – 10 K cm-3 are expected.
-
3.
There should be extragalactic analogues of the HVCs in other extragalactic systems.
-
4.
There should be H emission associated with the HVCs at a level at least as great as that detected toward the clouds in the Magellanic Stream if the HVCs are Galactic in origin. If they are extragalactic, the emission measures should be 0.1 cm-6 pc.
In the past few months, several groups have reported new observations that are consistent with our predictions and appear to contradict the models with a Galactic HVC origin such as the Galactic fountain model:
-
1.
Wakker et al. (1999) recently reported a measurement of sub-solar metallicity on a line of sight toward Mrk 290 in Complex C. They detected SII, a species in the dominant ionization state and which is not depleted onto grains. Wakker et al. obtained values for both the atomic and ionized gas components and concluded that the abundance along this line of sight is only 0.094 solar. They concluded that this cloud represents an accretion event of an extragalactic cloud, in agreement with our predictions. Complex C has by far the largest angular size of any HVC, and is probably the nearest. If this cloud is of extragalactic origin, it suggests that the other smaller clouds are also extragalactic.
-
2.
Sembach et al. (1999) observed the ionized edges of HVCs in the direction of Mrk 509 and PKS 2155-304 and detected strong C IV absorption, with little or no CII or SiII. The authors concluded that the clouds are low density (nH 10-4 cm-3), large (greater than several kiloparsecs) clouds with P/k 2 K cm-3. This pressure is just in the range expected for self-gravitating, dark matter confined HVCs, is four orders of magnitude less than the pressure in the midplane of the Milky Way and two orders of magnitude less than expected in the Galactic halo (Wolfire et al 1995). The density is also in good agreement with the derived value given in Table 1.
TABLE 2. : Extragalactic HVC Analogues Mass Diameter Galaxy Reference M⊙ kpc 16 M101 van der Hulst & Sancisi (1988) 5 M101 van der Hulst & Sancisi (1988) 25 NGC 5668 Schulman et al. (1996) 7 UM422C Taylor et al. (1995;1996a) (?) 16 (?) UM 456B Taylor et al. (1995;1996a) (?) 8 (?) F495-IVB Taylor et al. (1996b) 38 NGC 628 Kamphuis & Briggs (1992) 47 NGC 628 Kamphuis & Briggs (1992) 6 NGC 3227 Mundell et al. (1995) 28 Local Group This paper; Table 1
-
3.
Extragalactic analogues of the HVCs have been seen toward a number of galaxies. A list of such clouds is given in Table 2. These clouds were found serendipitously in the course of mapping other objects. Many are seen in projection against other galaxies, some are seen as distinct objects separated in both position and velocity from the parent galaxy. Such clouds would appear as HVCs if viewed from the target galaxy. Clearly numerous extragalactic HI clouds have been found with properties similar to those of the HVCs given in Table 1.
Several blind surveys of HI have been undertaken, notably by Zwaan et al. (1996), and more recently by Spitzak & Schneider (1999). In the Zwaan et al. survey, no extragalactic analogues were found without optical counterparts. Spitzak & Schneider found one cloud without an optical counterpart. Neither survey is particularly sensitive to HI masses typical of what we expect from extragalactic HVCs, though a few probably should have been detected in the Zwaan et al. survey if it is as sensitive as was claimed. It is difficult to predict how many HVC analogues should be detected since the number associated with a galaxy group or cluster probably depends sensitively on the density of the environment. It is therefore difficult to assess whether the non-detections in the blind searches (except for Spitzak & Schneider) are significant. A targeted, high sensitivity survey in the direction of a good Local Group analogue might well decide this issue.
-
4.
H has been detected toward Clouds A, C and M (Tufte et al. 1998) as well as toward the Magellanic Stream (Weiner & Williams 1996). There is some question of whether the emission toward the Magellanic Stream is due to photoionization from the Galactic ionizing radiation that leaks out of the plane of the Milky Way, or is due to shock heating from the clouds as they pass though the diffuse gas in the Galactic Halo. However, regardless of what produces the H, HVCs that are of Local Group origin should have lower emission measures than those detected toward either cloud complex. The H measurements are a critical test of the Local Group model and observations toward the very high velocity clouds ( km s-1) should give emission measures no higher than 0.1 cm-6 pc. Measurements are currently underway by the Wisconsin group using their WHAM instrument, by a Maryland–Carnegie group and by a group in Australia. If the HVCs are Galactic (distances 50 kpc), their H surface brightnesses should be at least as large as those already detected. Results should be available within the next year.
The low metallicity, pressure and density detected along several lines of sight support a Local Group origin. The detection of extragalactic HI clouds with properties similar to those inferred if the HVCs are Local Group objects suggests that such clouds do exist in intergalactic regions. The relative paucity of HVC analogues seen in blind HI surveys may simply be a result of insufficient sensitivity or sky coverage, and more sensitive observations perhaps directed toward poor galaxy groups might usefully be undertaken. H measurements will provide a critical test which should be able to distinguish between Galactic or extragalactic locations for the HVCs.
5 Other Possible Origins
One possibility other than a Local Group origin for the HVCs is that the clouds are extensive tidal debris from either previous passages of the Magellanic clouds or other nearby dwarfs. Bland-Hawthorne et al. (1998) have recently suggested that the so-called “Smith Clouds” are related to tidal streaming associated with the passage of the Sgr dwarf (Ibata, Gilmore & Irwin 1994). However, an important constraint on tidal models is the crossing time for HVCs which can be written as follows:
| (4) |
where rkpc is the distance from the Galactic Center in kpc and v is the FWHM of the HI line averaged over the cloud. The mean value of v for the HVCs is 30 km s-1, and the median value of is 1.5 deg2 (Blitz et al. 1999). Thus the crossing time for a typical HVC is about 1 Myr/kpc, or about 50 Myr at the distance of the Magellanic clouds. HVCs at that distance cannot be gravitationally bound (except perhaps for Complex C, H and the Anticenter Complex). Clouds at 50 kpc therefore double in size in a crossing time which corresponds to a decrease in density of an order of magnitude. Thus HVCs from a tidal origin should not be able to survive for more than 1 – 2 crossing times. The orbital time for the Magellanic clouds is about 200 Myr, far too long for HVCs to have been the result of a prior passage. The Magellanic stream itself has a much larger than the typical HVC and thus has a longer crossing time. Nevertheless, the Magellanic Stream is identified over only about 1/4 of the sky, suggesting that even those HI clouds are destroyed in about 50 Myr. No other dwarf companions are close enough to the Milky Way to have produced the extensive tidal debris that would be necessary to explain the HVCs.
The Galactic fountain model postulates that the HVCs are HI clouds which have condensed from gas expelled into the halo by supernovae and stellar winds (Shapiro & Field 1976; Bregman 1980). It has long been known that the Galactic fountain model cannot produce HI clouds with radial velocities in excess of the circular speed of the Galaxy of about 220 km s-1. Many HVCs have significantly larger velocities. Furthermore, the recent evidence for low HVC pressures and densities, the low metallicities, and the inability of the fountain models to reproduce the observed features seen in Figures 3 and 4 make the Galactic fountain untenable for the majority of HVCs. Nevertheless, even the Local Group model seems to produce insufficient numbers of clouds at low LSR velocities (clouds near Vlsr = 100 km s-1 – see Figure 4). Some of these clouds are not fully separated in velocity from the main Galactic emission and may therefore yet be part of the normal Galactic emission or a Galactic fountain phenomenon. Just as H measurements become a good test of the Local Group origin for the HVCs, it may be that the lower velocity HVCs will be relatively bright H emitters.
References
- [Babul92] Babul, A. & Rees, M.J. 1992, MNRAS, 255, 346
- [Bertoldi92] Bertoldi, F. & McKee, C.F. 1992, ApJ, 395, 140
- [Bland98] Bland-Hawthorne, J., Veilleux, S. Cecil, C.G., Putman, M.E., Gibson, B.K., & Maloney, P.R. 1998, MNRAS, , 299, 611
- [Blitz95] Blitz, L. 1995 in CO: Twenty-Five Years of Millimeter-Wave Spectroscopy, W.B. Latter et al. eds., p.11
- [Blitz99a] Blitz, L., Spergel, D.N., Teuben, P.J., Hartmann, D., & Burton, W.B. 1999a, ApJ, 514, 000
- [Blitz99b] Blitz, L., Spergel, D.N., Teuben, P.J., Hartmann, D., & Burton, W.B. 1999b, to appear in the Proceedings of the Stromlo Workshop on High-Velocity Clouds, ed. B.K. Gibson and M.E. Putnam, ASP Conference series, in press.
- [Braun99] Braun, R. & Burton, W.B. 1999, A&A, submitted
- [Burton99] Burton, W.B. & Braun, R. 1999, (this volume)
- [Bregman80] Bregman, J.N. 1980, ApJ, 236, 577
- [Dalcanton97] Dalcanton, J.J., Spergel, D.N., Gunn, J.E., Schmidt, M. & Schneider, D.P. 1997, AJ, 114, 2178
- [Edvardsson93] Edvardsson, B., Anderson, J., Gustafsson, B., Lambert, D.L., Nissen, P.E., & Tomkin, J. 1993, A&A 275, 101
- [Efstathiou88] Efstathiou, G., Frenk, C.S., White, S.D.M. & Davis, M. 1988, MNRAS, 235, 715
- [Eggen62] Eggen, O.J. Lynden-Bell, D. & Sandage, A. 1962, ApJ, 136, 748
- [Gelb94] Gelb, J.M. & Bertschinger, E. 1994, ApJ, 436, 467
- [Hartmann97] Hartmann, D., & Burton, W.B. 1997, Atlas of Galactic Neutral Hydrogen, (Cambridge: Cambridge Univ. Press)
- [Ibata94] Ibata, R., Gilmore, G., & Irwin, M. 1994 Nature, 370, 19
- [Ikeuchi86] Ikeuchi, S. 1986, Ap&SS 118, 509
- [Kamphuis92] Kamphuis, J., & Briggs, F. 1992, A&A, 253, 335.
- [Kepner97] Kepner, J.V., Babul, A. & Spergel, D.N. 1997, ApJ, 487, 61
- [Kepner98] Kepner, J.V. 1998. Ph.D. Thesis, Princeton University, Princeton, NJ
- [Klypin99] Klypin A.A., Kravtsov, A.V., Valenzuela, O., Prada, F., 1999, astro-ph/9901240.
- [Loveday98] Loveday 1998, To appear in Proceedings of the XVIIIth Moriond astrophysics meeting “Dwarf Galaxies and Cosmology”, eds. Thuan et al, Publ: Editions Frontiers, astro-ph/9805255.
- [Majewski93] Majewski, S.R. 1993 Ann. Rev. Astron. & Astrophys.31, 575
- [Mathewson74] Mathewson, D.S., Cleary, M.N. & Murray, J.D. 1974, ApJ, 190, 291
- [Mateo98] Mateo, M. 1998, Ann. Rev. Astron. & Astrophys.36, 435
- [Mundell95] Mundell, C.G., Pedlar, A., Axon, D.J., Meaburn, J. & Unger, S.W. 1995, MNRAS, 277, 641
- [Muriel98] Muriel, H., Valotto, C.A. & Lambas, D.G. 1998, ApJ, 506, 540
- [Press74] Press, W. H., & Schechter, P. L. 1974, ApJ, 330, 579
- [Rees86] Rees, M.J. 1986, MNRAS, 218 25P
- [Schulman96] Schulman, E., Bregman, J.N., Brinks, E., & Roberts, M.R. 1996, AJ, 112, 960
- [Searle78] Searle, L. & Zinn, R. 1978, ApJ, 225, 357
- [Sembach99] Sembach, K., Savage, B.D., Lu, L. & Murphy, E.M. 1999, ApJ, submitted
- [Shapiro76] Shapiro, P.R., & Field, G.B. 1976, ApJ, 205, 762
- [Spitzak99] Spitzak, J.G. & Schneider, S., 1999, ApJ, submitted
- [Taylor95] Taylor, C.L., Brinks, E., Grashuis, R.M., & Skillman, E.D. 1995, ApJS, 99, 427
- [Taylor96] Taylor, C.L., Brinks, E., Grashuis, R.M., & Skillman, E.D. 1996, ApJS, 102, 189
- [Tufte98] Tufte, S.L., Reynolds, R.J., & Haffner, L.M. 1998, ApJ, in press
- [vanderHulst88] van der Hulst, J.M., & Sancisi, R. 1988, AJ, 95, 1354
- [Verschoor69] Verschuur, G.L. 1969, ApJ, 156, 771
- [Wakker91] Wakker, B.P., & van Woerden, H. 1991, A&A, 250, 509
- [Wakker99] Wakker, B., et al., 1999, ApJ, submitted
- [Weiner96] Weiner, B.J., & Williams, T.B. 1996, AJ, 111, 1156
- [Wolfe93] Wolfe, A.M., 1993, in Relativistic Astrophysics and Cosmology, eds. C.W. Akerlof & M.A. Srednicki (New York: NY Academy of Science), 281
- [Wolfire95] Wolfire, M.G., McKee, C.F., Hollenbach, D., & Tielens, A.G.G.M. 1995, ApJ, 453, 673
- [Zwaan96] Zwaan, M.A., Briggs, F.H., Sprayberry, D., and Sorar, E. 1996, ApJ, 490, 173