The fraction of double degenerates among DA white dwarfs.
Abstract
We present the results of a radial velocity survey designed to measure the fraction of double degenerates among DA white dwarfs. The narrow core of the H line was observed twice or more for 46 white dwarfs yielding radial velocities accurate to a few . This makes our survey the most sensitive to the detection of double degenerates undertaken to date. We found no new double degenerates in our sample, though emission from distant companions is seen in two systems. Two stars known to be double degenerates prior to our observations are included in the analysis. We find a 95% probability that the fraction of double degenerates among DA white dwarfs lies in the range .
keywords:
white dwarfs – binaries: spectroscopic – stars: rotation – binaries: evolution – supernovae: general1 Introduction
White dwarfs are the “fossil remnants” of low and intermediate mass stars so their study might well be named “paleaoastrophysics” - the study of the history of our Galaxy through the fossil remnants of its population. Key parameters for any population of stars are the binary fraction and the period and mass ratio distributions of the binaries. These parameters will be different among white dwarfs compared to their parent population of main-sequence stars because the large size reached by a star during its red-giant phase leads to interactions with nearby companions. The results of such interactions are complicated but certainly lead to ejection of some or all of the red giant envelope at the expense of orbital angular momentum. This “common-envelope” phase will occur for brown-dwarf and massive planetary companions (Nelemans & Tauris, 1998) e.g. 51 Peg B (Mayor & Queloz 1995), as well as for stellar companions. If two common-envelope phases or other mass transfer episodes occur (e.g. an Algol-like phase, Sarna et al., 1996) the result may well be a short-period white dwarf – white dwarf binary – a double-degenerate star (DD). In short period DDs the loss of orbital angular momentum through gravitational radiation causes the binary to coalesce. The physics of this merging is complicated but it is reasonable to assume that if the total mass of the binary exceeds the Chandrasekhar limit, some sort of violent explosion may occur. Thus, DDs have been proposed as the source of Type Ia supernovae (Iben et al., 1997).
There have been several surveys for double-degenerates (Saffer et al. 1998; Bragaglia 1990; Robinson & Shafter 1987; Foss et al., 1991). The observing strategies used have tended to be optimized for the detection of very short period systems ( few hours). These very short period systems will merge within a Hubble time or less through the loss of angular momentum via gravitational wave radiation. By measuring the space density of these very short period systems, it is possible, in principle, to establish whether or not there are enough such systems to account for the observed rate of Type Ia supernovae (SNe Ia) in our Galaxy. However, these very short period systems may comprise as few as 1/570 of the white-dwarf population; (Saffer et al., 1998), so the number of systems surveyed would need to be increased by at least an order-of-magnitude before surveys of this type can be used to draw any firm conclusions regarding the space-density of SNe Ia progenitors.
An alternative approach is to study the longer period systems. Although they do not provide a direct measure of the current rate of Galactic SNe Ia they are predicted to be the most common type of DD. As such, they provide a good means of testing models of binary star evolution leading to DDs. These models also predict the properties of other types of binaries arising from common-envelope evolution e.g. cataclysmic variables, black hole binaries, binary pulsars etc. Double-degenerates do not suffer from poorly understood phenomena such as magnetic-wind braking and mass transfer which make it so difficult to test models of binary evolution using observations of those binary stars which show these effects. Also, the selection effects associated with searches for DDs are, in principle, straightforward to calculate. Thus, DDs are the best objects to study if we are to critically test models of binary star evolution.
In this paper we report the results of a radial velocity survey of DA white-dwarfs. We then use the results of this survey to show there is a 95% probability that the fraction of double degenerates among DA white dwarfs lies in the range .
2 Observations and reductions
| WD | N | Mean RV | Mass | ||
|---|---|---|---|---|---|
| () | () | ||||
| 0047-524 | 5 | 35.8 0.7 | 5.89 | -0.68 | |
| 0101+048 | 3 | 63.7 1.5 | 0.33 | -0.07 | |
| 0226-329 | 2 | 27.0 2.4 | 4.17 | -1.38 | |
| 0227+050⋆ | 4 | 18.8 0.6 | 1.98 | -0.24 | |
| 0310-688 | 14 | 65.9 0.1 | 11.15 | -0.22 | |
| 1149+057 | 3 | 2.0 3.4 | 0.11 | -0.02 | |
| 1210+140 | 2 | 69.7 5.6 | 1.42 | -0.63 | |
| 1233-164 | 3 | 66.2 4.3 | 0.99 | -0.21 | |
| 1310-305 | 4 | 40.1 0.9 | 2.05 | -0.25 | |
| 1314-153 | 5 | 108.8 0.8 | 9.31 | -1.27 | |
| 1327-083 | 5 | 44.7 0.3 | 2.96 | -0.25 | |
| 1348-273 | 3 | 62.4 2.7 | 0.36 | -0.08 | |
| 1425-811 | 5 | 34.6 0.7 | 3.85 | -0.37 | |
| 1550+183 | 3 | 15.8 1.8 | 0.32 | -0.07 | |
| 1616-591 | 4 | 9.5 1.5 | 1.45 | -0.16 | |
| 1619+123 | 4 | 22.4 1.5 | 3.15 | -0.43 | |
| 1620-391 | 7 | 46.4 0.2 | 5.10 | -0.28 | |
| 1659-531 | 3 | 51.3 1.0 | 0.11 | -0.02 | |
| 1716+020 | 5 | -15.7 0.7 | 2.07 | -0.14 | |
| 1743-132 | 5 | -68.5 1.1 | 0.71 | -0.02 | |
| 1826-045 | 4 | 1.9 0.8 | 2.24 | -0.28 | |
| 1827-106 | 3 | -31.1 3.1 | 0.71 | -0.15 | |
| 1840+042 | 3 | 5.8 1.1 | 0.67 | -0.15 | |
| 1840-111 | 4 | -5.9 0.9 | 1.00 | -0.10 | |
| 1845+019⋆ | 5 | -29.9 0.7 | 7.10 | -0.88 | |
| 1845+019B | 5 | -49.2 0.8 | 9.61 | -1.32 | |
| 1914-598 | 4 | 74.9 0.9 | 0.10 | 0.00 | |
| 1919+145 | 5 | 53.0 0.6 | 6.34 | -0.76 | |
| 1943+163 | 4 | 36.5 1.2 | 0.64 | -0.05 | |
| 2007-303 | 5 | 75.4 0.2 | 16.46 | -2.61 | |
| 2014-575 | 4 | 41.1 1.5 | 0.62 | -0.05 | |
| 2035-336 | 5 | 20.9 0.8 | 1.80 | -0.11 | |
| 2039-202 | 7 | 1.8 0.3 | 5.60 | -0.33 | |
| 2039-682⋆ | 3 | 55.0 2.6 | 2.54 | -0.55 | |
| 2058+181 | 3 | -43.0 2.7 | 1.47 | -0.32 | |
| 2105-820 | 5 | 42.6 0.8 | 5.19 | -0.57 | |
| 2115-560 | 5 | 9.8 0.7 | 8.05 | -1.05 | |
| 2149+021 | 4 | 32.0 0.5 | 1.83 | -0.22 | |
| 2151-015⋆ | 5 | 35.7 +/- 1.2 | 11.91 | -1.74 | |
| 2151-015B | 5 | 7.0 +/- 1.6 | 1.70 | -0.10 | |
| 2151-307 | 3 | 55.2 3.6 | 0.95 | -0.21 | |
| 2159-754 | 2 | 153.2 3.3 | 0.00 | -0.01 | |
| 2211-495⋆ | 5 | 37.5 1.3 | 1.90 | -0.12 | |
| 2251-634 | 5 | 32.5 0.7 | 3.08 | -0.26 | |
| 2326+049⋆ | 5 | 44.7 0.7 | 7.91 | -1.02 | |
| 2333-165 | 4 | 72.3 0.4 | 0.18 | -0.01 | |
| 2351-335 | 5 | 51.0 0.5 | 7.57 | -0.96 | |
| 2359-434⋆ | 8 | 43.6 0.6 | 15.14 | -1.46 |
⋆ See text for notes concerning this object.
1. Bergeron et al., 1992 2. Bergeron et al., 1995
3. Bragaglia et al., 1995 4. Finley et al. 1997
Our observations were obtained with the 3.9m Anglo-Australian Telescope at Siding Spring, Australia over two observing runs, 1997 August 15-17 and 1998 June 3-5. Conditions were generally good with a total of 1.5 nights lost to cloud, typical seeing of 1–2 arcsec and a final night with sub-arcsecond seeing throughout. The RGO spectrograph with the 82cm camera and 1200l mm-1 grating was combined with a 1 arcsec wide slit to obtain a resolution of 0.7Å at . The detector for the first observing run was a TEK CCD with 1024 pixels covering 0.235Å each. The detector for the second run was a MIT-LL CCD. We used only a portion of this detector and on-chip binning over two pixels in the spectral direction to give 1536 pixels of 0.293Å each. Exposure times were typically 900s or 1200s giving a signal-to-noise ratio of 30 or more in the continuum for a white dwarf of around 14th magnitude. Small scale sensitivity variations were removed using observations of an internal tungsten calibration lamp and images of the twilight sky were used to remove the variation of slit throughput in the spatial direction. Bias images over both detectors show no signs of any structure so a constant bias level determined from the median value in the over-scan region was subtracted from all the images.
Extraction of the spectra from the images was performed automatically using optimal extraction to maximize the signal-to-noise of the resulting spectra (Horne, 1986). Every spectrum was bracketed by observations of the internal copper-argon arc lamp at the position of the star. The arcs associated with each stellar spectrum were extracted using the profile determined for the stellar image to avoid possible systematic errors due to tilted spectra. The wavelength scale was determined from a fourth-order polynomial fit to measured arc-line positions. The 1997 spectra were normalized using a linear fit to the continuum region either side of broad line. Some of the 1998 spectra show strong vignetting over of the blue end of the spectra due to a shutter falling partially into the spectrograph beam. Therefore, all the 1998 spectra have been normalized using a linear fit to the continuum to the red of H only. To determine the amount of vignetting in the affected spectra we calculated the ratio of these spectra to either an unvignetted spectrum of the same star or a multiple Gaussian fit to the unvignetted portion of the spectrum. A smooth function was then used to model this vignetting and this was used to correct the original spectrum. Note that this procedure only affects the regions of the spectrum blue-wards of the core and will not affect the measurement of radial velocities.
Spectra were obtained for a total 49 objects taken from the catalogue of McCook & Sion (1998). All the objects observed are brighter than about 15th magnitude and have a ‘DA’ catalogue spectral type. Where a sub-class is given with the spectral type, only objects with sub-types 2 or greater were included.
2.1 The observing strategy.
We attempted to obtain 4 spectra of each white dwarf such that intervals between spectra were approximately 20 minutes, 4 hours and 1 – 2 days, e.g.
-
•
a pair of consecutive spectra;
-
•
one spectrum, 3–6 hours later;
-
•
one spectrum the following night.
There are very few periods which fit this sampling in such a way as to avoid detection, particularly given our high radial velocity accuracy. Therefore, the detection efficiency is extremely high across a wide range of periods. This is shown in Fig. 1 where we plot the fraction of binaries satisfying our detection criterion as a function of period for a typical observing sequence and radial velocity accuracies. The effects of randomly oriented orbits and random zero phases have been included and masses of 0.5for both components have been assumed. We also plot the normalized theoretical period distributions for DDs of Iben et al. (1997) and Han (1998) for comparison.

2.2 Measurement of radial velocities.
We used least-squares fitting of four Gaussian profiles to measure radial velocities from our spectra. We used an automatic procedure to yield objective results as far as possible. For each star we first used a simultaneous fit to all the spectra of that star to find the optimum width and depth of the Gaussian profiles. These parameters were then fixed and a second fit to each of spectra was used to measure the radial velocities. The radial velocity of each spectrum and the coefficients of a second-order polynomial to model the continuum were the only parameters optimized in this second fitting procedure. This method gives satisfactory fit to almost all the spectra with no further effort. The few exceptions to this rule and other objects of interest are noted in the following section. All the measured radial velocities used in this study are given in Table 1.
2.3 Notes on individual systems.
- WD 0107-342
-
This is not included in our sample as our single spectrum shows a strong HeI 6676 absorption line which suggests that this is an sdB star.
- WD 1845+019
-
The core of shows a weak, sharp emission line slightly to the blue of the absorption core of (Fig. 2). We used an additional Gaussian profile with an independent radial velocity in the fitting process to model this emission. Neither component shows any radial velocity variation and the mean offset between the components is around 20, though this is somewhat uncertain as the emission and absorption cores are not fully resolved. Nevertheless, we have used the mass (0.57) and surface gravity () of this star measured by Finley et al. (1997) to predict a gravitational redshift for this star of 24, which is in good agreement with our measured offset. We conclude that the emission arises from a cool companion star in a long period orbit around this white dwarf. The radial velocity of the emission component is listed in Table 2 as WD 1845+019 B. The radial velocity measurements for WD 1845+019 are included in our analysis, but those of its companion are not.

Figure 2: The average of our 5 spectra of WD 1845+019 showing the emission from the cool companion. - WD 1953-011
-
Our single spectrum of this object shows ‘shoulders’ either side of the the broad core of the line (Fig. 3). Note that these are not the features noted by Koester et al, 1998. The latter occur at a much smaller scale () and are the cause of the odd shaped core of the line. A degree of smoothing has been applied to the spectrum shown in Fig. 3 to show more clearly that our core profile is consistent with the Zeeman triplet seen in the spectra of Koester et al. (their Fig. 7) which implies a mean magnetic field of kG. If the features at are also due to Zeeman splitting, this implies a mean field strength of kG. This would require an unusual magnetic field geometry for a single white dwarf, which might suggest that WD 1953-011 is a binary composed of two magnetic white dwarfs. Further observations, particularly circular polarization measurements, are required to address these issues.

Figure 3: Our single spectrum of WD 1953-011. - WD 2039-682
-
The core of is noticeably broader and shallower than those of white dwarfs of similar spectral type (Fig. 4). One of the stars for which we have several high signal-to-noise spectra, WD 0310-688, has a very similar temperature and gravity to WD 2039-682 (Bragaglia et al., 1995). We applied a simple rotational broadening function to our average spectrum of WD 0310-688 assuming a linear limb darkening coefficient of 0.15 (Koester et al., 1998). By comparing the average spectrum of WD 2039-682 to the broadened spectra of WD 0310-688 for various values of the projected rotational velocity, , we estimate , which agrees well with the estimate of Koester et al. (). The resolution of our spectra is lower than theirs but our signal-to-noise ratio is much higher. The very good fit obtained by this method strongly suggests this is a genuine rapidly rotating white-dwarf.

Figure 4: The average spectrum of WD 2039-682 (solid line), the average spectrum WD 0310-688 before applying any broadening (dotted line) and after applying rotational broadening for the measured value of (dashed line). - WD 2151-015
-
One of the spectra of this star shows a strong emission line slightly to the blue of the absorption core which, with hindsight, is also present at a much weaker level in at least two other spectra (Fig. 5). By fixing the width of the emission line from a fit to the spectrum in which it is strongest, we were able to measure independent velocities for the emission and absorption components. The mean radial velocity of the emission component is given in Table 2 as WD 2151-015B. Again, the size of the offset suggests and the lack of any radial velocity variation suggests the presence of a distant, cool companion star. The radial velocity measurements for WD 2151-015 are included in our analysis, but those of its companion are not.

Figure 5: Spectra of WD 2151-015 showing the absorption from the white dwarf and the variable emission line from the proposed companion star. - WD 2211-495
-
The sharp core of this star is reversed (in emission). Unlike those stars with companion stars, there is no significant offset between emission and absorption in this star (). The emission is simply a consequence of the higher temperature of this star (65 000K; Finley et al, 1997) compared to others in our sample (typically 20 000K). There appears to be no reason why these emission cores should not be used to extend radial velocity surveys of DA white dwarfs into these hotter regimes.
- WD 2326+049
-
This high-amplitude ZZ Ceti variable star shows a large infrared excess which continues to defy explanation. The presence of a companion star is almost certainly ruled out by the lack of any light-time effect in the pulsation periods (Kleinman et al., 1994). The favoured hypothesis now appears to be circumstellar dust, though this requires very special geometries to explain the variability of the infrared excess on periods longer than those seen in the star itself (Patterson et al., 1991). We have used this star in our analysis, but for consistency have ignored the many other published radial velocity measurements.
- WD 2359-434
-
There is no obvious sharp core to the line apparent in our spectra of this star (Fig. 6). A single higher resolution spectrum by Koester shows a very weak, sharp core unlike those seen in other white dwarfs. There is also some hint of variability in the line from our spectra. The broad wings of the line are similar to white dwarfs of similar spectral type. This odd star clearly deserves further investigation. We used only three Gaussian profiles to model the profile of this star and have included it in our analysis.

Figure 6: Spectra of WD 2359-434 showing the anomalous core of .
3 Results
| WD | P(d) | q | M/ | K() | P(Detect) |
|---|---|---|---|---|---|
| 0135052 | 1.556 | 0.90 | 0.47 | 78 | 100% |
| 0136768 | 1.407 | 1.31 | 0.34 | 65 | 100% |
| 0957666 | 0.061 | 1.14 | 0.37 | 219 | 100% |
| 1022050 | 1.157 | 0.35 | 74 | 93% | |
| 1101364 | 0.145 | 0.87 | 0.31 | 70 | 100% |
| 1202608 | 1.493 | 0.40 | 77 | 100% | |
| 1204450 | 1.603 | 1.00 | 0.51 | 96 | 100% |
| 1241010 | 3.347 | 0.31 | 68 | 100% | |
| 1317453 | 4.872 | 0.33 | 64 | 93% | |
| 1713332 | 1.123 | 0.38 | 55 | 89% | |
| 1824040 | 6.266 | 0.39 | 59 | 87% | |
| 2032188 | 5.084 | 0.36 | 64 | 93% | |
| 2331290 | 0.167 | 0.39 | 164 | 100% |
3.1 The criterion for detection of a binary.
The uncertainties on every data point in the spectra are propagated through the data reduction and analysis and so the measured radial velocities have accurate uncertainties associated with them. We can, therefore, calculate a weighted mean radial velocity for the spectra of each star. This mean is the best estimate of the radial velocity of the star assuming this quantity is constant. We then calculate the statistic for this “model”, i.e. the goodness-of-fit of a constant to the observed radial velocities. We can then compare the observed value of with the distribution of for the appropriate number of degrees of freedom. In the case of significant variability in the radial velocities the probability of obtaining the observed value of or higher from random fluctuations of constant radial velocities, , will be extremely low. The observed values of the weighted mean radial velocity, and the logarithm of this probability, , are given for all the binaries in our sample in Table 2.
To test whether the uncertainties for our measured radial velocities are reliable we calculated the total value of for all the stars in our sample, ,. The number of degrees of freedom, , is given by , where is the number of radial velocity measurements and is the number of stars measured (including WD 1845+019 B and WD 2151-015 B). For a distribution with we find the probability . If almost all the stars in the sample are non-variable this suggests that our uncertainties are very reliable.
We have decided to use as the criterion for detection of a binary, i.e. a 1/1000 probability of random fluctuations given the observed value of or higher. This is a sufficiently low probability that the chances of one or more spurious detections in our sample is less than 5%, but sufficiently high for genuine binaries not to be missed. The latter point is demonstrated in Table 3 where we give the probability of detecting the binary nature of some known DDs, P(Detect), given a typical observing sequence of 4 spectra yielding radial velocities with uncertainties of 3. We see that the majority of known DDs would never be missed and that even those with long or awkward periods have a good chance of being detected.
Reference to Table 2 shows that there no stars in our sample which are binaries according to our detection criterion. However, there are two stars that were included in our observing list which we deliberately did not observe as they were known to be binaries prior to our observations, namely WD 0135+052 and WD 1824+040. By examination of the magnitude and RA distributions of the stars we did observe it is clear that these stars would certainly have been observed had they not been known to be binaries and they would almost certainly have been detected as binary using our observing strategy (Table 3). This is a rather unsatisfactory situation which we can only resolve easily by including these two binaries in our analysis as though they had been observed as part of the main sample and assuming they would have been detected as binaries.
3.2 The fraction of double degenerates among DA white dwarfs.
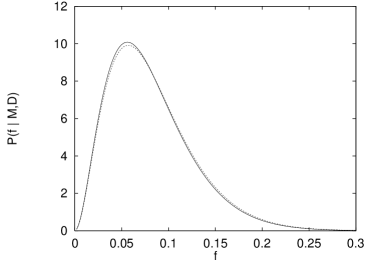
Given a theoretical model which predicts the period, mass and mass ratio distributions of DDs, we can calculate the probability of obtaining the observed number of binaries and their period distribution i.e. we can calculate the probability of obtaining the data, D, given the model, M, and the binary fraction for DDs, , P(D M,). This is demonstrated in Appendix A. To find the probability distribution of , we appeal to Bayes’ theorem to show that
By assuming the model to be correct, i.e. P(f M,D), and assuming that all values of are equally likely (i.e. the prior probability P(f M) is constant), we can simply normalise the P(D M,f) to get P(f M,D), the probability distribution of given the data and the model. Simple numerical integration then enables us to find a range of values which gives some probability of including the true value of .
We calculated the probable range of for two theoretical models, Iben et al., 1997 and Han, 1998. The first step is to calculate the average detection efficiency as a function of period, i.e. the probability of detecting a binary at a given period using the measured radial velocities with the adopted detection criterion and including the effects of randomly oriented orbits. For the model of Iben et al. we calculated the mass of the brighter white dwarf, , using , where the mass is in solar masses and the period, , is in days. This is simply an approximation to the main feature of the bivariate distribution of periods and masses for DDs given by Saffer et al. (1998) for the same model. The model of Han shows the mass to be almost independent of period and to have a bi-modal distribution. Therefore, we took the average of for with weight of 1 and with a weight of 0.7. The mass ratio distribution for the two models is similar and is strongly peaked so we used a single, average value for the mass ratio of 0.67 for both. We used the data for the 46 white dwarfs presented in Table 1 to calculate for each model at 2500 periods and then summed into histogram with 50 period bins before forming the average.
The probability distributions P(f M,D) for the models of Han and Iben et al. are shown in Fig. 7. We find that the fraction of DDs among DA white dwarfs has a 95% probability of lying in the range independent of the model used. The predicted period distribution of binaries in our average detection efficiency and sample size for each model averaged over the distribution P(f M,D) is given in Fig. 8.

3.3 Agreement between observations and theory.
To get an idea of how well the observations agree with the two proposed theories, we compared the probability of obtaining the data given each model integrated over , P(D M,f) f, to the same quantity calculated for a simple default model. For this default model we assumed that the periods are uniformly distributed between 0.06 d and 300 d. The lower limit is set by the period below which two white dwarfs with the typical mass of those in our survey (0.5) would merge within their typical cooling age ( y). The upper age is set by the maximum period for DD resulting from a common envelope phase estimated from Fig 5 of Saffer et al. The exact value of these limits has little effect on the results. The mass and mass ratio distributions for the simple model were taken to be the same as those for the model being tested in each case. We find that the model of Han is 3.3 times more likely to produce the observed number and period distribution of binaries than the simple model. The equivalent factor for the model of Iben et al. is 1.4. Thus, both models are no worse than a simple model of the period distribution.
4 Discussion
We have been able to perform a quantitative analysis of a survey for binary stars among DA white dwarfs. Despite the relatively large sample of stars and the high detection effeciencies for binaries in the expected period range, we are only able to measure the fraction of DDs among DA white dwarfs to within a factor of ten. To reduce this uncertainty to a factor of three would require a sample approximately 4 times larger than the one presented here, with a similar detection efficiency (or a much larger survey with a lower detection efficiency).
The two binaries in our sample of 48 stars contrasts sharply with the survey of Saffer et al. (1998), who claim to have found 13 new binaries in a survey of 107 stars. Although consistent with our range of , this is a little puzzling given that their survey observed each star only three times and with a lower precision per measurement, both of which imply a lower detection efficiency than ours for the majority of DDs. However, this does not take account of the “false alarm” rate for Saffer et al.’s survey. Including false detections in the analysis is rather problematic, so our detection criterion was deliberately choosen so as to keep this rate low enough to give a less than 5% chance of one or more false detections. By contrast, if we take the uncertainty of 25 quoted by Saffer et al. for their radial velocity measurements and their quoted detection criterion of any two spectra differing by 65, we find that their sample should contain an average of 17.7 false detections, which would suggest that on their figures, none of their candidates are likely to be genuine binaries! This is clearly not reasonable given that 7 of their candidates were known to be binaries beforehand or have been confirmed by follow-up observations and have measured orbital periods. On the other hand, observations similar to those presented here have also shown that at least two of the candidates are probably single. We have observed several of Saffer et al.’s candidate binaries using the 4.2m William Herschel and 2.5m Isaac Newton telescopes on the Island of La Palma in the Canary Islands. Our 10 spectra of WD 1232+479, one of Saffer et al.’s “weight 1” candidates, obtained over 3 nights have a typical uncertainty of 4and show no sign of variability (). Similarly, we obtained 15 spectra of WD 1310+583, another of Saffer et al.’s “weight 1” candidates, during two observing runs 8 months apart, over two and three nights and, again, found no variability (). Inspection of the spectra of WD 1310+583 (Fig. 9) shows that there is certainly no variation as large as the shift that is seen in the spectra of Saffer et al. (their Fig. 1). If there are only 2 false alarms among the “weight 1” candidates of Saffer et al., their radial velocities are accurate to . However, the false alarm rate is very sensitive to the exact value of the uncertainty. We have also assumed that the detection criterion given by Saffer et al. is an accurate reflection of the subjective methods they actually used. These are impossible to quantify in practice and so it is extremely difficult to draw any concusions concerning the statistics of DDs from their survey.
We also analysed the radial velocities given by Foss et al. for 25 DA white dwarfs. Their radial velocities are typically ten times less accurate than ours and so their data alone provide a very poor constraint on the binary fraction for DDs. If we incorporate their results into our survey we find this makes essentially no difference to our results. This is simply because radial velocities surveys of such low accuracy can only detect very short period binaries, and there are expected to be very few such systems in the sample of all known white dwarfs and probably none at all in such a small sample.

Given the large uncertainty in our estimate of the binary fraction, it is obvious that there is insufficient data at present to determine whether merging DDs are a viable source of Galactic SNe Ia. This will remain the case until a much larger sample of white dwarfs is surveyed for DDs. There are also other issues which must be addressed before we answer this question. The validity of the theoretical models can be tested using techniques similar to those presented here if a new, large survey is also designed to be quantative from the outset. Such a survey should also consider the selection effects in the sample of stars to be observed, particularly with regard to known binaries, in a more careful manner than has been done here. The space density of white dwarfs, the luminosity function and the number of very cool halo white dwarfs are also issues which will need to be tackled before we can come to a definite conclusion on this point.
5 Conclusion
We have used a quantitative radial velocity survey of 46 stars with a high detection efficiency to measure the fraction of double degenerates among DA white dwarfs. We find a 95% probability that the lies in the range [0.017,0.19], independent of the details of the model used to predict the period, mass and mass ratio distribution. The combination of sample size and high radial velocity accuracy make this the most sensitive survey for double degenerates with periods of hours and days conducted to date. The rather loose constraint on the binary fraction we derive illustrates the need to increase the number of white dwarfs observed. Such a survey will need to be quantitative if an objective detection criterion for binaries is to be used. This would appear to be essential if a valid comparison is to be made between observations and theory.
Acknowledgements
TRM was supported by a PPARC Advanced fellowship. PFLM was supported on a PPARC post-doctoral grant. We would like to thank Rex Saffer for making the results of his survey available to us.
References
- [1] Bergeron P., Saffer R.A., Liebert J., 1992, ApJ, 394, 228
- [2] Bergeron P., Liebert J. Fulbright M.S., 1995, ApJ, 444, 810
- [3] Bragaglia A., Greggio L., Renzini A., D’Odorico S., 1990, ApJ, 365, L13
- [4] Bragaglia A., Renzini A., Bergeron P., 1995, ApJ, 443, 735
- [5] Finley D.S., Koester D., Basri G., 1997, ApJ, 488, 375
- [6] Foss D., Wade R.A., Green R.F., ApJ, 374, 281, 1991
- [7] Han Z., 1998, MNRAS, 296, 1019
- [8] Horne K., 1986, PASP, 98, 609
- [9] Iben Jr. I., Tutukov A.V., Yungelson L.R., 1997, ApJ, 475, 291
- [10] Kleinman S.J., Nather R.E., Winget D.E., et al., 1994, ApJ, 436, 875
- [11] Koester D., Dreizler S., Weidemann V., Allard N.F., 1998, A&A, 338, 612
- [12] Mayor M., Queloz D., 1995, Nature, 378, 355
- [13] McCook G.P., Sion E.M., 1998, ApJS, In press.
- [14] Moran C. 1999, PhD thesis, University of Southampton, in prep.
- [15] Nelemans G., Tauris T. M., 1998, A&A, 335, 85L
- [16] Robinson E.L., Shafter A.W., 1987, ApJ, 322, 296
- [17] Patterson J., Zuckerman B., Becklin E.E., Tholen D.J., Hawarden T., 1991, ApJ, 374, 330
- [18] Saffer R.A. Livio M., Yungelson L.R., 1998, ApJ, 502, 394
- [19] Sarna M.J., Marks P.B., Smith R.C., 1996, MNRAS, 279, 88
| WD | HJD | Radial velocity | WD | HJD | Radial velocity |
|---|---|---|---|---|---|
| -2450000 | () | -2450000 | () | ||
| 0047-524 | 677.1278 | 31.6 2.5 | 1550+183 | 970.0070 | 15.0 3.8 |
| 677.1385 | 34.7 2.5 | 970.0178 | 14.8 3.5 | ||
| 677.3004 | 39.2 2.5 | 970.1484 | 17.4 3.5 | ||
| 968.3358 | 35.2 3.1 | 1616-591 | 968.1108 | 10.4 4.1 | |
| 969.3412 | 38.8 3.0 | 968.1250 | 8.8 3.8 | ||
| 0101+048 | 677.1806 | 63.6 2.5 | 968.9571 | 14.0 5.1 | |
| 677.1879 | 62.7 2.7 | 969.1295 | 6.2 4.1 | ||
| 677.3149 | 65.4 3.6 | 1619+123 | 968.0131 | 20.2 4.2 | |
| 0226-329 | 676.2976 | 30.4 2.4 | 968.0273 | 29.4 4.6 | |
| 676.3049 | 23.3 2.4 | 968.1627 | 23.5 5.1 | ||
| 0227+050 | 676.2800 | 19.9 1.0 | 968.9742 | 19.8 3.2 | |
| 676.2873 | 18.2 1.1 | 1620-391 | 676.8555 | 45.2 0.8 | |
| 677.1941 | 18.2 2.4 | 676.8593 | 46.4 0.9 | ||
| 677.3234 | 17.3 2.1 | 676.8631 | 47.0 0.9 | ||
| 0310-688 | 676.3119 | 65.9 0.7 | 677.0417 | 45.0 1.9 | |
| 676.3157 | 66.2 0.7 | 677.0435 | 44.8 2.1 | ||
| 676.3195 | 65.5 0.8 | 677.8541 | 47.6 1.0 | ||
| 676.3234 | 66.5 0.7 | 968.0005 | 47.5 1.5 | ||
| 676.3272 | 65.3 0.7 | 1659-531 | 967.9799 | 50.8 1.8 | |
| 676.3317 | 65.0 0.8 | 967.9907 | 51.7 2.2 | ||
| 676.3355 | 65.2 0.8 | 968.1790 | 51.4 1.9 | ||
| 676.3396 | 66.7 0.9 | 1716+020 | 676.9091 | -16.2 2.2 | |
| 677.2001 | 66.4 1.5 | 677.0235 | -18.9 3.0 | ||
| 677.2025 | 67.1 1.6 | 677.0343 | -15.7 3.0 | ||
| 677.3308 | 69.2 1.9 | 677.8681 | -15.3 1.6 | ||
| 677.3328 | 62.4 2.1 | 968.1461 | -12.9 3.0 | ||
| 677.3349 | 67.1 2.1 | 1743-132 | 969.0931 | -67.6 5.3 | |
| 677.3370 | 64.9 2.8 | 969.1003 | -66.8 4.9 | ||
| 1149+057 | 969.8734 | 2.0 6.0 | 970.0914 | -68.3 3.5 | |
| 969.8842 | 0.6 6.4 | 970.2120 | -67.3 3.4 | ||
| 970.0278 | 4.0 8.0 | 970.2193 | -70.8 3.4 | ||
| 1210+140 | 969.8965 | 65.2 5.4 | 1826-045 | 968.0441 | 1.1 2.6 |
| 969.9073 | 74.8 5.8 | 968.0583 | 3.2 2.8 | ||
| 1233-164 | 969.9216 | 75.1 10.2 | 969.0310 | -0.5 2.1 | |
| 969.9324 | 64.5 7.6 | 969.2441 | 3.1 1.5 | ||
| 970.0424 | 63.0 7.5 | 1827-106 | 969.1088 | -33.0 7.0 | |
| 1310-305 | 968.8958 | 41.6 3.4 | 969.1161 | -35.5 7.0 | |
| 969.9612 | 42.2 2.7 | 970.1005 | -29.1 3.9 | ||
| 970.0674 | 37.7 2.1 | 1840+042 | 970.1647 | 4.3 2.2 | |
| 970.0782 | 40.4 2.1 | 970.1754 | 6.2 2.2 | ||
| 1314-153 | 968.9897 | 101.0 4.1 | 970.2672 | 6.7 2.2 | |
| 969.0128 | 109.9 3.9 | 1840-111 | 968.0754 | -6.5 3.3 | |
| 969.9472 | 113.6 2.9 | 969.0474 | -3.8 2.5 | ||
| 970.0553 | 105.4 2.3 | 969.0616 | -7.1 2.2 | ||
| 970.1213 | 111.3 2.5 | 969.2600 | -5.8 2.2 | ||
| 1327-083 | 967.9596 | 43.9 1.2 | 1845+019 | 676.8921 | -32.6 2.0 |
| 967.9653 | 43.6 0.9 | 676.8994 | -27.9 1.9 | ||
| 968.0883 | 44.2 1.1 | 677.0960 | -31.4 3.2 | ||
| 968.8552 | 45.3 0.7 | 677.1010 | -21.2 4.4 | ||
| 969.8351 | 45.2 0.8 | 677.9255 | -30.6 2.0 | ||
| 1348-273 | 969.9835 | 62.4 5.5 | 1845+019B | 676.8921 | -53.3 2.2 |
| 969.9943 | 59.3 6.2 | 676.8994 | -48.4 2.1 | ||
| 970.1359 | 63.8 4.1 | 677.0960 | -53.6 3.8 | ||
| 1425-811 | 675.8778 | 32.4 2.2 | 677.1010 | -39.8 4.7 | |
| 675.8850 | 33.0 2.2 | 677.9255 | -47.1 2.0 | ||
| 676.8715 | 37.2 3.0 | 1914-598 | 675.8993 | 74.5 2.1 | |
| 676.8788 | 33.3 3.2 | 676.0923 | 74.6 2.4 | ||
| 677.0067 | 37.5 2.3 | 676.1030 | 75.3 2.2 | ||
| 677.9536 | 75.3 3.7 |
| WD | HJD | Radial velocity | WD | HJD | Radial velocity |
|---|---|---|---|---|---|
| -2450000 | () | -2450000 | () | ||
| 1919+145 | 676.9222 | 52.3 1.5 | 2159-754 | 970.2918 | 153.1 3.1 |
| 676.9294 | 55.3 1.4 | 970.3026 | 153.2 3.4 | ||
| 677.0896 | 53.6 2.1 | 2211-495 | 968.3460 | 38.2 5.3 | |
| 677.9670 | 51.2 3.7 | 968.3515 | 32.0 7.6 | ||
| 677.9785 | 49.1 2.1 | 970.2548 | 35.4 4.0 | ||
| 1943+163 | 969.1790 | 34.3 4.5 | 970.3491 | 41.7 4.1 | |
| 969.1863 | 34.8 4.3 | 970.3529 | 36.4 4.2 | ||
| 970.1076 | 36.3 2.4 | 2251-634 | 677.0781 | 29.5 2.4 | |
| 970.2355 | 37.6 2.1 | 677.2156 | 35.5 3.0 | ||
| 2007-303 | 675.9451 | 75.1 0.7 | 677.2298 | 30.9 3.0 | |
| 676.1501 | 73.5 0.7 | 968.2887 | 33.4 2.7 | ||
| 676.1574 | 75.7 0.7 | 969.3024 | 33.9 2.5 | ||
| 968.1908 | 78.4 1.1 | 2326+049 | 676.0558 | 44.7 1.7 | |
| 969.2190 | 77.0 1.0 | 676.0631 | 41.5 1.8 | ||
| 2014-575 | 675.9178 | 43.2 5.0 | 676.2597 | 43.8 1.8 | |
| 675.9347 | 39.1 4.0 | 968.3044 | 48.3 1.8 | ||
| 676.1397 | 40.5 3.2 | 969.3476 | 49.3 5.0 | ||
| 678.0281 | 43.2 5.1 | 2333-165 | 676.0334 | 72.3 1.2 | |
| 2035-336 | 676.9718 | 21.3 3.5 | 676.2437 | 72.6 1.1 | |
| 676.9825 | 22.3 2.9 | 676.2510 | 72.2 1.1 | ||
| 677.1613 | 22.5 3.3 | 677.2745 | 71.7 1.6 | ||
| 968.2061 | 18.0 2.5 | 2351-335 | 676.1180 | 47.9 1.5 | |
| 969.2275 | 21.7 2.6 | 676.1287 | 53.2 1.6 | ||
| 2039-202 | 676.9419 | -0.0 2.0 | 676.2713 | 49.8 1.6 | |
| 676.9457 | 0.8 2.1 | 968.3206 | 52.8 2.1 | ||
| 677.1705 | 3.2 1.8 | 969.3128 | 52.8 2.1 | ||
| 677.1743 | 0.6 1.8 | 2359-434 | 676.0161 | 51.9 3.6 | |
| 678.1085 | 0.2 1.7 | 676.0234 | 48.7 3.6 | ||
| 968.2196 | 1.7 1.0 | 676.2279 | 45.7 3.7 | ||
| 969.2692 | 4.6 1.6 | 676.2341 | 37.4 3.5 | ||
| 2039-682 | 677.1090 | 52.6 4.2 | 677.2868 | 37.6 4.0 | |
| 677.1162 | 60.8 4.7 | 969.3255 | 43.3 3.8 | ||
| 677.2433 | 49.8 6.1 | 969.3328 | 34.7 5.7 | ||
| 2058+181 | 970.1852 | -40.8 5.7 | 970.3186 | 43.0 2.9 | |
| 970.1959 | -37.3 6.3 | ||||
| 970.2770 | -45.5 3.5 | ||||
| 2105-820 | 676.0043 | 45.2 2.6 | |||
| 676.2096 | 43.0 3.2 | ||||
| 676.2169 | 42.4 3.2 | ||||
| 968.2334 | 45.9 3.6 | ||||
| 969.2781 | 37.2 2.9 | ||||
| 2115-560 | 675.9846 | 17.2 3.2 | |||
| 675.9954 | 7.1 1.7 | ||||
| 676.2005 | 9.6 2.4 | ||||
| 968.2507 | 9.8 2.1 | ||||
| 969.2911 | 12.6 3.5 | ||||
| 2149+021 | 675.9547 | 31.7 1.1 | |||
| 675.9620 | 31.1 1.1 | ||||
| 676.1671 | 32.3 0.9 | ||||
| 678.1756 | 34.5 2.5 | ||||
| 2151-015 | 675.9728 | 32.1 3.2 | |||
| 676.1780 | 37.9 2.7 | ||||
| 676.1887 | 30.5 3.0 | ||||
| 677.2606 | 24.1 9.1 | ||||
| 968.2692 | 43.0 3.1 | ||||
| 2151-015B | 675.9728 | 9.1 13.5 | |||
| 676.1780 | -5.7 17.2 | ||||
| 676.1887 | 0.4 18.0 | ||||
| 677.2606 | 10.1 3.2 | ||||
| 968.2692 | 18.1 9.6 | ||||
| 2151-307 | 970.2461 | 53.7 5.7 | |||
| 970.3335 | 53.3 5.8 | ||||
| 970.3425 | 63.3 9.1 |
Appendix A The probability distribution of the binary fraction given the observed data.
In order to calculate the probability distribution of the binary fraction, , given a survey for binaries, we consider a histogram of observed and predicted periods with period bins covering the entire range of possible periods. The theoretical model provides the probability of a given binary having a period within bin , , . Since this probability applies only to binaries and the histogram of predicted periods covers the entire range of possible periods, .
Now consider a sample of N stars. For a given detection criterion we can calculate for each star the probability of detecting it to be binary with a given period. The average probability of detection over all the stars in the sample integrated over all periods in bin is . For each star we have possible outcomes, M possible periods or a non-detection. Each of the M possible periods have probabilities . The non-detections have probabilities , where is the mean detection probability for the model distribution. We assume that the periods of all the systems detected to be binaries are known and that there are no false detections. The number of stars found to be binaries with periods in a given bin is . The probability of obtaining the observed distribution of periods and non-detections giving the theoretical model, , is then given by the multinomial distribution as follows:
where is the number of binaries detected. In the case of no binary detections, this reduces to the simple case
Given the large number of products and factorials involved it is easier in practice to calculate :