2Laboratoire d’Astrophysique, Observatoire de Grenoble, BP 53, 414 rue de la piscine, 38041 Grenoble CEDEX 9, France
3Dipartimento di Astronomia, Universita’ di Padova, Padova, Italy
4IPAC, Caltech, MS 100-22, Pasadena, CA 91125, USA
5Service d’Astrophysique, Orme des Merisiers, Bat. 709, CEA/Saclay, F91191 Gif-sur-Yvette CEDEX, France
6JACH, 660 N. Aokoku Place, University Park, Hawaii, HI 96720, USA
A Deep 12 Micron Survey with ISO ††thanks: Based on observations with ISO, an ESA project with instruments funded by ESA Member States (especially the PI countries: France, Germany, the Netherlands and the United Kingdon) and with the participation of ISAS and NASA
Abstract
We present the first results of a study of faint 12m sources detected with the Infrared Space Observatory (ISO) in four deep, high galactic latitude fields. The sample includes 50 such sources in an area of 0.1 square degrees down to a 5 flux limit of Jy. From optical identifications based on the US Naval Observatory (USNO) catalogue and analysis of the optical/IR colours and Digital Sky Survey (DSS) images, we conclude that 37 of these objects are galaxies and 13 are stars. We derive galaxy number counts and compare them with existing IRAS counts at 12m, and with models of the 12m source population. In particular, we find evidence for significant evolution in the galaxy population, with the no-evolution case excluded at the 3.5 level. The stellar population is well matched by existing models. Two of the objects detected at 12m are associated with known galaxies. One of these is an IRAS galaxy at z=0.11 with a luminosity of 10.
Key Words.:
galaxies:evolution, galaxies:infrared, stars:infrared1 Introduction
Whenever a radically new wavelength or sensitivity regime is opened in astronomy, new classes of object and unexplained phenomena are discovered. The IRAS satellite, in opening the mid- to far-IR sky, revealed that the bolometric luminosities of many galaxies are dominated by this spectral region. This has raised questions concerning the evolution of galaxies in the mid- to far-IR, the role of dust-extinction in the formation of galaxies, the relationship between quasars and galaxies, and the nature of galaxy formation itself. Limited as they were to fluxes not much smaller than 1Jy, the IRAS surveys were constrained to the fairly local universe for the vast majority of the detected objects. The evolutionary properties of IR galaxies, both the normal galaxy population and the unusual ultra- and hyper-luminous objects (see e.g. Clements et al. 1996a), are thus still mostly unknown.
Recent work in the visible and near-IR has had a major impact on our understanding of the star formation history of galaxies (eg. Steidel et al., 1996, Cowie et al., 1994, Giavalisco et al., 1996, Lilly et al., 1996). It appears that the star formation rate in the universe peaked at around z=1 and has been declining since (Madau et al. 1998). Many of the objects studied in deep, high redshift fields appear to be distorted, and are possibly undergoing tidal interaction or merging (Abraham et al., 1996). It is well–known that tidal interactions and mergers in the local universe produce significant amounts of star formation (Joseph & Wright, 1985, Clements et al., 1996b, Lawrence et al., 1989), and that these are usually associated with a significant luminosity in the mid- to far-IR. The dust responsible for this emission is heated by the star formation process, which it also obscures. We must thus consider that the view of the universe obtained in the visible and near-IR, corresponding to the rest-frame optical and near-UV of many of the objects observed, may well be biased by such obscuring material. The question of how much of the star-formation in the universe is obscured by dust thus becomes important. This issue can only be properly addressed by selecting objects in the mid- or far-IR which are less affected by such obscuration.
Previous work in the mid- and far-IR used data from IRAS, with all-sky sensitivities of 0.1 Jy in the mid-IR bands (12 and 25 m), and 0.3–1 Jy at 60 and 100 m. These typically allow the detection of galaxies out to z=0.2, though a few exceptional objects, such as the gravitationally lensed z=2.286 galaxy IRAS10214+4724 (Rowan-Robinson et al., 1991, Serjeant et al., 1995), have also been detected.
Most evolutionary studies with IRAS have concentrated on the 60m waveband (Sanders et al., 1990, Hacking & Houck, 1987, Bertin et al., 1997). This work has found evidence for strong evolution in the 60m population, at rates similar to those of optically selected AGN, but the nature of this evolution is still unclear, and it is difficult to extrapolate to higher redshift with any confidence.
At mid-IR wavelengths, the IRAS mission has produced both large-area surveys of fairly nearby objects (eg. Rush et al., 1993), and small-area, deep surveys in repeatedly scanned regions (eg. Hacking & Houck, 1987). The former surveys do not probe sufficiently deeply into the universe to be able to say much about galaxy evolution, but they do have the advantage that plentiful data exists for the nearby galaxy samples they produce. The latter surveys are plagued by stellar contamination. The vast majority of the 12m objects in the survey of Hacking et al., for example, are stars – there are only five galaxies in their entire survey.
The Infrared Space Observatory (ISO, Kessler et al. 1996) provides a major improvement to our observational capabilities beyond those of the IRAS satellite. For observations in the mid-IR, the ISOCAM instrument (Cesarsky et al. 1996) allows us to reach flux limits 100 times fainter than those achieved by IRAS while observing fairly large areas (0.1 sq. degree) in integration times of only a few hours. We can thus probe flux regimes that were previously impossible to study.
This paper presents the results of a survey of four high galactic latitude fields using the LW10 (12m) filter, which was specifically designed to match the 12m filter on the IRAS satellite. The present results can thus be compared to existing IRAS data with minimal model-dependent K- corrections. This survey is much deeper than any based on IRAS data, and is sufficiently deep to detect distant galaxies. The survey region is also fairly small and at high galactic latitude, so that stellar contamination should not be a major problem.
There are of course other studies in the mid-IR underway using the ISO satellite. These include the DEEP and ULTRADEEP surveys (Elbaz et al., in preparation), the ELAIS survey (Oliver et al., in preparation) and the ISOHDF project (Oliver et al., 1997; Desert et al., 1998 (Paper I); Aussel et al. 1998). All of these programmes use the LW2 6.7m and/or LW3 15m filter on ISO. Only the ISOHDF results have been published to date. At 15m these observations reach a flux limit of 0.1 mJy, about 5 times deeper than the observations discussed here, but cover only 1/24th of the area. There are also deep surveys at longer wavelengths using the PHOT instrument at 175m (Kawara et al., 1998, and Puget et al., 1998). Future missions will also be probing this part of the electromagnetic spectrum. The first of these will be the WIRE mission (Fang et al., 1996) which will obtain a large area, deep survey at 12 and 25m. The SIRTF project (Werner & Bicay, 1997) and IRIS satellite (Okuda, 1998) will also be used for deep number counts, and should be able to probe significantly deeper than ISO. Finally the planned NGST (Stockman & Mather, 1997) will provide incomparable performance in this cosmologically interesting waveband. The present work provides the first results of the exploration of the distant universe at these mid-IR wavelengths, and can provide a guideline for future missions, useful for their planning and preparation.
The paper is organised as follows. Section 2 describes the observations, data reduction and calibration. Section 3 provides details on identifications of the 12m source population, star-galaxy separation, and on individual source properties. Section 4 discusses number counts, comparison with statistics at other wavelengths, and with model predictions. Section 5 summarises our conclusions.
2 Observations and Data Reduction
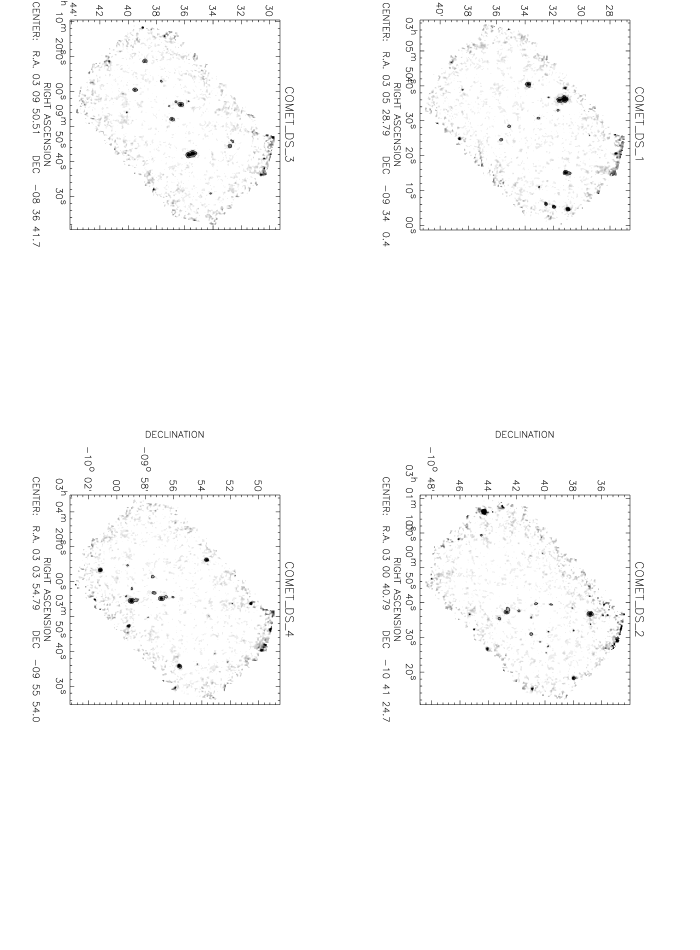
The observations presented here were part of a survey of cometary dust trails (ISO project name JDAVIES/JKDTRAIL). The original goal was to observe the width and structures of the cometary trails, which are produced by large particles, ejected from the comet into independent heliocentric orbits but with very similar orbital elements and very small radiation pressure effects. The comet 7P/Pons-Winnecke was selected because of its similarity to other comets with dust trails, the detection of a dust trail by IRAS (Sykes & Walker, 1992) and its suitability for observation by ISO. Four fields were imaged, each field being a raster map centred on the ephemeris prediction for particles with the same orbital elements as the nucleus except for the mean anomaly of the orbit, which was shifted by (ahead) and , , and (behind). Each raster was 11 by 7 pointings, with a spacing of by . The pixel field of view was , so that there was substantial overlap between individual frames of the 32 by 32 pixel ISOCAM LW array (Cesarsky et al., 1996) to ensure good flatfielding and high observational redundancy. A typical position on the sky was visited 12 times during the raster, each time with a different pixel of the array. The rasters were rotated such that the predicted cometary trail would run parallel to the short axis of the raster. Unfortunately for the cometry trails programme, the observations took place on 17 August 1997, one day later than assumed for the ephemeris calculations and therefore the trail is predicted to run horizontally across the very bottom edge of the image. Based on the results of observations of the trail of another comet (P/Kopff) from the same observing program (Davies et al., 1997), we expect that the trail would occupy at most the lower of the image and that it would be relatively smooth. The presence of the dust trail in the field should not have any effect on the observations presented here, though an excess of sources in the bottom of the raster could potentially be related to structures in the dust trail. No such excess is seen. All observations presented here are in the LW10 filter, which is very similar to the IRAS 12 m filter in wavelength-dependent response. Since these fields are at high galactic lattitude (50 degrees), and, in the absence of cometary trails, are effectively blank fields, they become ideal for a deep survey of the extragalctic 12m source population. The positions of the fields are given in Table 1.
The data reduction process is described in detail in Paper 1. Basically, for each AOT file (total 4) the raw data (CISP format) and pointing history (IIPH format) are read and merged. The raw data cube (typically 1244 readouts of 32 by 32 pixels) is deglitched for fast and slow cosmic ray impacts. A transient correction is applied to recover the linearity and the nominal flux response of the camera. A triple–beam method is then applied to the processed data cube, in order to find the best (ON- (OFF1+OFF2)/2) differential value of the sky brightness for each pixel and each raster position, where OFF1 and OFF2 refer to the previous and next raster position value for the same camera pixel. The resulting low–level reduced cube is then simply flat–fielded (there is no need for a dark correction because we perform a differential measurement on the sky). The flat–fielded reduced cube along with an error cube is made up of 77 values for each of the 32 by 32 pixels of the camera. The 2 cubes are then projected onto the sky using an average effective position for ISO during each raster position, with a optimal weighting. A noise map is thus calculated as well as a sky differential map. Any given source will leave 2 negative half–flux ghosts 60 arcseconds away on both sides along the raster scan direction. This is a trade–off in order to beat the 1/f noise regime that is reached by the camera for long integrations per position. On the final map, shown in Fig. 1, we search for point sources with a Gaussian fitting algorithm that uses the noise map for weighting the pixels and deducing the noise of the final flux measurement. A FWHM of 9 arcseconds was used. The final internal flux is converted to Jy by using the ISOCAM cookbook value (Cesarsky et al., 1994). The present understanding of ISOCAM calibration is that no additional factor should be applied to the pre-flight sensitivity estimates for the determination of surface brightness.
We have devised a scheme to assess the reproducibility of the sources, in order to test for false sources that would be due to undetected glitches. This is described in detail in Paper I, but consists of breaking the observations of each object into a number of independent subsurveys. Sources are deemed reliable if they are detectable, with suitably reduced significance, in each of these subsurveys. Of the 193 sources above the 3 limit only 7 fail the reproducibility test (4%) and these are not considered in the following. Visual screening helped in removing a further 38 residual companions of strong sources due to imperfect fitting. Visual screening also showed that two sources, F1_0 and F2_0, were significantly extended at 12m. We thus use aperture photometry to obtain an accurate flux for these objects. The aperture used had a diameter of 20 arcsecs.
Simulation of the expected PSF from ISO after the same processing reveals that part of the flux is missed by the optimised Gaussian fitting. We therefore correct the fluxes and errors by a factor of 1.52 determined from this modelling. The final absolute photometry should be in error by no more than an estimated 30%. The fluxes are given at the nominal wavelength of 12 m (i.e. an additional correction of is applied since the nominal ISOCAM calibration is for a wavelength of 11.5m), in order to facilitate the comparison with previous IRAS observations. This assumes a flat spectrum in as was used for IRAS calibration. The flux prediction for known stars should thus be colour corrected, since they have a Rayleigh-Jeans spectral index, in order for comparison to ISOCAM measurements: the real flux at 12m should be divided by 0.902. An additional factor comes from the fact that the PSF is smaller for stellar sources (which are dominated by the short wavelength part of the broad filter) than for the assumed extragalactic sources which have a broader spectrum. Thus the real flux should also be multiplied by a supplementary factor of 1.13 (see Section 3.1 for this a priori calibration and the comparison with flux measurements of known stars in the fields). The basic calibration of ISOCAM, before the corrections for point sources are applied, can be checked by comparing the integrated surface brightness of these fields with values interpolated from the DIRBE experiment on COBE (Hauser et al. 1997a). The ISO surface brightnesses agree with the DIRBE values to better than 5%.
The sensitivity that is achieved in the central area of the fields is about Jy. This was achieved with a total integration time of 4 minutes for each camera field–of–view. Astrometry was assessed by matching ISO sources to bright stars in the fields. We estimate the astrometric accuracy to be 6” (2 ).
| Field | RA | Dec | l | b |
|---|---|---|---|---|
| Field 1 | 03 05 30 | -09 35 00 | 190.327 | -53.895 |
| Field 2 | 03 00 40 | -10 42 00 | 190.813 | -55.466 |
| Field 3 | 03 09 50 | -08 37 00 | 189.979 | -52.433 |
| Field 4 | 03 04 00 | -09 56 00 | 190.477 | -54.361 |
RA and Dec are in J2000. All fields have high galactic latitude 50 degrees, making them ideal for cosmological studies.
3 The 12m Source Population
A total of 186 candidate 12m sources are found in the survey to a 3 flux limit of 300Jy. Visual inspection then removes 38 of these sources as fragments of brighter sources incorrectly identified as separate objects, giving a master list of 148 objects. For the remainder of this paper we shall restrict ourselves to discussion of only those sources detected at 5 sensitivity or above in this master list. This is for several reasons. Firstly, a number of uncertainties remain in the identification of the weakest sources. These are the sources most likely to be affected by the remnants of subtracted glitches or by weak, undetected glitches. Further examination of the detailed time histories and reproducibilities of these sources is underway, and a full catalogue reaching to the faintest flux limits can then be constructed. Secondly, the problems of Malmquist bias (Oliver, 1995) are most easily controlled in catalogues detected with significances . A source list using a 5 detection threshold is thus best suited to our examination of the 12m source counts. 50 objects are detected at 5 or greater significance. Details of these objects are given in Table 2, and they are discussed further in the following sections.
| Name | F12(Jy) | RA(2000) | DEC(2000) | Class |
|---|---|---|---|---|
| F1_0 | 12147. 200. | 3 5 36.2 | -9 31 21.6 | Extended; IRAS Source |
| F1_1 | 4258. 219. | 3 5 4.5 | -9 31 6.6 | Star |
| F1_2 | 4155. 131. | 3 5 40.4 | -9 33 56.1 | Star |
| F1_3 | 3835. 99. | 3 5 15.1 | -9 31 17.6 | |
| F1_4 | 2150. 185. | 3 5 5.3 | -9 32 7.7 | |
| F1_5 | 1046. 102. | 3 5 24.5 | -9 35 50.7 | |
| F1_9 | 3732. 142. | 3 5 35.9 | -9 31 43.8 | |
| F1_10 | 1903. 185. | 3 5 6.1 | -9 32 41.5 | |
| F1_11 | 1324. 113. | 3 5 14.9 | -9 31 3.8 | |
| F1_12 | 842. 92. | 3 5 28.4 | -9 35 17.5 | |
| F1_18 | 2190. 171. | 3 5 36.3 | -9 31 32.2 | |
| F1_22 | 615. 112. | 3 5 33.0 | -9 31 50.4 | Star |
| F1_30 | 636. 88. | 3 5 30.7 | -9 33 13.4 | |
| F1_44 | 622. 109. | 3 5 36.7 | -9 32 30.1 | |
| F1_48 | 605. 119. | 3 5 11.0 | -9 33 10.0 | |
| F2_0 | 10479. 260. | 3 1 6.1 | -10 44 27.5 | GSC-galaxy; Extended |
| F2_1 | 6884. 175. | 3 0 36.7 | -10 36 57.3 | Star |
| F2_3 | 2385. 100. | 3 0 37.3 | -10 42 51.0 | |
| F2_6 | 911. 99. | 3 0 31.0 | -10 41 7.2 | |
| F2_12 | 744. 136. | 3 0 59.4 | -10 44 38.2 | |
| F2_16 | 770. 104. | 3 0 38.2 | -10 42 46.6 | Star |
| F2_23 | 702. 95. | 3 0 39.7 | -10 40 47.0 | Star |
| F2_24 | 814. 118. | 3 0 35.4 | -10 43 22.3 | |
| F2_80 | 522. 89. | 3 0 39.5 | -10 39 43.4 | |
| F2_87 | 536. 88. | 3 0 37.6 | -10 41 59.4 | |
| F2_195 | 464. 87. | 3 0 35.8 | -10 41 6.5 | |
| F3_0 | 7265. 104. | 3 9 42.6 | -8 35 33.4 | Binary Star |
| F3_1 | 3266. 98. | 3 9 56.7 | -8 36 24.5 | Star |
| F3_2 | 1901. 100. | 3 9 52.5 | -8 37 1.5 | Star |
| F3_3 | 1760. 95. | 3 10 0.9 | -8 39 39.2 | |
| F3_4 | 1682. 105. | 3 10 9.1 | -8 38 57.2 | |
| F3_5 | 1374. 108. | 3 9 44.7 | -8 32 55.6 | |
| F3_9 | 5444. 93. | 3 9 42.2 | -8 35 50.3 | Binary Star |
| F3_15 | 597. 100. | 3 10 3.3 | -8 37 46.7 | |
| F3_34 | 639. 105. | 3 9 46.1 | -8 32 44.0 | |
| F3_37 | 648. 101. | 3 9 57.4 | -8 36 44.2 | |
| F4_0 | 7684. 140. | 3 3 54.5 | -9 59 6.7 | Star |
| F4_1 | 3670. 149. | 3 4 3.4 | -10 1 18.0 | |
| F4_2 | 3581. 155. | 3 3 35.8 | -9 55 43.1 | |
| F4_3 | 3207. 84. | 3 3 55.2 | -9 56 59.9 | |
| F4_4 | 3166. 357. | 3 3 53.8 | -9 50 40.0 | Star |
| F4_5 | 2481. 215. | 3 3 47.3 | -9 59 18.2 | |
| F4_6 | 3051. 197. | 3 4 6.3 | -9 53 47.6 | |
| F4_9 | 1234. 95. | 3 3 56.8 | -9 57 31.3 | |
| F4_11 | 806. 89. | 3 4 1.4 | -9 57 36.6 | |
| F4_12 | 933. 106. | 3 3 54.7 | -9 58 45.6 | |
| F4_24 | 559. 92. | 3 3 58.0 | -9 59 5.2 | |
| F4_28 | 474. 88. | 3 3 55.6 | -9 56 11.0 | |
| F4_57 | 615. 118. | 3 3 55.8 | -9 59 28.3 | |
| F4_68 | 690. 87. | 3 3 55.7 | -9 56 40.4 | Star |
Objects are classified as stars based on their optical/IR colours (see section 3.1). The object indicated as GSC-galaxy is in the GSC but inspection of the DSS image reveals it to be a galaxy. Two of the stars F3_0 and F3_9 are very close, precluding accurate photometry.
3.1 Optical Identifications and Star-Galaxy Separation
Comparison of the 12m ISOCAM images with Digital Sky Survey (DSS)111Based on photographic data of the National Geographic Society – Palomar Observatory Sky Survey (NGS-POSS) obtained using the Oschin Telescope on Palomar Mountain. The NGS-POSS was funded by a grant from the National Geographic Society to the California Institute of Technology. The plates were processed into the present compressed digital form with their permission. The Digitized Sky Survey was produced at the Space Telescope Science Institute under US Government grant NAG W-2166. images shows that a number of the sources are associated with bright stars. Before we are able to analyse the galaxy component of the 12m source population, these and any other contaminating stars must be identified and removed. This was achieved by using the US Naval Observatory (USNO) all-sky photometric catalogue (Monet et al., 1996). The database was searched for all optical objects within 12 arcseconds of each ISO position. 12 sources were immediately identified with HST Guide Star Catalogue (GSC) stars, though inspection of the DSS images shows that one of these is in fact a galaxy (03 01 06.16 -10 44 23.6, the GSC ‘star’ 5290_640). B and R band photometry was extracted for 29 of the 32 optically identified objects – three of the GSC stars were too bright to allow photometry from the B survey plates used by the USNO catalogue. These magnitudes were then corrected for the estimated galactic extinction. A comparison of the final FB/FR and F12/FR flux ratios was then made. Figure 2 shows the optical/ISO colour-colour diagram, together with a Black Body colour track. Simple stars, without associated dust or stellar companions, should lie on or near to this colour track. As can be seen, almost all of the GSC stars and several other objects lie near to the Black Body line. This allows us to remove all those stars that have not been identified in the GSC. Three such objects are removed. One star (F3_9: 03 09 42.14 -08 35 44.6) seems to be anomalously blue (B-R = -0.8 from the USNO catalogue). However, this object and another bright star (F3_0: 03 09 42.6 -08 35 33.4) are so close to one another that accurate photographic photometry is likely to be difficult, resulting in the anomalous colours. These objects are removed from further analysis.
Of the 32 optically identified 12m sources we thus conclude that 13 are stars and that the remaining 19 are optically identified galaxies. 18 sources, all probably galaxies, thus remain without optical identifications to the limits of the USNO-A catalogue ie. around 20th magnitude in B and R.
The colour-colour plot also allows us to check the calibration for the 12m survey. We can use the B-R colours to provide a rough spectral type for all stars in the survey. This can then be cross-referenced to the surface temperature of that stellar type. The 12m flux can then be extrapolated from the R band flux, assuming a simple Black Body spectrum. This approach suggests that the flux calibration is accurate at the 20% level (see Table 3). We have also checked these results using detailed spectral energy distributions (SEDs) based on the Kurucz stellar atmosphere codes instead of a simple Black Body extrapolation, and arrive at very similar conclusions. The main source of uncertainly here is the treatment of undersampled unresolved sources in the ISOCAM reduction systems. As more data becomes available on the details of the ISOCAM PSF, this systematic uncertainty will be reduced. There is also the possibility that one or more of the stars in the survey have genuine IR excesses. Ground-based near- to mid-IR photometry will be required to confirm this.
| Name | F12(Jy) | Bmag | Rmag | F12PRED (Jy) | Pred/Obs | Excess? |
|---|---|---|---|---|---|---|
| F1_1 | 4258 | 12.6 | 11.7 | 1794 | 0.42 | Yes |
| F1_2 | 4155 | 10.9 | 10.3 | 4962 | 1.19 | |
| F1_22 | 615 | 13.1 | 12.7 | 442 | 0.72 | |
| F2_1 | 6884 | 13.1 | 11.3 | 8018 | 1.16 | |
| F2_16 | 770 | 13.7 | 12.7 | 747 | 0.97 | |
| F2_23 | 702 | 13.7 | 12.9 | 540 | 0.77 | |
| F3_2 | 1902 | 13.5 | 12.3 | 1220 | 0.64 | |
| F3_1 | 3266 | 13.5 | 12.0 | 2289 | 0.70 | |
| F4_68 | 690 | 13.7 | 12.9 | 720 | 1.04 |
Predicted fluxes are calculated as described in the text. A star is described as having a candidate IR excess if its predicted flux is less than half the measured flux.
We are then able to remove all 13 stars from the 12m source lists generated in this survey, and can thus examine the statistics of faint galaxies at 12m.

Triangles are anonymous 12m sources, stars are objects identified with GSC stars, the line shows the locus for Black Bodies, with temperature decreasing from 10000 K in the lower left. Points on the line lie at 1000K intervals. Note the concentration of stars on the Black Body line, and the majority of sources lying well away from the line. This allows star-galaxy separation.
3.2 Individual Sources
We discuss here individual sources of note in this survey.
IRAS 03031-0943 This lies at 03 05 36.4 -09 31 27.0 (J2000) and is an IRAS source identified with a B=18.6 galaxy at z=0.112 (Clements et al., 1996a). It is associated with object F1_0 in the present survey. This galaxy has IRAS fluxes of 0.85 and 0.51 Jy at 100 and 60m respectively, and limits of 0.15 and 0.095 Jy at 25 and 12m, consistent with the measured ISO 12m flux of 12.10.2 mJy. This galaxy has a 60m luminosity of 10 (H0=100kms-1Mpc-1, q0=0.5) which places it among the high luminosity IRAS galaxies but at lower luminosity than the ultraluminous class (see eg. Sanders & Mirabel, 1996). Its optical spectrum contains strong emission from the H-NII blend and SII, but the redshift measurement spectrum is of too low a resolution to provide any emission line diagnostics (Clements, private communication). We thus do not know what sort of power source is energetically dominant in this object — starburst or AGN.
NPM1G-10.0117 This lies at 03 01 06.2 -10 44 24 (J2000) and is a B=16.63 galaxy used in a proper-motion survey (Klemola et al., 1987). It is associated with object F2_0 in this survey, and has a 12m flux of 9.100.26 mJy. It is also identified with HST Guide Star GSC 5290_640, but is clearly a galaxy in the Digitised Sky Survey images. Little else is currently known about it.
Altogether, we can say relatively little about the galaxies identified so far in this survey since the identification programme has only just started. Nevertheless, it is a useful check of the processing to note that the only IRAS galaxy within the survey region has been detected by ISOCAM.
4 The 12 m Number Counts
Integral number counts from a survey with homogeneous sensitivity are calculated by summing up the number of sources to a given flux limit, and then dividing by the survey area:
| (1) |
where is the area of the survey. However, in our case
the noise in the survey is inhomogeneous (it has a bowl-like shape) since
the border pixels were observed with smaller integration times. We thus have
to make a correction to equation 1 to account for this.
If we define , where is the area where the
sensitivity is
better than , then the corrected number counts are given by:
| (2) |
where n is the detection threshold of the survey. In the present paper we consider only those sources detected at confidence, so n=5. We plot the area coverage, , in Fig. 3.

A correction must also be applied to account for Malmquist bias (Oliver, 1995). This bias arises when looking at number counts for a population with rapidly increasing numbers at fainter fluxes, as is the case for our 12m galaxy sample. In the presence of observational noise, some galaxies close to, but below, the flux limit will be scattered above the flux limit by noise and will appear in the final catalogue. Similarly some galaxies close to but above the flux limit will be scattered out of the catalogue. However, since there are many more galaxies at fainter fluxes, more galaxies will be scattered above the flux limit than below it. Number counts that are uncorrected for this bias thus show a steep rise in counts towards the faintest flux levels. In the case of Gaussian noise and a Euclidean count slope, which approximates to the present case, Murdoch et al (1973) tabulated the effects of this bias to a detection level of 5, allowing for the observed fluxes to be corrected. Oliver (1995) provides a numerical version of this correction which we apply here. For observations probing below the 5 limit this simple correction cannot be applied, and a more complex Monte Carlo approach must be adopted (eg. Bertin et al. 1997).

This plot presents the current observational state of knowledge on galaxy counts at 12m. Since the errors in integral-counts plots are correlated, we show the areas allowed within the error bars as shaded regions. The cross-hatched region indicates the deep IRAS counts from Hacking & Houck (1987) including stars. Triangles indicate the galaxy content of this survey (lower) and the Gregorich et al. survey (1995) (upper). The solid region in the bottom left shows the counts from the extended IRAS galaxy survey by Rush et al. (1993) using the all-sky IRAS Point source Catalogue, with the area of this survey taken from Oliver et al. (1997). The single-hatched region shows the results of the present work, reaching fainter magnitudes than previous 12m studies. The 13 stars among the 50 objects detected at are not included in these count statistics. The triangle in the top right shows the ISOHDF counts at 15m (Oliver et al. 1997) – note that no correction has been applied to this data to convert from 15 to 12 m. The solid line is the strong evolution model which is discussed in the text.
Figure 4 shows the Malmquist-bias corrected integral number count plot from the present work and from 12m IRAS surveys, along with some other information. The first thing to notice in this diagram is that we have reached flux limits almost 100 times fainter than the deepest IRAS number counts at these wavelengths. We are thus able to see much deeper into the universe than the IRAS surveys and can provide considerably more powerful sampling of the 12m galaxy population.
Secondly, our survey is the first flux limited 12m survey to be dominated by galaxies rather than stars. The deepest IRAS sample (Hacking & Houck 1987) included 50 objects of which only 5 were galaxies. As discussed above, the present survey contains 50 objects above the 5 flux limit, of which only 13 are stars.
The integral counts of stellar identifications in the 12 m survey are shown in Fig. 5. We find good agreement with model counts by Franceschini et al. (1991) based on the Bahcall and Soneira galactic model and on a stellar luminosity function scaled from the V band to according to Hacking & Houck (1987). This agreement suggests that no major new stellar component is emerging at faint fluxes with respect to those detected in the optical.

Same as in Fig. 4, but for the 13 sources identified as stars in the 12m survey. The fluxes are corrected by a factor 1/1.25 to account for the wide LW10 response function and for the typical SEDs of stars. A comparison is made with the model stellar counts from Franceschini et al. (1991).
We have so far shown the integral number counts for the galaxies in our survey. A more statistically meaningful way to compare observed and theoretical number counts is to examine them in a differential form, i.e. versus . This is done in Fig. 6, where we report the Euclidean-normalised differential counts from our 12m survey compared to the 15m number counts derived from ISOCAM observations of the Hubble Deep Field (Paper I). The lines correspond to predictions for Euclidean-normalised counts based on both non-evolving and strongly evolving population models.
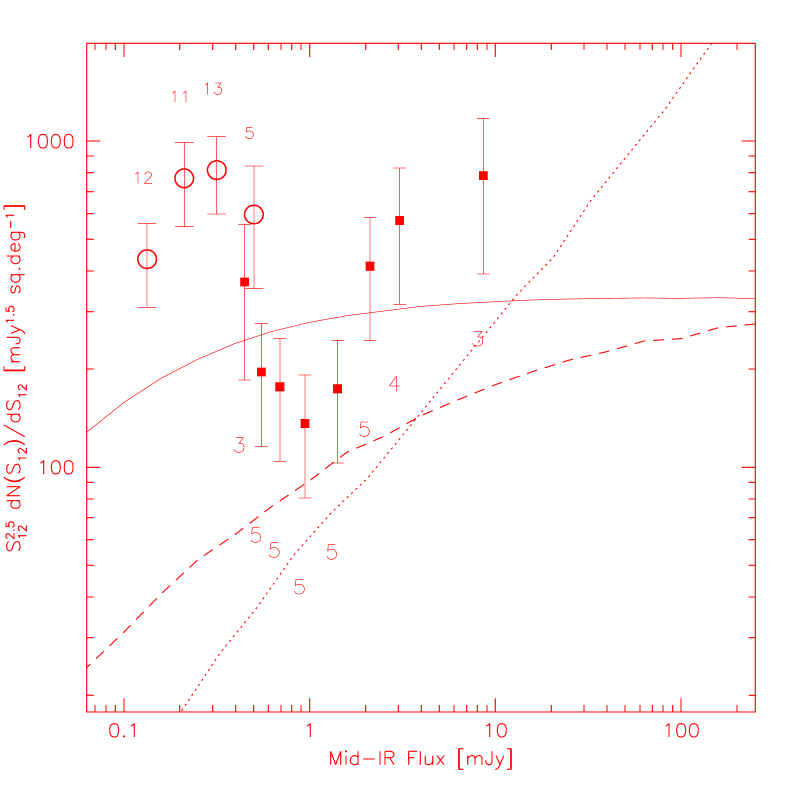
The differential counts of sources identified with galaxies in the LW10 survey are normalised here to the Euclidean law . The filled squares are from our 12 m survey, the open circles from the 15 m survey in the Hubble Deep Field (all with Poissonian error bars). The number associated with each bin indicates the number of sources in the bin. The dashed line is the no-evolution curve, while the continuous line corresponds to the model with evolution. The dotted line provides a comparison with the expected stellar counts (see the corresponding integral counts in Fig. 4).
The no-evolution model is based on the local luminosity function (Saunders et al., 1990) at 60m and on the Rush et al (1993) results at 12m. (for more details see Franceschini et al. 1997). This minimal curve significantly under predicts the observed counts from ISO. We thus appear to have detected evolution in the 12m source population at a significance level.
On the other hand, our observed 12m counts are matched by a model assuming an evolving luminosity function. This is described in terms of two populations, which we assume dominate the extragalactic sky at these wavelengths:
(1) Gas-rich systems, i.e. spiral, irregular and starbursting galaxies, with luminosity functions evolving with cosmic time as , where is the locally observed distribution (see above), is the lookback time , where t is the age of the universe at a redshift z and is the present age, and is the evolution parameter. This corresponds to density evolution, yielding an average increase in galaxy co-moving number density of a factor of 5.8 at z=1 (for an assumed =0.15 value of the cosmological deceleration parameter).
(2) Active Galactic Nuclei, which are described by a model based again on the Rush et al. (1993) local luminosity function and assuming pure luminosity evolution: , where with .
Note that the same model with the additional contribution of a population of high-redshift starbursts (forming elliptical and S0 galaxies as described by Franceschini et al. 1994) accounts nicely for the cosmological far-IR background recently detected in the far-infrared and submillimeter wavebands by Puget et al. (1996), Hauser et al. (1997b) and Fixsen et al (1998).
It is also interesting to compare the 12m counts described here with the 15m counts from the HDF. These counts are derived from two different ISOCAM filters (LW10 and LW3) with rather different response functions. As can be seen in Fig. 6, there appears to be a clear offset between the two differential galaxy counts by roughly a factor 2 – 4 (though the two bins with overlapping fluxes are in formal agreement). No simple model can explain this shift in the counts by such a large factor over such a narrow flux interval. We interpret this shift as probably not due to actual changes in the counts, but to the different responses of the LW10 and LW3 filters to the complex SEDs of galaxies in the mid-IR. Specifically the 7m PAH emission feature, which enters the LW3 15m band at z0.5 to 1, and the 10m absorption feature. Unfortunately, the strength of these mid-IR spectral features varies considerably from object to object (see eg. Elbaz et al., 1998). A full understanding of the effects of these features on mid-IR number counts thus awaits a better theoretical treatment, a better understanding of the variation of these features locally, and a better idea of the nature of objects making up the milli–Jansky 12m source population. Xu et al. (1998) used a three component model including cirrus, starburst and AGN contributions to fit the mid-IR SEDs of a large sample of local galaxies. They then extrapolate from this to predict the effects of the mid-IR SEDs on number counts under various evolutionary assumptions. Such an approach may be useful for understanding the present work and its relation to the ISOHDF data. However, assumptions would have to be made about the nature of the faint mid-IR galaxy population, and whether it was significantly different from the local galaxies studied in detail by IRAS and ISO. There are already suggestions from the ISOHDF that there are more and bigger starbursts in the faint mid-IR selected galaxies than in the local population (Rowan-Robinson et al., 1997). At this stage we lack redshifts, and thus luminosity and star-formation-rate estimates, for our 12m galaxies. A large number of assumptions would thus need to be made about these objects for an empirical approach similar to Xu et al. (1998) to be applied. There would thus be considerable uncertainties in such an analysis.
A proper test of models of this population is thus even more critically dependent on obtaining the redshifts of individual sources than similar work at optical or far-IR wavelengths. We have therefore begun a followup programme to identify and determine the redshifts for all the 12m galaxies discussed in this paper. Once this data is available, we will be able to draw firmer conclusions about the nature and evolution of the mJy 12 source population.
Our number counts can directly set a lower limit to the extragalactic infrared background light between 8 and 15 m. By integrating the light from the galaxies with a flux larger than 0.5 mJy, we find that . An upper limit of has been reported by Hauser et al. (1998) from DIRBE (COBE) measurements, which are hampered by the zodiacal light.
5 Conclusions
We have performed a deep survey at 12m using the CAM instrument on the ISO satellite. We have detected 50 objects to a 5 flux threshold of Jy. in a 0.1 deg2 area, of which 13 appear to be stars on the basis of optical images and optical-IR colours. The remaining 37 objects appear to be galaxies. We have examined the source count statistics for this population and find evidence for evolution in this population, while for stars the counts are consistent with current galactic structure models and extrapolations of the optical luminosity functions to the mid-IR.
Our galaxy counts, when compared with the deep ISOCAM counts in the Hubble Deep Field using the LW3 15m filter, also show evidence for significant effects from the complex mid-infrared features in the spectral energy distributions of galaxies.
Acknowledgements.
It is a pleasure to thank Herve Aussel, David Elbaz, Matt Malkan and Jean-Loup Puget for helpful comments and contributions. The Digitised Sky Survey was produced at the STSCI under US Government Grant NAG W–2166. This research has made use of the NASA/IPAC Extragalactic Database (NED) which is operated by the Jet Propulsion Laboratory, California Institute of Technology, under contract with the National Aeronautics and Space Administration. The USNO-A survey was of considerable help, and we would like to express our thanks to all those who helped to produce it. DLC and ACB are supported by an ESO Fellowship and by the EC TMR Network programme, FMRX-CT96-0068.References
- (1) Abraham, R.G., Tanvir, N.R., Santiago, B.X., Ellis, R.S., Glazebrook, K., van den Bergh, S., 1996, MNRAS, 279, L47
- (2) Aussel, H., Cesarsky, C. J., Elbaz, D. and Starck, J.-L., 1998, A&A, submitted
- (3) Bertin, E., Dennefeld, M., Moshir, M., 1997, A&A, 323, 685
- (4) Cesearsky, C.J., et al., 1994, The ISOCAM Observers Manual, ESA, Noordwijk.
- (5) Cesarsky, C.J., et al., 1996, A&A, 315, L32
- (6) Clements, D.L., Sutherland, W.J., Saunders, W., McMahon, R.G., Maddox, S., Efstathiou, G.P., Rowan-Robinson, M., 1996a, MNRAS, 279, 459
- (7) Clements, D.L., Sutherland, W.J., Saunders, W., McMahon, R.G., 1996b, MNRAS, 279, 477
- (8) Cowie, L.L., Gardner, J.P., Hu, E.M., Songaila, A., Hodapp, K-W., Wainscoat, R.J., 1994, ApJ, 434, 114
- (9) Davies et al., 1997, Icarus, 127, 251
- (10) Desert, F-X., Puget, J-L., Clements, D.L., Perault, M., Abergel, A., Bernard, J-P., Cesarsky, C.J., 1998, A&A, in press, Paper I
- (11) Elbaz et al., 1998, to appear in Proceedings of the Liege NGST Workshop, astro-ph/9807209
- (12) Fang et al., 1996, BAAS, 189, 5101
- (13) Fixsen, D.J., Dwek, E., Mather, J.C., Bennett, C.L., Shafer, R.A., ApJ., in press
- (14) Franceschini, A., de Zotti, G., Toffolatti, L., Mazzei, P., Danese, L., 1991, A&AS, 98, 285
- (15) Franceschini, A., Mazzei, P., de Zotti, G., Danese, L., ApJ., 427, 140
- (16) Franceschini, A., p. 509, in Extragalactic Astronomy in the Infrared, proceedings of the 17th Moriond Conference, ed. Mamon, G.A., Thuan, T.X., Van, J.T.T., pub. Edition Frontieres, Paris
- (17) Giavalisco, M., Steidel, C.C., Macchetto, F., 1996, ApJ., 470, 189
- (18) Gregorich, D.T., Neugebauer, G., Soifer, B.T., Gunn, J.E., Herter, T.L., 1995, AJ, 110, 259
- (19) Hacking, P., 1987, PhD Thesis
- (20) Hacking, P., Houck, J. R., 1987, ApJSS, 63, 311
- Hauser et al. (1997) Hauser, M. G., Kelsall, T., Leisawitz, D., & Weiland, J. L., 1997a, eds., COBE Diffuse Infrared Background Experiment Explanatory Supplement, version 2.1, COBE reference publication #97-A (Greenbelt: NASA/GSFC), available in electronic form from the National Space Science Data Center
- (22) Hauser et al., 1997b, BAAS, 191, 910
- (23) Hauser et al., 1998, ApJ, in press, Astro-ph//9806167
- (24) Joseph, R.D., Wright, G.S., 1985, MNRAS, 214, 87
- (25) Kawara, K., et al., 1998, A&A, submitted.
- (26) Kessler, M.F., Steinz, J.A., Anderegg, M.E., et al. 1996, A&A, 315, L27
- (27) Klemola, A.R., Jones, B.F., Hanson, R.B., 1987, AJ, 94, 501
- (28) Lawrence, A., Rowan-Robinson, M., Leech, K., Jones, D.H.P., Wall, J.V., 1989, MNRAS, 240, 329
- (29) Lilly, S.J., Le Fevre, O., Hammer, F., Crampton, D., 1996, ApJ., 460, L1
- (30) Madau, P., Pozzetti, L., Dickinson, M., 1998, ApJ., 498, 106
- (31) Monet, D., et al., 1996, USNO-A Catalogue, US Naval Observatory, Flagstaff Station
- (32) Murdoch, H.S., Crawford, D.F., Jauncy, D.L., 1973, ApJ., 183, 1
- (33) Okuda, H., in Proceedings of Astrophysics with Infrared Surveys, 1998, ed. Bicay, M., in press
- (34) Oliver, S.J., 1995, in Wide-Field Spectoscopy and the Distant Universe, eds. Maddox, S.J., & Aragon-Salamanca, pub. World Scientific
- (35) Oliver, S.J., et al., 1997, MNRAS, 289, 471
- (36) Puget, J-L., Abergerl, A., Bernard, J-P., Boulanger, F., Burton, W.B., Desert, F-X., Hartmann, D., 1996, A&A, 308, L5
- (37) Puget, J-L., et al, 1999, A&A, in press
- (38) Rowan-Robinson, M., Broadhurst, T., Oliver, S.J., Taylor, A.N., Lawrence, A., McMahon, R.G., Lonsdale, C.J., Hacking, P.B., Conrow, T., 1991, Nat., 352, 677
- (39) Rowan-Robinson et al., 1997, MNRAS, 289, 490
- (40) Rush, B., Malkan, M., Spinoglio, L., 1993, ApJS., 89, 1
- (41) Sanders, D.B., & Mirabel, I.F., ARAA, 34, 749
- (42) Saunders, W., Rowan-Robinson, M., Lawrence, A., Efstathiou, G., Kaiser, N., Ellis, R.S., Frenk, C.S., 1990, MNRAS, 242, 318
- (43) Serjeant, S., Lacy, M., Rawlings, S., King, L.J., Clements, D.L., 1995, MNRAS, 276, L31
- (44) Steidel, CC., Giavalisco, M., Pettini, M., Dickinson, M., Adelberger, KL., 1996, ApJ., 462, L17
- (45) Stockman, P., Mather, J., 1997, BAAS, 191, 5403
- (46) Sykes, M.V., Walker, R.G., 1992, Icarus, 95, 180
- (47) Werner, M.W., Bicay, M.D., 1997, BAAS, 191, 4207
- (48) Xu, C., Hacking, P.B., Fang, F., Shupe, D.L., Lonsdale, C.J., Lu, N.Y., Helou, G., ApJ., 508, 576