plots/
SNR G320.4–01.2 and PSR B1509–58: New radio observations of a complex interacting system
Abstract
We describe radio continuum and spectral line observations of the source G320.4–01.2 (MSH 15–52) and the coincident young pulsar B1509–58 made with the Australia Telescope Compact Array. Based on a comparison between X-ray and radio observations, we argue that the two main radio components of G320.4–01.2 are a single supernova remnant (SNR), which H i absorption indicates is at a distance of kpc. A high-resolution correspondence between radio and X-rays argues that the pulsar is interacting with the SNR via an opposed pair of collimated outflows. The outflow itself is seen as an elongated X-ray feature surrounded by a highly polarized radio sheath, while the interaction with the SNR manifests itself as a ring of radio/X-ray knots within the optical nebula RCW 89. We reject the hypothesis that the pulsar outflow powers the entire RCW 89 region.
SNR G320.4–01.2 and PSR B1509–58 agree in distance and in rotation measure, and appear to be interacting. We thus conclude that the two objects are associated and have an age of 1700 yr. We propose that the SNR resulted from a high-energy or low-mass supernova which occurred near the edge of an elongated cavity. Such a model can account for the SNR’s bilateral appearance, its large apparent age, the significant offset of the pulsar from the SNR’s centre and the faintness of the pulsar-powered nebula at radio wavelengths.
keywords:
ISM: individual: G320.4–01.2, RCW 89 – ISM: jets and outflows – pulsars: individual: B1509–58 – radio continuum: ISM – shock waves1 Introduction
A massive star ends its life in a supernova. This produces a supernova remnant (SNR) and often also an associated neutron star, the latter sometimes observable as a pulsar. However, associations between SNRs and pulsars are rare: 30 years of effort have provided fewer than ten convincing cases (e.g. Kaspi 1996). Such associations can clarify questions regarding pulsar velocities, ages, magnetic fields and initial spin periods, and can help us to understand the evolution and appearance of SNRs. Thus establishing the validity of an association is of great interest, as are subsequent studies of a particular pulsar/remnant pairing.
Of such systems, one of the best studied but least understood is that involving the peculiar SNR G320.4–01.2 and the energetic young pulsar B1509–58. In this paper we present a new radio study of this intriguing pair of objects.
1.1 Previous Observations
1.1.1 Radio
The radio source G320.4–01.2 (MSH 15–52, Kes 23) was detected in the earliest radio surveys of the southern sky [Mills, Slee & Hill 1960, Komesaroff 1966, Hill 1968, Kesteven 1968, Day, Thomas & Goss 1969], and was soon classified as a SNR on the basis of its non-thermal spectrum and lack of hydrogen recombination lines [Milne et al. 1969, Milne 1970, Shaver & Goss 1970a]. Early images of the source [Shaver & Goss 1970b, Milne 1972, Milne & Dickel 1975] showed (at least) two distinct components: a bright double source to the north-west, and fainter extended structure to the south-east. Subsequent observations at sub-arcmin resolution [Caswell, Milne & Wellington 1981, Manchester & Durdin 1983, Whiteoak & Green 1996] showed the north-western component to be dominated by a central clumpy ring, and the south-eastern source to be comprised of complex filamentary structure, as shown in Figure 1. Both components are extended along a direction parallel to the Galactic Plane, with a gap between them.
The radio morphology of G320.4–01.2 is unusual. Its two well-separated components can only be considered a single shell in the broadest of interpretations; the unusual collections of knots and filaments, and the distinct gaps in emission to the north-east and south-west, need to be explained. The region is probably the site of many supernovae in the recent past [Lortet, Georgelin & Georgelin 1987], and one possibility is that the components of G320.4–01.2 may actually be multiple SNRs. Wide-field observations of the region [Milne, Caswell & Haynes 1993, Whiteoak & Green 1996] reveal a pair of polarized radio arcs 30 arcmin to the south-east of G320.4–01.2, which have been designated G320.6–01.6. It is not clear whether this structure is another part of G320.4–01.2 or is a separate SNR.
1.1.2 X-ray
The first X-ray image of the region revealed a surprise: a 150-ms pulsar B1509–58 within the SNR [Seward & Harnden Jr. 1982]. The pulsar was subsequently detected in the radio [Manchester, Tuohy & D’Amico 1982] and -ray [Wilson et al. 1992, Ulmer et al. 1993] bands. Radio timing observations [Manchester, Durdin & Newton 1985, Kaspi et al. 1994] show PSR B1509–58 to have the highest period derivative (), the second lowest characteristic age ( yr) and the third highest spin-down luminosity ( erg s-1) of any known pulsar.
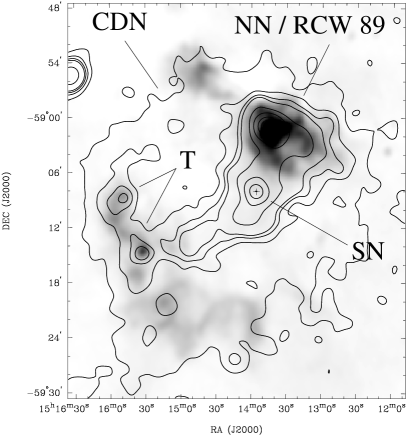
The X-ray morphology of the SNR is shown in Figure 1. The pulsar is embedded in a 5–10 arcmin non-thermal nebula (region “SN” of Figure 1) [Seward et al. 1984, Greiveldinger et al. 1995, Marsden et al. 1997], presumed to be synchrotron emission from a pulsar wind nebula (PWN). There is no obvious radio counterpart to this PWN. To the north-west of the pulsar is an extended thermal X-ray source (region “NN”) [Seward et al. 1983, Trussoni et al. 1996, Tamura et al. 1996], whose position and morphology closely correspond to the brightest radio emission [Brazier & Becker 1997]. A diffuse bridge of emission joins the “SN” and “NN” regions. Another bridge connects the “SN” region to X-ray emission south-east of the pulsar (region “T”). Region “T” appears to coincide in position and morphology with the south-eastern component of the radio SNR [Trussoni et al. 1996]. The lowest level X-ray contour envelopes the entire SNR (region “CDN”).
1.1.3 Optical and Infrared
The bright north-western X-ray and radio source coincides with the collection of irregular filaments which make up the H nebula RCW 89 [Rodgers, Campbell & Whiteoak 1960, Seward et al. 1983]. Other nearby nebulosities are probably unrelated to the SNR [Lortet, Georgelin & Georgelin 1987]. The infrared point source IRAS 15099–5856 is coincident with the pulsar, but its nature is uncertain [Arendt 1991].
1.2 Are G320.4–01.2 and B1509–58 associated?
PSR B1509–58 is a young pulsar located near the centre of a SNR. At first glance, a physical association with G320.4–01.2 seems assured. However, such a claim should be treated with caution: a young pulsar need not have an associated SNR [Kafatos et al. 1980, Braun, Goss & Lyne 1989], and line-of-sight coincidences are rife (Gaensler & Johnston 1995a,b). There are several criteria by which an association can be judged. The most useful are agreement in distance and age estimates, a reasonable implied transverse velocity for the pulsar, evidence from the pulsar’s proper motion, and any indication of an interaction between the pulsar and the SNR.
H i absorption towards RCW 89 [Caswell et al. 1975] puts the SNR at a distance of 4.2 kpc, slightly less than the pulsar’s distance of 5.90.6 kpc as derived from its dispersion measure [Taylor & Cordes 1993]. A more serious discrepancy lies in the ages of the two systems: unless one invokes a time-variable braking index, PSR B1509–58 can be no older than 1700 yr [Kaspi et al. 1994]. But assuming standard supernova and interstellar medium (ISM) parameters, Seward et al. [Seward et al. 1983] calculate an age for the SNR in the range yr. Proper motion measurements of the optical filaments in RCW 89 also imply a remnant age much greater than that of the pulsar [van den Bergh & Kamper 1984]. One way of reconciling the SNR and pulsar ages is by invoking rapid expansion of the SNR shell into a cavity, followed by an encounter with dense surrounding material [Seward et al. 1983, Manchester 1992].
Calculating the transverse pulsar velocity implied by an association requires a determination of the pulsar birthplace. This is straightforward when the SNR is a near-circular shell, but is more difficult for the complex morphology of G320.4–01.2. Suffice to say that the pulsar’s current position well within the SNR’s perimeter implies a projected velocity less than 3000 km s-1. No proper motion has yet been detected [Kaspi et al. 1994].
In order to explain RCW 89’s bright appearance in X-rays, Seward et al. [Seward et al. 1983] suggested that it is powered by an outflow of energy from the pulsar. Tamura et al. [Tamura et al. 1996] revive this interpretation, showing that the X-ray bridge joining the pulsar and RCW 89 has a non-thermal spectrum. They propose that this bridge is a jet flowing out from the pulsar and illuminating RCW 89. Manchester & Durdin [Manchester & Durdin 1983] and Manchester [Manchester 1987] describe a related idea, noting that the two components of the radio remnant can be mapped onto opposed cones emanating from PSR B1509–58. They suggest that the radio morphology of the SNR may be generated by opposed beams of particles originating from the pulsar and colliding with the surface of a surrounding cavity. Brazier & Becker [Brazier & Becker 1997] provide X-ray evidence for this model, pointing out that the PWN has a cross-shaped appearance, possibly corresponding to a highly inclined version of the “torus + jets” geometry of the Crab Nebula in X-rays [Hester et al. 1995]. The “jets” align with the axis of proposed outflow (presumed also to be the pulsar’s rotation axis) and one of them maps onto the ring of X-ray knots seen at the peak of RCW 89.
There are two main problems with the argument that the RCW 89 region is powered purely by an outflow from the pulsar. First, the total thermal energy in RCW 89 ( erg; Tamura et al. 1996) exceeds the entire energy lost by the pulsar over its lifetime for any but very rapid initial periods. Second, the mechanism by which a large thermal nebula might be created at the termination of such an outflow is unclear [Tamura et al. 1996]. Both these issues must be resolved if this model is to be considered a possibility.
2 New Observations
Clearly, there are many issues still to be resolved involving SNR G320.4–01.2 and PSR B1509–58. This has prompted us to carry out a set of new radio observations, using the Australia Telescope Compact Array (ATCA; Frater, Brooks & Whiteoak 1992), a synthesis telescope located near Narrabri, NSW, Australia. The ATCA consists of five moveable 22-m antennas on a 3-km east-west track, with a fixed sixth antenna stationed 3 km further west. Five types of observations were carried out, as detailed in Table 1:
-
1.
continuum observations at 20 cm (1.3 GHz) and 6 cm (4.8 and 5.8 GHz);
-
2.
pulsar-gated observations;
-
3.
observations in the H i spectral line;
-
4.
observations in the 1720-MHz OH maser line;
-
5.
observations in the H140 recombination line (2371.1 MHz).
H i and ungated continuum observations at 20 cm consisted of two fields covering the entire SNR. Continuum observations at 6 cm were a mosaic of eight fields, covering RCW 89, a region around B1509–58 and part of the south-eastern component. OH, H140 and pulsar-gated observations consisted of a single pointing towards RCW 89. All four Stokes parameters were recorded in continuum, while total-intensity alone was recorded for line observations. The flux density scale of all data was tied to the revised scale of Reynolds [Reynolds 1994] using observations of PKS B1934–638. Antenna gains were determined using regular observations of MRC 1613–586 (20-cm continuum, H i and H140), PKS B1740–517 (6-cm continuum) and PKS B0823–500 (OH).
| Date | Array | Maximum | Time on | ||
|---|---|---|---|---|---|
| Config | Baseline (m) | (MHz) | (MHz) | Source (h) | |
| 1995 Nov 03 | 6A | 5939 | 1344 | 1420a | 4 |
| 1995 Nov 11 | 6A | 1721b | – | 3 | |
| 1996 Feb 01 | 0.75B | 765 | 1344 | 1420a | 3 |
| 1996 May 10 | 1.5D | 1439 | 1376 | 1420a | 16 |
| 1996 May 12 | 1.5D | 4790 | 5824 | 6 | |
| 1996 May 13 | 0.75D | 719 | 4790 | 5824 | 9 |
| 1996 May 16 | 0.75D | 1344 | 1420a | 12 | |
| 1996 May 17 | 0.75D | 4790 | 5824 | 12 | |
| 1996 Nov 10 | 0.75A | 735 | 2371c | 1376d | 13 |
| 1997 Apr 18 | 0.375 | 459 | 1344 | 1420a | 11 |
| 1997 Apr 20 | 0.375 | 4800 | 5824 | 13 |
a H i observations (1024 channels across 4 MHz)
b OH observations (1024 channels across 4 MHz); these observations also formed part of the survey of Green et al. (1997), but have been reprocessed here
c H140 observations (256 channels across 8 MHz)
d Pulsar-gated observations (similar to continuum mode, but where data were sampled every 4.7 ms and then folded at the apparent period of PSR B1509–58)
3 Data reduction
Reduction and analysis were carried out within the MIRIAD package [Sault, Teuben & Wright 1995]. Data were edited and calibrated using standard techniques [Sault & Killeen 1998]. The field of the calibrator MRC 1613–586 contains several weak confusing sources, and antenna gains for this source were determined using a model consisting of both the calibrator and these weaker sources (cf. Gaensler, Manchester & Green 1998a).
3.1 Continuum data
At both 20 and 6 cm, a mosaic image of the field was formed using multi-frequency synthesis [Sault & Wieringa 1994] and uniform weighting. Data from the 6-km antenna were excluded. Each image was deconvolved using the maximum entropy algorithm [Gull & Daniell 1978], all pointings in the mosaic being handled simultaenously [Sault, Staveley-Smith & Brouw 1996]. The resulting models were smoothed using a Gaussian restoring beam, and then corrected for the mean primary response of the ATCA antennas and for the appropriate mosaic pattern. The resolution and noise in the final images are given in Table 2.
The pulsar-gated data were analysed by de-dispersing at a dispersion measure of 253.2 pc cm-3 [Kaspi et al. 1994]. On- and off-pulse datasets were formed, and the off-pulse data subtracted from the on-pulse data so that only pulsed emission remained.
Images of the region were also formed in Stokes , and . At 20 cm, Faraday rotation across the observing band is significant (4 radians across 128 MHz in some regions), and can cause depolarization of the emission. This effect was minimised by making multiple pairs of and images across the 20-cm band, each of bandwidth 8 MHz. At 6-cm bandwidth depolarization is minimal ( radians), and we made a single pair of and images for the entire frequency band.
Although mosaic images can be formed in polarization as described for total-intensity data above, , and data are not positive everywhere and thus cannot be deconvolved using maximum entropy techniques as used for Stokes . For our 20-cm data we thus deconvolved images of polarized emission using the “individual” approach (see Sault & Killeen 1998), whereby each pointing is deconvolved separately using the CLEAN algorithm [Clark 1980], and final images in , or are then formed by combining each CLEANed pointing. However the “individual” approach results in an image greatly lacking in extended structure when compared to “joint” deconvolution techniques [Cornwell 1988]. At 20 cm most of the emission is well sampled by the unmosaiced coverage, and this effect is minimal. However at 6 cm the image quality resulting from the individual approach is poor. Thus at 6 cm we formed dirty polarization images using the joint algorithm as in total intensity, but made no attempt to deconvolve them.
A linear polarization image was formed from each pair of and images and corrected for non-Gaussian noise statistics. At 20 cm, each image was clipped where the polarized emission or the total intensity was less than 5, and the final image formed by taking a mean across the observing band.
3.2 Spectral Index
Existing spectral index studies of G320.4–01.2 have had low spatial resolution and have produced a wide range of conflicting results (see du Plessis et al. 1995). But using our high-resolution 20- and 6-cm observations, we can accurately calculate the spatial distribution of (where ) for G320.4–01.2.
When computing spectral indices, it is crucial that the images being compared contain the same spatial scales. The coverage of our two datasets is quite different, and spatial filtering must be applied to each so that their spatial scales match. Assuming that the deconvolution process at each frequency accurately fills in the plane in some range , this filtering can be simply achieved by smoothing the higher resolution image to the resolution of the lower, and discarding extended structure in whichever image extends to shorter projected baselines. The spatial distribution of spectral index can then be determined using the method of “T–T” (temperature-temperature) plots [Turtle et al. 1962]. In this method, two images are plotted against each other on a pixel-by-pixel basis in some small sub-region of the image. Provided any DC offset is constant over this region, the data will follow a linear relationship , whose slope is related to the spectral index, , by
| (1) |
A linear fit to the data gives a value of and thus of .
We applied this method to our 20- and 6-cm data on G320.4–01.2 to produce a pair of images of resolution 24 arcsec. Because there are many pixels per beam area in each image, adjacent pixels are correlated, which will cause the uncertainty in the linear fit to a T–T plot to be underestimated [Green 1990]. To correct for this effect, each image was re-binned by choosing every th pixel, where there are pixels per beam in each dimension. T–T plots of vs were then produced in square regions of side 2 arcmin, and a linear least squares fit applied to each plot to determine , and hence .
3.3 Spectral line data
For the H i observations, continuum emission was subtracted from the line data in the plane [van Langevelde & Cotton 1990, Sault 1994], and spectra were then smoothed to a velocity resolution of 3.3 km s-1. Diffuse emission was removed by discarding spacings shorter than 1 k, and a line cube was then formed for velocities between –200 and +200 km s-1 (LSR). The peak emission in the resulting images was deemed sufficiently faint that deconvolution was not required.
The H i cube was then weighted by multiplying it by the 20-cm continuum image. H i spectra towards sources of interest were generated by integrating over the relevant region of the cube, and then renormalised to give units of fractional absorption.
The rms noise, , in each spectrum was determined from the flux in line-free channels. The presence of extended H i emission in the Galactic Plane raises the thermal noise in the H i line to approximately double this value (e.g. Dickey 1997), and so we choose 6 as the threshold above which features are considered believable.
Continuum emission was subtracted from OH and H140 data as for H i. Cubes were formed at various velocity resolutions and then searched for emission.
4 Results
4.1 Continuum Images
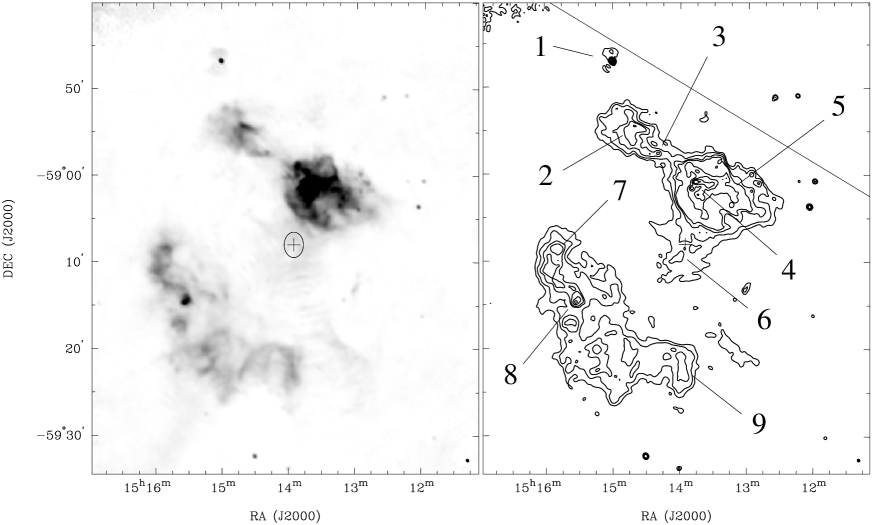
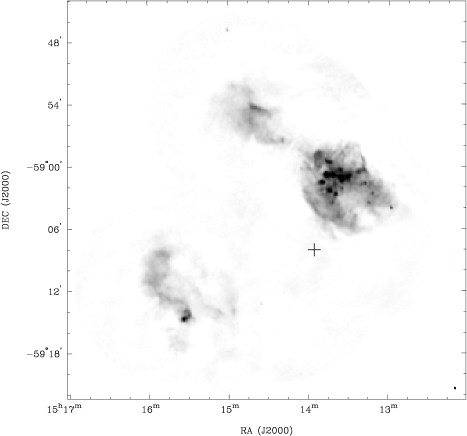
Total-intensity images of SNR G320.4–01.2 at 20 and 6 cm are shown in Figures 2 and 3 respectively. The brightest region is that coincident with RCW 89, and can be seen to form a ring of knots (region 4 in Figure 2) superimposed on a horseshoe-shaped plateau of emission (region 5). A bridge of emission running parallel to the Galactic Plane connects RCW 89 with another clump of emission, comprised of a compact source at its south-west end (region 3) and becoming more diffuse to the north-east (region 2). South-east of RCW 89 is a twisted, filamentary arc (incorporating regions 7 and 9), with one distinctly compact region near its northern end (region 8).
The 20-cm flux density of G320.4–01.2 and its associated uncertainty are given in Table 2, and were measured by integrating polygons around each component of the source then applying a background correction. The shortest antenna spacing at 20 cm is 31 m, corresponding to a spatial scale of 25 arcmin. However, the mosaic allows us to recover information on larger scales (Cornwell 1988; Sault et al. 1996), in this case up to 35 arcmin. If the SNR contains structure larger than this, these missing spacings will result in a significant underestimate in the true flux density. However, the 20-cm flux densities in Table 2 are in excellent agreement with single-dish observations at this frequency [Milne et al. 1969, Milne 1972]. Furthermore, there is no negative bowl observable around the SNR, as would be expected if large-scale structure were missing. Finally, our ATCA image, when smoothed to the appropriate resolution, is indistinguishable from a 20-cm image made with the Parkes 64-m radio telescope (A. R. Duncan 1996, private communication). All these points are good evidence that the 20 cm ATCA observations contain all the flux and structure from the SNR.
At 6 cm, we are sensitive only to scales smaller than 9 arcmin, even after mosaicing. Thus we expect the flux density determined in Table 2 (for the northern component only) to be an underestimate. Indeed if we take the flux density at 20 cm and scale it by a mean spectral index (Milne et al. 1993), we expect a 6-cm flux density for the northern region of 15 Jy, substantially greater than the value in Table 2. This missing flux is clearly evident in Figure 3, which, compared to Figure 2, lacks significant extended structure.
The position and 20-cm flux density of PSR B1509–58 are given in Table 2 and were determined by fitting in the plane to the pulsed dataset formed from the pulsar-gated data. This position is marked by a “+” symbol on appropriate Figures. The pulse-profile is similar to that obtained by Manchester et al. [Manchester, Tuohy & D’Amico 1982], consisting of a single main pulse occupying 15 per cent (FWHM) of the period. The pulsar was not detected in (ungated) 6-cm observations.
The position of the pulsar given in Table 2 is consistent, within the uncertainties, with that derived by Manchester et al. [Manchester, Durdin & Newton 1985] 14.4 yr earlier. This allows us to put 1- upper limits on the pulsar’s proper motion of 39 mas yr-1 in RA and 52 mas yr-1 in Dec. The corresponding 1- error ellipse for the distance travelled in 1700 yr is shown in Figure 2, limiting its birth-place to somewhere south of RCW 89 and well within the SNR.
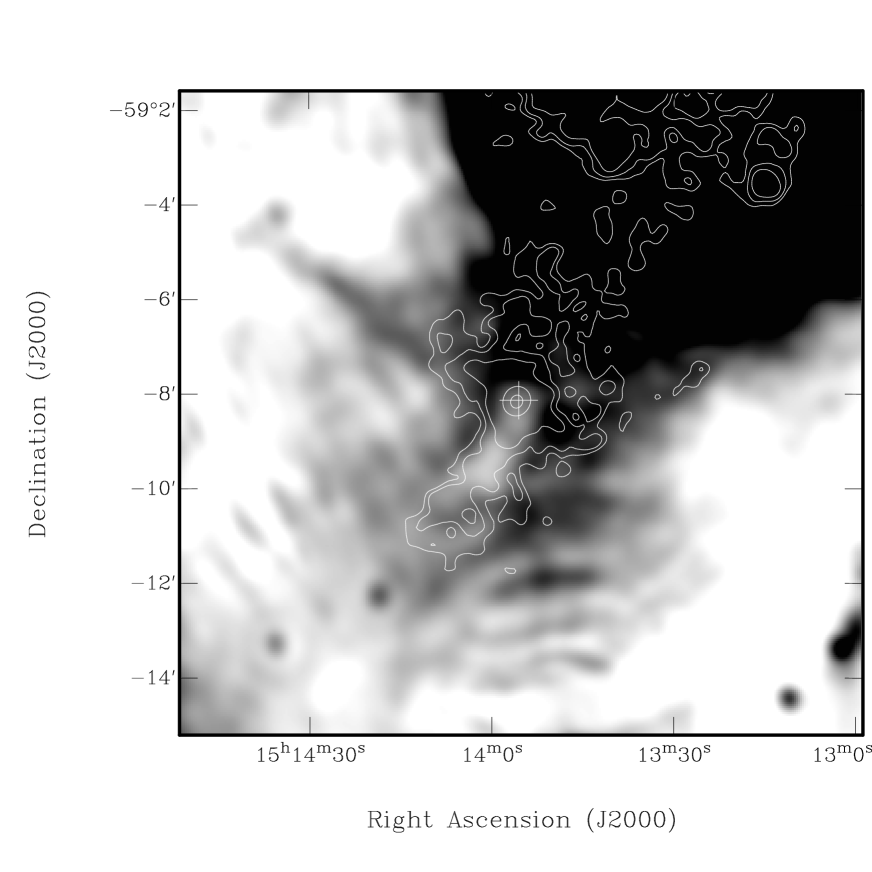
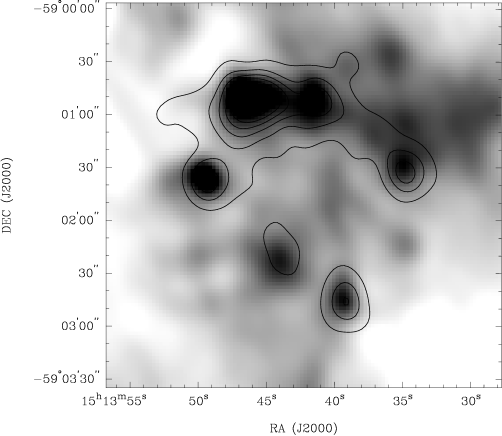
An image of the region surrounding the pulsar is given in Figure 4, where the grey-scale range has been chosen to show faint radio emission in the region. The pulsar is seen to lie within a tongue-like plateau of emission extending 6 arcmin south-east from RCW 89 (region 6 of Figure 2); a channel of depressed emission in this tongue can be seen surrounding and to the south-east of the pulsar. This tongue and the channel within it are clearly evident in MOST observations of the same region [Manchester & Durdin 1983, Whiteoak & Green 1996], but under conditions of lower resolution, poorer sensitivity and reduced dynamic range. It is also just visible in our 6-cm data, but is poorly imaged as a result of the lack of short spacings. X-ray emission in the region (as imaged by ROSAT PSPC) is shown as contours in Figure 4. A comparison between X-ray and radio data clearly shows that a narrow X-ray feature (part of the PWN powered by PSR B1509–58) runs along the channel of reduced radio emission.
| Wavelength (cm) | 20 | 6 | |
|---|---|---|---|
| Resolution | |||
| Largest angular scale | |||
| in image | |||
| Measured rms noise | 250 | (Stokes ) | 250 |
| (Jy beam-1)a | 75 | (Stokes ) | 100 |
| G320.4–01.2 : | |||
| Flux density (Jy)a | (north) | ||
| (south) | – | ||
| (total) | – | ||
| PSR B1509–58 : | |||
| Flux density (mJy)a | |||
| Position (J2000) | RA , | ||
| Dec | |||
| G320.6–00.9 (Source 1 in Figure 2) : | |||
| Flux density (Jy)a | |||
| Position (J2000) | RA , Dec | ||
a 1 jansky (Jy) W m-2 Hz-1
In Figure 5 we compare radio emission from the centre of the RCW 89 region with the ROSAT High Resolution Imager (HRI) data of Brazier & Becker [Brazier & Becker 1997]. The ring of knots seen at the radio peak of RCW 89 shows a marked correspondence with the X-ray emission.
To the north of the SNR is source 1, an unresolved core surrounded by a patchy plateau of emission of diameter 3 arcmin. This source was classified as a SNR candidate, G320.6–00.9, by Whiteoak & Green [Whiteoak & Green 1996]. Its position and 20- and 6-cm flux densities are given in Table 2. Its flux density at 6 cm is difficult to estimate, as the correction for the primary beam response is large. Furthermore, the extended component was not imaged by the 6-cm coverage, and thus the corresponding flux density pertains only to the core region.
4.2 Polarization
An image of linear polarization at 20 cm is shown in Figure 6, showing diffuse patchy polarization over the SNR, with noticeable peaks in regions 4, 6, 8 and 9. Polarized intensity at 6 cm (not shown) shows similar peaks but at higher resolution. In Table 3 we summarise the fractional polarization in different regions, showing a general increase at 6 cm compared with 20 cm.
| Region | Fractional polarization (per cent) | |
| 20 cm | 6 cm | |
| 1 | ||
| 2 | 17 | 40 |
| 3 | 5 | 25 |
| 4 | 10 | 18 |
| 5 | 5 | 20 |
| 6 | 60 | 120 |
| 7 | 13 | 28 |
| 8 | 7 | 30 |
| 9 | 32 | – |
ATCA continuum observations involve the recording of many adjacent frequency channels. These can be used to extract the Faraday rotation across the observing band, from which an accurate rotation measure (RM) can be derived (Gaensler et al. 1998a). RMs determined from Faraday rotation across the 20-cm band are generally low ( rad m-2) except in regions 2 and 6 and on the southern edge of region 4. The RM of the SNR at the position of B1509–58 is 21030 rad m-2, very similar to the value of rad m-2 for the pulsar (F. Crawford 1998, private communication). The pulsar is too weak to contaminate the value measured for the remnant.
The fractional bandwidth at 20 cm is insufficient to accurately determine intrinsic position angles (see Gaensler et al. 1998a), while as discussed in Section 3.1, the 6-cm image cannot be easily deconvolved. Thus we cannot derive intrinsic position angles of linear polarization from the SNR, and refer the reader to the lower resolution results of Milne et al. [Milne, Caswell & Haynes 1993]. In particular, we note that their results show that the magnetic field in the highly polarized region 6 is oriented along the axis defined by the collimated X-ray feature and the associated radio channel both seen in Figure 4
The clumpy nature of polarized emission at 20 cm, along with the significant variations in RM seen across the remnant, suggest that the low levels of seen at 20 cm can be explained by beam depolarization, in which the position angle of polarized emission varies across the sky on scales smaller than the beam. As expected, the fractional polarization is significantly higher at 6 cm, a result of both the increased resolution and the reduced Faraday rotation at shorter wavelengths. Since our RMs are derived using up to 13 independent data points across the 20-cm band, it is unlikely that there is any ambiguity in their determination. There is reasonable agreement between the RMs determined here and those derived by Milne et al. [Milne, Caswell & Haynes 1993] using only two data points, and thus one can have confidence in the intrinsic position angles and rotation measures which Milne et al. derive.
At 6 cm, radio emission near PSR B1509–58 (region 6) has the unphysical value of . This can be understood in terms of the spatial filtering applied by an interferometer to the sky distribution of emission. In 6-cm total intensity, region 6 is poorly imaged by the ATCA because it is dominated by extended structure to which the telescope is not sensitive. But in polarization, variations in position angle (either intrinsic to the source or resulting from differential Faraday rotation) shift power in the polarized images into smaller-scale structure to which the interferometer is sensitive. Polarized emission thus appears to be of greater surface brightness than the total intensity (see Wieringa et al. 1993). Although the fractional polarization of region 6 is also high at 20 cm, it does not suffer from this effect as the observations are sensitive to all relevant spatial scales (see Section 4.1). The high fractional polarization at 20 cm thus shows that there is minimal beam depolarization in this region, indicating a well-ordered magnetic field.
No linear polarization is detected from G320.6–00.9 (source 1 in Figure 2). In circular polarization, the 20-cm image shows emission only from PSR B1509–58, while the 6-cm image contains no discernible sources.
4.3 Spectral Index
Appropriate spatial filtering of the 20- and 6-cm data results in a pair of images both of which contain emission on scales between 24 arcsec (the resolution at 20 cm) and 520 arcsec (corresponding to the shortest spacings at 6 cm), and have no structure outside this range. T–T plots were produced for the various regions of G320.4–01.2 marked in Figure 2. Several plots were produced for each region by shifting the box in which data were considered by a few pixels each time. In all cases adjacent boxes produced consistent results.
The results of the T–T fitting are shown in Table 4. No value of could be calculated for source 1 using this method, both because of the small number of pixels available for the fit and because of the large uncertainties in the primary beam correction near the edge of the field; simply using the total flux density at 20 and 6 cm we estimate . Region 6 was only barely imaged at 6 cm because of lack of short spacings in the array; we attempted to calculate a spectral index for it using our 20 cm data together with the 36 cm image of Whiteoak & Green [Whiteoak & Green 1996], but its low surface brightness and the nearness of the two wavelengths prevents us from constraining its spectrum any more tightly than . Region 9 was outside the region of the 6-cm mosaic, and we roughly estimate .
| Region | |
|---|---|
| 1 | (see text) |
| 2 | |
| 3 | |
| 4 | |
| 5 | |
| 6 | (see text) |
| 7 | |
| 8 | |
| 9 | (see text) |
We expect the flux density scale of the ATCA images to to be accurate to 3 per cent. While uncertainties in absolute flux calibration will always limit the accuracy with which itself can be calculated, this effect biases the spectral index of all regions by the same amount, and thus does not affect our ability to comment on spatial variations in . Errors caused by applying a single primary beam correction on images formed from a large fractional bandwidth (as is the case at both 20 and 6 cm) can bias towards the edges of the field, but the effect is negligible () compared to the uncertainties quoted.
Thus results from Table 4 indicate that the spectrum of region 4 is 2–3 steeper than that of regions 2 and 5, and 3–4 steeper than the spectra of regions 7 and 8.
4.4 H i line
One usually compares absorption spectra with emission spectra from an adjacent patch of the sky. However, a useful emission spectrum is difficult to extract from our ATCA data because of insufficient coverage on the large spatial scales where emission dominates. We thus compare our results to the emission spectrum in this direction obtained by Caswell et al. [Caswell et al. 1975]. This spectrum shows significant emission at LSR velocities of –70 km s-1, –55 km s-1, from –15 to +30 km s-1, then at +80 km s-1.
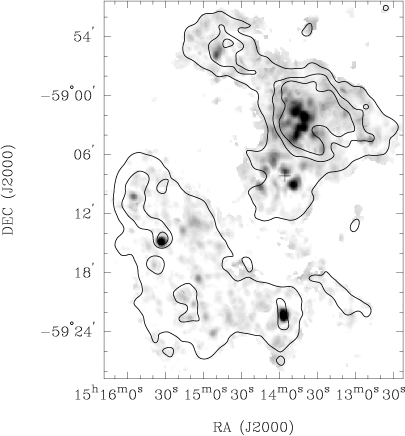
Of unrelated sources near G320.4–01.2, only G320.6–00.9 (source 1 in Figure 2) has enough signal-to-noise ratio to obtain a useful absorption spectrum. This spectrum is shown in Figure 7, where significant absorption is seen at –75 and –55 km s-1 and between –10 and +20 km s-1, with a lower level feature at +65 km s-1. We thus put a lower limit on the systemic velocity of G320.6–00.9 of km s-1. We use the best fitting model for Galactic rotation of Fich, Blitz & Stark [Fich, Blitz & Stark 1989], adopt standard IAU parameters [Kerr & Lynden-Bell 1986] for the solar orbital velocity ( km s-1) and distance to the Galactic Centre ( kpc), and assume an uncertainty of km s-1 in systemic velocities, representative of the random motion of H i clouds [Shaver et al. 1982, Belfort & Crovisier 1984]. We can thus derive a lower limit on the distance to G320.6–00.9 of kpc.
Thus G320.6–00.9 is at a large distance, is unpolarized, and has a comparatively steep spectral index, and its core is unresolved at our highest resolution (2 arcsec using the 6-km antenna at 6 cm). It therefore seems likely that this source is not a SNR as proposed by Whiteoak & Green [Whiteoak & Green 1996], but rather is a background radio galaxy. The nature of its extended envelope is unclear.
In Figure 7 we also show H i spectra towards three parts of G320.4–01.2. Regions 2 and 4, both in the northern part of the SNR, show the same main features in absorption: strong absorption at –55 km s-1 and then at –15 km s-1 (region 2) or –5 km s-1 (region 4). Other spectra towards the northern part of the SNR are similar, all showing absorption out to –55 km s-1. Region 8, in the south of the SNR, shows significant absorption only at –25 km s-1 and –5 km s-1. A feature at –60 km s-1 is at the limit of significance. The signal-to-noise of absorption towards other parts of the SNR was too low to make any useful measurements.

4.5 OH and H140
Neither OH nor H140 emission was detected towards G320.4–01.2. The 3- upper limit on the surface brightness of OH is 23 mJy beam-1 at 4 km s-1 resolution, consistent with the survey results of Green et al. [Green et al. 1997] but at a slightly more stringent limit. Limits for H140 are 6 mJy beam-1 (15 km s-1 resolution) and 4.5 mJy beam-1 (40 km s-1 resolution). At the peak of the radio emission from RCW 89, the H140 non-detection corresponds to an upper limit on the line-to-continuum ratio of 4 per cent.
5 Discussion
5.1 How many SNRs?
Although there are several distinct components to the radio emission from G320.4–01.2, each part can be matched up to part of the X-ray emission in the region.
-
1.
Based on the correspondence shown in Figure 5, the north-western radio region (which appears to be a single object based on the similarity of H i spectra for regions 2 and 4) can be associated with the X-ray region “NN”.
-
2.
The morphological correspondence seen in Figure 4 between radio region 6 and the X-ray region “SN” argues a connection between them.
-
3.
Figure 1 demonstrates a match between the “T” region in X-rays and regions 7 and 8 in the radio.
Trussoni et al. [Trussoni et al. 1996] have shown that the spectra of and absortion towards these X-ray regions are consistent with their all being part of a single SNR. Since each of the main radio regions corresponds to part of this X-ray remnant, we therefore argue that the entire G320.4–01.2 region in radio and X-rays is a single SNR.
5.2 A distance to G320.4–01.2
Absorption spectra for regions 2 and 4 of the SNR are consistent with that of Caswell et al. [Caswell et al. 1975]: absorption is seen at –55 km s-1 but not at more negative velocities. We thus adopt km s-1, corresponding to a lower limit on the distance of kpc. An upper limit is the tangent point at km s-1 [Caswell et al. 1975, Kerr et al. 1986], which is at a kinematic distance kpc. Region 8’s spectrum can only be considered consistent with those of regions 2 and 4 if absorption at –60 km s-1 is genuine. However, region 8 is several arcmin away from the other sources, and the distribution of H i clouds along the line of sight may be quite different. Indeed, values for the hydrogen column density towards the SNR inferred from photoelectric absorption indicate significant gradients across the SNR [Trussoni et al. 1996]. Thus the H i spectra can all be considered consistent with a distance for SNR G320.4–01.2 of kpc. This agrees with the distance derived by Caswell et al. [Caswell et al. 1975], but has more realistic uncertainties. In further discussion we adopt a distance to the SNR of kpc.
5.3 Radio emission near PSR B1509–58
Region 6 has the same RM as the pulsar (quite different from that of RCW 89), has a distinctly higher fractional polarization than RCW 89, and shows a morphological correspondence with X-ray emission associated with the pulsar nebula. Thus there is good evidence that region 6 is directly associated with PSR B1509–58, as originally suggested by Manchester & Durdin [Manchester & Durdin 1983]. Despite this claim, we would argue that this region of radio emission is not a radio PWN in the traditional sense, since the radio emission is not centred on the pulsar, nor are the X-ray-bright regions bright in the radio. Indeed any radio PWN is expected to be faint: comparison with the Crab Nebula gives an expected flux density at 20 cm of 100 mJy [Srinivasan, Bhattacharya & Dwarakanath 1984], while extrapolation from the X-ray spectrum of the “SN” region implies a flux density 1 mJy [Seward et al. 1984]. If we assume that this radio PWN is of the same extent as the X-ray PWN (although in fact we expect the radio source to be larger because of the longer synchrotron lifetimes), we expect a 20-cm mean surface brightness at 1-arcmin resolution of 0.02–2 mJy beam-1, completely undetectable against the background in this region of 20 mJy beam-1.
The morphology of the X-ray PWN, together with the appearance of the surrounding SNR, have led several authors to propose that the pulsar’s wind is focused into relativistic jets or outflows, generated along an axis aligned approximately north-west/south-east [Seward et al. 1983, Manchester & Durdin 1983, Tamura et al. 1996, Brazier & Becker 1997]. There are collimated X-ray features along this axis on both sides of the pulsar. In the south-east, Figure 4 shows that radio emission is enhanced along the sides of the collimated X-ray feature, but not within it. We argue that this anti-correspondence can be explained if the X-ray feature is indeed a jet or outflow along the previously proposed axis; radio emission is then produced by shocks generated in a cylindrical sheath around the jet, as seen for SS 433 (Hjellming & Johnston 1986, 1988) and possibly for the X-ray jet in Vela X [Frail et al. 1997]. A jet interpretation is also favoured by the polarization properties of the sheath: the magnetic field in the region is well-ordered and oriented parallel to the axis of the proposed outflow (Section 4.2 above; Milne et al. 1993), similar to the field structure seen surrounding the jets associated with both the Crab [Hester et al. 1995] and Vela [Markwardt & Ögelman 1995, Milne 1995] pulsars.
We assume the radio sheath to be a hollow cylinder, the inner and outer diameters of which correspond to the diameters of the X-ray jet and radio sheath respectively. From ROSAT PSPC and HRI data we estimate the inner diameter of the sheath to be 60–75 arcsec, while from 20-cm ATCA data we determine an outer diameter of 210 arcsec. We assume that the jet is inclined to the line of sight at 70° [Brazier & Becker 1997] and that the radio emission in the sheath is optically thin. We then expect the radio emission along lines of sight through the X-ray jet to be 0.7 as bright as the radio emission along the edges of the jet, consistent with the observed value of 0.5–0.8. The sheath is too faint for us to put any useful constraint on its spectral index, but we expect it to have , indicative of shock acceleration [Frail et al. 1997].
The abrupt fading of the sheath to the south-east is difficult to explain, but appears to coincide with a similar termination in X-rays seen in Figure 4. Clearly, conditions within or surrounding the jet change in some way beyond this point.
The cross-shaped morphology of the X-ray PWN and its resemblance to the Crab Nebula [Hester et al. 1995, Brazier & Becker 1997] both argue for the presence of a second jet to the north-west of the pulsar. This jet appears to be less collimated than the south-eastern jet and has no obvious radio depression associated with it. While there is no clear explanation for this difference, we note that conditions on the north and south sides of the pulsar may be quite different (see Section 5.7 below), and that asymmetries are also observed in the outflows associated with the Crab and Vela pulsars [Pelling et al. 1987, Markwardt & Ögelman 1995].
5.4 The knots in RCW 89
The north-western jet which we have just discussed appears to map onto the ring of X-ray/radio knots seen in Figure 5 [Brazier & Becker 1997]. Thus rather than argue that the entire RCW 89 region is powered by the pulsar outflow [Manchester & Durdin 1983, Tamura et al. 1996], we now consider the alternative that the interaction region is confined just to the ring of knots.
The radio knots within RCW 89 are significantly linearly polarized, show no recombination lines and have the steepest spectral index of any emission from the SNR. Thus there seems little doubt that the emission mechanism associated with the radio features is synchrotron radiation. Taking the brightest knot to be a sphere of radius 15 arcsec and flux density 0.2 Jy at 20 cm, we can use standard minimum energy arguments [Pacholczyk 1970] to infer a magnetic field for it of G, where is the filling factor of emitting particles and fields and is the ratio of energy in heavy particles to that in electrons. This is not significantly different from the field strengths of 7 G and 2.5 G inferred for the overall X-ray PWN [Seward et al. 1984] and for the X-ray jet [Tamura et al. 1996] respectively. The corresponding total energy of this knot in magnetic fields and relativistic particles is erg, a tiny fraction of the total spin-down energy released by the pulsar in its life-time ( erg). The steep spectrum of the knots is the opposite to what we might expect if injection of particles from the pulsar was directly contributing to their emission (cf. Frail et al. 1994b). Rather, it seems that the collision between the jet and pre-existing material drives shocks into the latter at the working surface, producing clumps of enhanced synchrotron emission.
X-ray observations of RCW 89 as a whole show it to be thermal [Seward et al. 1984, Tamura et al. 1996], but the X-ray/radio correspondence seen in Figure 5 suggests that X-ray emission from the knots might be synchrotron emission as in the radio. A single power law of spectral index (from Table 4) can indeed be extrapolated between the radio flux of the knots as observed here and the X-ray count rates quoted by Brazier & Becker [Brazier & Becker 1997]. No spectral break as might be caused by synchtrotron losses is required, which implies a magnetic field strength G consistent with the determination from minimum energy above. While RCW 89 is predominantly thermal in X-rays, the available spectral data lack the spatial resolution to determine whether the thermal spectrum of the region corresponds to the knots as well as the more extended component in which they are embedded. Comparison of the count-rate for the entire RCW 89 region [Trussoni et al. 1996] with those of the knots alone [Brazier & Becker 1997] shows that soft X-ray emission is dominated by the extended component, and thus at low energies a power-law spectrum associated with the knots might be hidden. Indeed observations in hard X-rays [Tamura et al. 1996] show non-thermal emission at their position. However, the spatial resolution of these data is not sufficient to separate the knots from more diffuse emission in the area; high-resolution observations with AXAF will be required to clarify the issue. Whether thermal or non-thermal, the energy in the knots is far smaller than that in the whole RCW 89 region, and so can be comfortably accounted for by the pulsar spin-down.
The horseshoe-shaped plateau in RCW 89 appears to have a similar shape to the ring it envelopes, and may represent material diffusing away from the point(s) of impact. However, the size of this region is then somewhat large: from the ring to the edge of this plateau region is 2.5 arcmin, which requires emission to have travelled outwards from the ring at a projected mean velocity of km s-1. One possibility suggested by Tamura et al. [Tamura et al. 1996] is that the pulsar jet has precessed or narrowed in opening angle.
To summarise, the problems raised at the end of Section 1.2 can be resolved if just the X-ray/radio knots, rather than the whole of RCW 89, are interpreted as the point of interaction between the pulsar outflow and the SNR. The energy in these knots can be easily accomodated by the pulsar spin-down, and it is easier to understand how these features, rather than the whole extended nebula, might be the termination of an energetic outflow. A more likely possibility to account for the surrounding RCW 89 region is that it originates from the SNR blast wave, and is not related to any outflow from the pulsar.
5.5 The south-eastern component of the SNR
It can be seen in Figure 6 that regions 8 and 9 of the SNR contain compact polarized clumps, resembling the knots seen in RCW 89. These features may be evidence for an interaction between the south-eastern jet and the south-eastern half of the SNR, although, compared to that with the RCW 89 region, the impact is greatly reduced. In Figure 8 we show an extension of the model proposed by Brazier & Becker [Brazier & Becker 1997], where we speculatively project an additional cone of emission onto the south-eastern part of the SNR.111This projection is qualitatively similar to that of Manchester & Durdin [Manchester & Durdin 1983] and Manchester [Manchester 1987], but maps onto a smaller region of each half of the SNR. It is interesting to note that this second cone happens to intersect the SNR at the location of these two highly polarized clumps. It can be seen in Figure 1 that while the X-ray emission joining the “SN” and “T” regions might make up one edge of this cone, the other edge is missing. However, the latter region lies right along a rib of the PSPC and so may have had minimal exposure.

5.6 Spectral index variations
Results presented in Section 4.3 indicate that the compact knots at the peak of RCW 89 have a steeper radio spectrum than the diffuse emission surrounding them, which are again steeper than the south-eastern part of the SNR. While the phenomenon of spatial spectral index variations in SNRs is not well understood, there is the suggestion that young remnants generally show a steeper spectrum in their brightest, most compact components [Anderson & Rudnick 1993], as observed here. For example, in G260.4–03.4 (Puppis A) the steepest spectrum part of the shell is where it has been apparently decelerated by a collision with a dense cloud [Dubner et al. 1991], while in G111.7–02.1 (Cassiopeia A), the steep spectrum regions tend to be bow-shocks driven by clumps of fast-moving material [Anderson et al. 1991]. We note that both these effects may be occurring in G320.4–01.2: significant deceleration of the RCW 89 region is argued for in Section 5.7 below, while the pulsar outflow may accelerate small clumps of material to high velocity, which then drive bow-shocks as in Cas A.
5.7 Finale: what is SNR G320.4–01.2?
The distance to the SNR of 4.2 kpc as derived by Caswell et al. [Caswell et al. 1975] was used in the calibration of the electron distribution model of Taylor & Cordes [Taylor & Cordes 1993]. Thus comparisons between the pulsar’s distance as derived from this model and any distance estimate to the SNR are not entirely meaningful. Rather, we estimate the pulsar’s distance as follows.
While PSR B1509–58 itself is too weak to show H i absorption, PSRs B1240–64, B1323–58, B1323–62, B1356–60 and B1557–50 are all within 20° of PSR B1509–58, have comparable dispersion measures and have independent distance estimates from H i absorption [Frail & Weisberg 1990, Saravanan et al. 1996]. Distances and dispersion measures for these pulsars suggest a mean electron density along this line of sight of between 0.03 and 0.06 cm-3, corresponding to a distance for PSR B1509–58 in the range 4.2 to 8.4 kpc.
This distance for the pulsar is consistent with the distance we have determined for SNR G320.4–01.2 through H i absorption, resolving any previous discrepancy. Furthermore, despite the large variation in RM across the SNR (–200 to +400 rad m-2), its RM at the position of the pulsar agrees with that of the pulsar itself. Finally, we discussed in Section 5.4 that the pulsar appears to be interacting with the surrounding SNR. Thus we argue strongly that PSR B1509–58 and SNR G320.4–01.2 are associated. The age discrepancy outlined in Section 1.2 must then be resolved.
A first possibility to account for this apparent age difference is that B1509–58 has had an unusual spin-down history, and is much older than it seems [Blandford & Romani 1988]. However, all observations suggest that B1509–58 is a typical young pulsar, but that G320.4–01.2 is an anything-but-typical remnant. Although the possibility that B1509–58 is old cannot be ruled out, disagreement between a relatively well-determined pulsar age and a crudely estimated SNR age gives little cause to look to the pulsar as the culprit. Thus in future discussion we assume that the age of the system is 1700 yr. We now attempt to account for this age in terms of the properties of the supernova and its environment.
We take the south-eastern component of the SNR (incorporating regions 7, 8 and 9) as that part most representative of a “normal” shell SNR. Assuming the site of the supernova explosion to be within the 1- error-box derived from the pulsar’s proper motion, we estimate the radius of the south-eastern component of the SNR to be arcmin. For an SNR age of 1700 yr, this implies a mean expansion velocity of km s-1. If this component represents freely expanding material, we find a kinetic energy for the explosion of , where is the ejected mass in units of M☉ and is in units of erg. Alternatively, if we assume expansion in the adiabatic (Sedov-Taylor) phase then the size of the SNR implies , where is the ambient density into which this component of the SNR is expanding. To fully enter this phase the SNR must sweep up 20 times its own mass [Fabian, Brinkmann & Stewart 1983, Dohm-Palmer & Jones 1996], implying a density cm-3 to give .
Thus regardless of the evolutionary state of the SNR, an age of 1700 yr implies a value of which is 10–100 times higher than typical values [Berkhuijsen 1988, Smith 1988]. This problem has been overcome in the past by invoking a large () kinetic energy for the supernova [Seward et al. 1983, Katz 1983]. While such a value for seems uncomfortably high, it is comparable with (model-dependent) estimates for the energy released in the recent Type Ic supernova SN 1998bw [Iwamoto et al. 1998, Woosley, Eastman & Schmidt 1998]. However, we propose the more likely explanation that the progenitor of PSR B1509–58 was a helium star. Such a star explodes in a Type Ib supernova, ejecting a low amount of mass () but with a typical supernova energy () [Woosley, Langer & Weaver 1995], as required here. While the optical filaments in RCW 89 show no evidence of helium rich ejecta [Dopita, Mathewson & Ford 1977, Seward et al. 1983], we show below that this component of the SNR is considerably evolved and is now dominated by swept-up material. Spectroscopy of any optical emission which can be associated with the south-eastern component of G320.4–01.2 would be of great interest.
Helium stars start off as extremely massive stars, but lose their hydrogen envelopes either through a strong stellar wind or through transer of mass to a binary companion (Woosley, Langer & Weaver 1993, 1995). The latter possibility is interesting, particularly as the O star Muzzio 10 [Muzzio 1979, Seward et al. 1983] is just 18 arcsec north of the pulsar, and is at a comparable distance (5 kpc; Arendt 1991). We thus speculate that Muzzio 10 is the former companion of PSR B1509–58. This possibility is easily tested: assuming a pulsar age of 1700 yr, the association predicts a proper motion for the pulsar of 11 mas yr-1 along a position angle 168° (N through E), corresponding to a transverse velocity 260 km s-1.
It is clear from the radio data that there is no radio emission which can trace an entire shell and thus join the two components of the SNR. Gaensler [Gaensler 1998] has argued that the “bilateral” or “barrel” morphology which results (and the observed alignment of the bilateral axis with the Galactic Plane) is produced when a SNR expands into an elongated low-density cavity, radio emission being produced where the shock has recently encountered the walls. Thus a bilateral appearance can be considered evidence that is low ( cm-3); such a value for can also account for the faintness of the radio PWN [Bhattacharya 1990], and is consistent with the cavities expected due to the presence of other massive stars in the region (Lortet et al. 1987). For , this ambient density corresponds to the south-eastern component beginning to enter the adiabatic phase.
Limits on the pulsar proper motion as indicated in Figure 2 demonstrate that the SNR is distributed highly asymmetrically about the site of the explosion. Intuitively, this suggests that the supernova explosion was near the edge of the proposed cavity, and that, while the south-eastern half of the SNR has expanded relatively unimpeded, the north-western half has decelerated significantly. A high-density environment for this component is also argued for by its high X-ray and radio brightness and by the small proper motion of associated optical filaments [Seward et al. 1983, Manchester 1992].
Gull [Gull 1973] has modelled the deceleration of a young SNR, and provides means of scaling his solution to arbitrary values of density and . We take the radius of the north-western component to be arcmin, and adopt as argued for above. Scaling to Figure 3 of Gull [Gull 1973], we find that the north-western component of the SNR is well into the adiabatic phase, and that the ambient density in this region is in the range cm-3. This is consistent with the non-detection of OH, as the 1720 MHz maser line will be shock-excited into emission only at much higher densities [Elitzur 1976].
To summarise, we find that a number of observed properties of the SNR, particularly its bilateral appearance, faint radio PWN, asymmetric distribution about the pulsar and large size (and possibly also the slow optical expansion of filaments in RCW 89) can all be explained in a model in which an explosion of high energy or low mass occurred near the edge of a cavity elongated parallel to the Galactic Plane. The density of the cavity is cm-3: the south-eastern component of the SNR has expanded rapidly across the cavity and has recently collided with the other side, while to the north-west, the shock has encountered denser (1–5 cm-3) material, causing the SNR to decelerate significantly. To the north-east and south-west the shock is still propagating through the cavity and produces no observable emission.
While at low resolution G320.6–01.6 appears to be an extension of G320.4–01.2 (Milne et al. 1993), it is impossibly large to have expanded to its current size in 1700 yr. Its morphology and surface brightness are in complete contrast to those of G320.4–01.2, and we conclude that it is an unrelated older SNR along the same line of sight.
6 Conclusion
We have reported on an extensive set of ATCA observations of G320.4–01.2 and PSR B1509–58. The main results of this study are as follows.
-
1.
The disparate radio components of G320.4–01.2 are all part of a single SNR at a distance of kpc and with an age of 1700 yr.
-
2.
PSR B1509–58 is physically associated with G320.4–01.2. The pulsar emits twin jets or collimated outflows of relativistic particles, one of which interacts with the SNR in the form of radio/X-ray knots within RCW 89.
-
3.
SNR G320.4–01.2 was formed in a supernova of high kinetic energy or low ejected mass () which occurred near the edge of a low-density cavity.
A variety of further observations can support or refute these conclusions. For example, the cavity we propose may be visible in H i emission, while forthcoming AXAF observations will allow a detailed study of the physical conditions within the knots.
While we have offered answers to the questions outlined in Section 1, the picture is far from complete. First, we lack an understanding of the physical details of how the pulsar outflow is generating the peculiar knots in RCW 89, and of how the pulsar is interacting with the south-eastern half of the SNR. Similar interactions through outflows or jets have been proposed for a variety of other SNRs [Roger et al. 1985, Manchester 1987, Gaensler, Green & Manchester 1998b], although an associated pulsar is yet to be detected in most cases. We have also sidestepped the whole issue of why PSR B1509–58 generates such large-scale jets and how general this situation might be. Certainly the theoretical expectation has been for some time that pulsars should generate collimated outflows [Benford 1984, Michel 1985, Sulkanen & Lovelace 1990]. The Crab, Vela, PSR B1509–58 and possibly PSR B1951+32 (Hester 1998; J. J. Hester et al. in preparation) all show evidence that this is indeed the case, while various jet-like features have been proposed around other pulsars [Bell 1997]. We must now therefore accept that spherically symmetric pulsar winds are a gross over-simplification.
Acknowledgments
We thank Douglas Bock for carrying out the OH observations, Roy Duncan for obtaining Parkes data on this source and Warwick Wilson for assistance with pulsar-gating. We also appreciate useful discussions with Douglas Bock, John Dickey, Richard Dodson, Neil Killeen, Snežana Stanimirović and Ben Stappers. Chris Greiveldinger and Silvano Massaglia provided X-ray images of the region, while Froney Crawford communicated the rotation measure of PSR B1509–58 prior to publication. BMG acknowledges the support of an Australian Postgraduate Award. The Australia Telescope is funded by the Commonwealth of Australia for operation as a National Facility managed by CSIRO. This research has made use of NASA’s Astrophysics Data System Abstract Service and of the SIMBAD database, operated at CDS, Strasbourg, France.
References
- [Anderson & Rudnick 1993] Anderson M. C., Rudnick L., 1993, ApJ, 408, 514
- [Anderson et al. 1991] Anderson M., Rudnick L., Leppik P., Perley R., Braun R., 1991, ApJ, 373, 146
- [Arendt 1991] Arendt R. G., 1991, AJ, 101, 2160
- [Belfort & Crovisier 1984] Belfort P., Crovisier J., 1984, AA, 136, 368
- [Bell 1997] Bell J. F., 1997, Vistas Astron., 41, 87
- [Benford 1984] Benford G., 1984, ApJ, 282, 154
- [Berkhuijsen 1988] Berkhuijsen E. M., 1988, AA, 192, 299
- [Bhattacharya 1990] Bhattacharya D., 1990, JA&A, 11, 125
- [Blandford & Romani 1988] Blandford R. D., Romani R. W., 1988, MNRAS, 234, 57P
- [Braun, Goss & Lyne 1989] Braun R., Goss W. M., Lyne A. G., 1989, ApJ, 340, 355
- [Brazier & Becker 1997] Brazier K. T. S., Becker W., 1997, MNRAS, 284, 335
- [Caswell, Milne & Wellington 1981] Caswell J. L., Milne D. K., Wellington K. J., 1981, MNRAS, 195, 89
- [Caswell et al. 1975] Caswell J. L., Murray J. D., Roger R. S., Cole D. J., Cooke D. J., 1975, AA, 45, 239
- [Clark 1980] Clark B. G., 1980, AA, 89, 377
- [Cornwell 1988] Cornwell T. J., 1988, AA, 202, 316
- [Day, Thomas & Goss 1969] Day G. A., Thomas B. M., Goss W. M., 1969, Aust. J. Phys. Astr. Supp., 11, 11
- [Dickey 1997] Dickey J. M., 1997, ApJ, 488, 258
- [Dohm-Palmer & Jones 1996] Dohm-Palmer R. C., Jones T. W., 1996, ApJ, 471, 279
- [Dopita, Mathewson & Ford 1977] Dopita M. A., Mathewson D. S., Ford V. L., 1977, ApJ, 214, 179
- [du Plessis et al. 1995] du Plessis I., de Jager O. C., Buchner S., Nel H. I., North A. R., Raubenheimer B. C., van der Walt D. J., 1995, ApJ, 453, 746
- [Dubner et al. 1991] Dubner G. M., Braun R., Winkler P. F., Goss W. M., 1991, AJ, 101, 1466
- [Elitzur 1976] Elitzur M., 1976, ApJ, 203, 124
- [Fabian, Brinkmann & Stewart 1983] Fabian A. C., Brinkmann W., Stewart G. C., 1983, in Danziger J., Gorenstein P., eds, Supernova Remnants and Their X-Ray Emission (IAU Symposium 101). Reidel, Dordrecht, p. 119
- [Fich, Blitz & Stark 1989] Fich M., Blitz L., Stark A. A., 1989, ApJ, 342, 272
- [Frail & Weisberg 1990] Frail D. A., Weisberg J. M., 1990, AJ, 100, 743
- [Frail, Kassim & Weiler 1994] Frail D. A., Kassim N. E., Weiler K. W., 1994, AJ, 107, 1120
- [Frail et al. 1997] Frail D. A., Bietenholz M. F., Markwardt C. B., Ögelman H., 1997, ApJ, 475, 224
- [Frater, Brooks & Whiteoak 1992] Frater R. H., Brooks J. W., Whiteoak J. B., 1992, J. Electr. Electron. Eng. Aust., 12, 103
- [Gaensler 1998] Gaensler B. M., 1998, ApJ, 493, 781
- [Gaensler & Johnston 1995a] Gaensler B. M., Johnston S., 1995a, Publ. Astron. Soc. Aust., 12, 76
- [Gaensler & Johnston 1995b] Gaensler B. M., Johnston S., 1995b, MNRAS, 277, 1243
- [Gaensler, Manchester & Green 1998a] Gaensler B. M., Manchester R. N., Green A. J., 1998a, MNRAS, 296, 813
- [Gaensler, Green & Manchester 1998b] Gaensler B. M., Green A. J., Manchester R. N., 1998b, MNRAS, 299, 812
- [Green 1990] Green D. A., 1990, AJ, 100, 1927
- [Green et al. 1997] Green A. J., Frail D. A., Goss W. M., Otrupcek R., 1997, AJ, 114, 2058
- [Greiveldinger et al. 1995] Greiveldinger C., Caucino S., Massaglia S., Ögelman H., Trussoni E., 1995, ApJ, 454, 855
- [Gull & Daniell 1978] Gull S. F., Daniell G. J., 1978, Nat, 272, 686
- [Gull 1973] Gull S. F., 1973, MNRAS, 161, 47
- [Hester 1998] Hester J. J., 1998, in Shibazaki N., Kawai N., Shibata S., Kifune T., eds, Neutron Stars and Pulsars: Thirty Years after the Discovery. Universal Academy Press, Tokyo, p. 431
- [Hester et al. 1995] Hester J. J. et al., 1995, ApJ, 448, 240
- [Hill 1968] Hill E. R., 1968, Aust. J. Phys., 21, 735
- [Hjellming & Johnston 1986] Hjellming R. M., Johnston K. J., 1986, in Mason K. O., Watson M. G., White N. E., eds, The Physics of Accretion onto Compact Objects. Springer-Verlag, Berlin, p. 287
- [Hjellming & Johnston 1988] Hjellming R. M., Johnston K. J., 1988, ApJ, 328, 600
- [Iwamoto et al. 1998] Iwamoto K. et al., 1998, Nat, in press (astro-ph/9806382)
- [Kafatos et al. 1980] Kafatos M., Sofia S., Bruhweiler F., Gull S., 1980, ApJ, 242, 294
- [Kaspi 1996] Kaspi V. M., 1996, in Johnston S., Walker M. A., Bailes M., eds, Pulsars: Problems and Progress (IAU Colloquium 160). Astronomical Society of the Pacific, San Francisco, p. 375
- [Kaspi et al. 1994] Kaspi V. M., Manchester R. N., Siegman B., Johnston S., Lyne A. G., 1994, ApJ, 422, L83
- [Katz 1983] Katz J. I., 1983, AA, 128, L1
- [Kerr & Lynden-Bell 1986] Kerr F. J., Lynden-Bell D., 1986, MNRAS, 221, 1023
- [Kerr et al. 1986] Kerr F. J., Bowers P. F., Jackson P. D., Kerr M., 1986, A&AS, 66, 373
- [Kesteven 1968] Kesteven M. J. L., 1968, Aust. J. Phys., 21, 369
- [Komesaroff 1966] Komesaroff M. M., 1966, Aust. J. Phys., 19, 75
- [Lortet, Georgelin & Georgelin 1987] Lortet M. C., Georgelin Y. P., Georgelin Y. M., 1987, AA, 180, 65
- [Manchester & Durdin 1983] Manchester R. N., Durdin J. M., 1983, in Danziger J., Gorenstein P., eds, Supernova Remnants and Their X-Ray Emission (IAU Symposium 101). Reidel, Dordrecht, p. 421
- [Manchester 1987] Manchester R. N., 1987, AA, 171, 205
- [Manchester 1992] Manchester R. N., 1992, Nat, 356, 660
- [Manchester, Durdin & Newton 1985] Manchester R. N., Durdin J. M., Newton L. M., 1985, Nat, 313, 374
- [Manchester, Tuohy & D’Amico 1982] Manchester R. N., Tuohy I. R., D’Amico N., 1982, ApJ, 262, L31
- [Markwardt & Ögelman 1995] Markwardt C. B., Ögelman H., 1995, Nat, 375, 40
- [Marsden et al. 1997] Marsden D. et al., 1997, ApJ, 491, L39
- [Michel 1985] Michel F. C., 1985, ApJ, 288, 138
- [Mills, Slee & Hill 1960] Mills B. Y., Slee O. B., Hill E. R., 1960, Aust. J. Phys., 13, 676
- [Milne & Dickel 1975] Milne D. K., Dickel J. R., 1975, Aust. J. Phys., 28, 209
- [Milne 1970] Milne D. K., 1970, Aust. J. Phys., 23, 425
- [Milne 1972] Milne D. K., 1972, Aust. J. Phys., 25, 307
- [Milne 1995] Milne D. K., 1995, MNRAS, 277, 1435
- [Milne, Caswell & Haynes 1993] Milne D. K., Caswell J. L., Haynes R. F., 1993, MNRAS, 264, 853
- [Milne et al. 1969] Milne D. K., Wilson T. L., Gardner F. F., Mezger P. G., 1969, Astrophys. Lett., 4, 121
- [Muzzio 1979] Muzzio J. C., 1979, AJ, 84, 639
- [Pacholczyk 1970] Pacholczyk A. G., 1970, Radio Astrophysics. Freeman, San Francisco
- [Pelling et al. 1987] Pelling R. M., Paciesas W. S., Peterson L. E., Makishima K., Oda M., Ogawara Y., Miyamoto S., 1987, ApJ, 319, 416
- [Reynolds 1994] Reynolds J. E., 1994, ATNF Technical Document Series, 39.3040
- [Rodgers, Campbell & Whiteoak 1960] Rodgers A. W., Campbell C. T., Whiteoak J. B., 1960, MNRAS, 121, 103
- [Roger et al. 1985] Roger R. S., Milne D. K., Kesteven M. J., Haynes R. F., Wellington K. J., 1985, Nat, 316, 44
- [Saravanan et al. 1996] Saravanan T. P., Deshpande A. A., Wilson W., Davies E., McCulloch P. M., McConnell D., 1996, MNRAS, 280, 1027
- [Sault & Killeen 1998] Sault R. J., Killeen N. E. B., 1998, The MIRIAD User’s Guide. Australia Telescope National Facility, Sydney, (http://www.atnf.csiro.au/computing/software/miriad/)
- [Sault & Wieringa 1994] Sault R. J., Wieringa M. H., 1994, A&AS, 108, 585
- [Sault 1994] Sault R. J., 1994, A&AS, 108, 55
- [Sault, Staveley-Smith & Brouw 1996] Sault R. J., Staveley-Smith L., Brouw W. N., 1996, A&AS, 120, 375
- [Sault, Teuben & Wright 1995] Sault R. J., Teuben P. J., Wright M. C. H., 1995, in Shaw R., Payne H., Hayes J., eds, Astronomical Data Analysis Software and Systems IV. ASP Conference Series, Volume 77, San Francisco, p. 433
- [Seward & Harnden Jr. 1982] Seward F. D., Harnden Jr. F. R., 1982, ApJ, 256, L45
- [Seward et al. 1983] Seward F. D., Harnden Jr. F. R., Murdin P., Clark D. H., 1983, ApJ, 267, 698
- [Seward et al. 1984] Seward F. D., Harnden Jr. F. R., Szymkowiak A., Swank J., 1984, ApJ, 281, 650
- [Shaver & Goss 1970a] Shaver P. A., Goss W. M., 1970a, Aust. J. Phys. Astr. Supp., 14, 133
- [Shaver & Goss 1970b] Shaver P. A., Goss W. M., 1970b, Aust. J. Phys. Astr. Supp., 14, 77
- [Shaver et al. 1982] Shaver P. A., Radhakrishnan V., Anantharamaiah K. R., Retallack D. S., Wamsteker W., Danks A. C., 1982, AA, 106, 105
- [Smith 1988] Smith A., 1988, in Roger R. S., Landecker T. L., eds, Supernova Remnants and the Interstellar Medium (IAU Colloquium 101). Cambridge University Press, Cambridge, p. 119
- [Srinivasan, Bhattacharya & Dwarakanath 1984] Srinivasan G., Bhattacharya D., Dwarakanath K. S., 1984, JA&A, 5, 403
- [Sulkanen & Lovelace 1990] Sulkanen M. E., Lovelace R. V. E., 1990, ApJ, 350, 732
- [Tamura et al. 1996] Tamura K., Kawai N., Yoshida A., Brinkmann W., 1996, Proc. Astr. Soc. Jap., 48, L33
- [Taylor & Cordes 1993] Taylor J. H., Cordes J. M., 1993, ApJ, 411, 674
- [Trussoni et al. 1996] Trussoni E., Massaglia S., Caucino S., Brinkmann W., Aschenbach B., 1996, AA, 306, 581
- [Turtle et al. 1962] Turtle A. J., Pugh J. F., Kenderdine S., Pauliny-Toth I. I. K., 1962, MNRAS, 124, 297
- [Ulmer et al. 1993] Ulmer M. P. et al., 1993, ApJ, 417, 738
- [van den Bergh & Kamper 1984] van den Bergh S., Kamper K. W., 1984, ApJ, 280, L51
- [van Langevelde & Cotton 1990] van Langevelde H. J., Cotton W. D., 1990, AA, 239, L5
- [Whiteoak & Green 1996] Whiteoak J. B. Z., Green A. J., 1996, A&AS, 118, 329, (http://www.physics.usyd.edu.au/astrop/wg96cat)
- [Wieringa et al. 1993] Wieringa M. H., de Bruyn A. G., Jansen D., Brouw W. N., Katgert P., 1993, AA, 268, 215
- [Wilson et al. 1992] Wilson R. B., Finger M. H., Fishman G. J., Meegan C. A., Paciesas W. S., 1992. IAU Circ. No. 5429
- [Woosley, Eastman & Schmidt 1998] Woosley S. E., Eastman R. G., Schmidt B. P., 1998, ApJ, submitted (astro-ph/9806299)
- [Woosley, Langer & Weaver 1993] Woosley S. E., Langer N., Weaver T. A., 1993, ApJ, 411, 823
- [Woosley, Langer & Weaver 1995] Woosley S. E., Langer N., Weaver T. A., 1995, ApJ, 448, 315