Infrared spectroscopy of young supernova remnants heavily interacting with the interstellar medium ††thanks: Based on observations with ISO, an ESA project with instruments funded by ESA Member States (especially the PI countries: France, Germany, the Netherlands and the United Kingdom) and with the participation of ISAS and NASA.
Abstract
ISO spectral observations of the supernova remnant RCW103 are presented. This object is the prototype of relatively young remnants ( yr) with fast shocks ( km/s) interacting with dense interstellar medium.
The spectrum is dominated by prominent lines of [NeII], [SiII], [FeII] and other low excitation species which provide, for the first time, a simple and reliable estimate of the gas abundances of refractory (Si, Fe, Ni) and non–refractory (Ne, P, S, Cl, Ar) species. Apart from nickel, all the derived abundances are close to solar, confirming that the shock has destroyed all dust grains. Like the optical nickel lines, [NiII]6.64 m yields Ni abundances a factor 10 solar which we propose results from a large underestimation of the computed Ni+ collision strengths.
The observed intensities and velocity widths of ionic lines are compatible with emission from the post–shock region alone with only a very small (if any) contribution from the photoionized precursor. This result does not agree with shock models which predict that the precursor should emit powerful line emission, especially from highly ionized species. The possible consequence of this on the modelling of Seyfert spectra is briefly discussed.
Key Words.:
Atomic data; ISM: abundances; ISM: supernova remnants; Galaxies: Seyfert; Infrared: ISM: lines and bands1 Introduction
Radiative supernova remnants are the ideal astrophysical laboratory for studying the emission spectrum of relatively fast shocks interacting with the interstellar medium (e.g. Draine & McKee drainemckee (1993)). In the standard, idealized, view the supernova blast wave expands through a uniform, low density (1 cm-3) medium and the shock remains adiabatic, i.e. the postshock gas has insufficient time to cool/recombine, for yr and up until the shock has slowed to km/s. After this the shock becomes radiative with the postshock region recombining and radiating away most of the shock mechanical energy in the form of UV, optical and IR lines whose surface brightness simply scale with the shock energy flux , being the pre–shock density. In practice, a ‘standard’ radiative supernova remnant is expected to emit weak lines, i.e. erg cm-2 s-1 sr-1 (cf. Sect 3.2 of Dopita & Sutherland 1996, hereafter DS (96)) and 2–3 orders of magnitude weaker than those observed in bright supernovae remnants such as RCW103 (Oliva et al. 1989, hereafter OMD (89)). This simple fact indicates, therefore, that the shock of RCW103 is much faster or, equivalently, that the SNR is much younger than the canonical values. This is also confirmed by X–ray spectra which yield an age of only yr and a main shock velocity of about 1200 km/s (Nugent et al. nugent (1984)).


Thus, the prominent line emission from the optical filaments of RCW103 results from the impact of the km/s SNR blast wave onto dense clouds of ISM material (probably molecular clouds). Due to the higher density, the postshock gas cools and recombines much faster than in the canonical model and the SNR becomes radiative at much earlier times. The large surface brightness of the emitted line spectrum simply reflects the large mechanical energy flux of the shock.
Studying the IR spectrum of radiative shocks can give interesting information on the metal abundances and, by comparing refractory and non–refractory species, can yield a direct measurement of the actual efficiency of grain destruction by the shock. Moreover, the spectra can be used to verify the predictions of models of fast shocks, which have been recently published by DS (96).
Being the brightest and best studied SNR, RCW103 was chosen as the prototype object for ISO template spectra of gas excited by fast shocks. The observations are described in Sect. 2 and the derived physical parameters are discussed in Sect. 3. The results are compared with shock model predictions in Sect. 4 where we draw particular attention to the relative roles of the photoionized precursor and post–shock region in producing the observed lines.
2 Observations and results
2.1 ISO spectroscopy
| Line | Flux(1) | Aλ(2) | Slit(3) | Aper. corr.(4) |
|---|---|---|---|---|
| SiVII]2.483 | 1.2 | 0.38 | 14 20 | 1.0 |
| SiIX]3.936 | 0.5 | 0.17 | 14 20 | 1.0 |
| Br 4.051 | 7 (1) | 0.16 | 14 20 | 1.0 |
| FeII]5.340 | 57 (17) | 0.10 | 14 20 | 1.0 |
| NiII]6.635 | 6 (1.5) | 0.07 | 14 20 | 1.0 |
| ArII]6.985 | 62 (12) | 0.06 | 14 20 | 1.0 |
| NiIII]7.349 | 3 | 0.06 | 14 20 | 1.0 |
| Pf 7.458 | 3 | 0.06 | 14 20 | 1.0 |
| NeVI]7.655 | 1.6 (.3) | 0.06 | 14 20 | 1.0 |
| ArIII]8.990 | 7 (1) | 0.04 | 14 20 | 1.0 |
| SIV]10.51 | 2 (.5) | 0.5b | 14 20 | 1.0 |
| NeII]12.81 | 120 (10) | – | 14 27 | .85 |
| NeV]14.32 | 1.3 (.3) | – | 14 27 | .85 |
| ClII]14.36 | 1.7 (.4) | – | 14 27 | .85 |
| NeIII]15.56 | 107 (10) | – | 14 27 | .85 |
| FeII]17.93 | 51 (6) | – | 14 27 | .85 |
| SIII]18.71 | 35 (4) | – | 14 27 | .85 |
| FeIII]22.92 | 8 (1) | – | 14 27 | .85 |
| FeI]24.04 | 1 | – | 14 27 | .85 |
| NeV]24.32 | 1.9 (.3) | – | 14 27 | .85 |
| FeII]24.51 | 13 (3)a | – | 14 27 | .85 |
| SI]25.24 | 1 | – | 14 27 | .85 |
| OIV]25.88 | 27 (3) | – | 14 27 | .85 |
| FeII]25.98 | 90 (10) | – | 14 27 | .85 |
| PII]32.8 | 2 (.6) | – | 20 33 | .58 |
| FeIII]33.0 | 2 (.6) | – | 20 33 | .58 |
| SIII]33.47 | 57 (6) | – | 20 33 | .58 |
| SiII]34.8 | 280 (40) | – | 20 33 | .58 |
| FeII]35.34 | 36 (4) | – | 20 33 | .58 |
| FeII]35.77 | 3 (.8) | – | 20 33 | .58 |
| NeIII]36.01 | 15 (3) | – | 20 33 | .58 |
| OIII]51.7 | 190 (30) | – | 80 | – |
| NIII]57.3 | 57 (14) | – | 80 | – |
| OI]63.2c | 710 (80)c | – | 80 | – |
| Unidentified 74.2d | 22 (7) | – | 80 | – |
| OIII]88.2 | 220 (30) | – | 80 | – |
| NII]121c | 75 (13)c | – | 80 | – |
| OI]145c | 33 (7)c | – | 80 | – |
| CII]157c | 630 (70)c | – | 80 | – |
(1) Observed line flux, units of W cm-2, errors are given in parenthesis
(2) Extinction (mag) extrapolated from AH=0.75 (OMD (90)) using A up to 9 m. Reddening is assumed to be negligible beyond 12 m
(3) Size (in arcsec) of the SWS ( m) and LWS ( m) apertures
(4) Correction factor to account for different apertures, based on the IRSPEC map of [FeII]1.644 (see caption of Fig. 7).
a Only SWS01 measurement available
b Adopting a “standard” A(silicate feature)/A ratio
c Line flux is probably contamined by back/foreground galactic emission
d Unidentified feature also seen in NGC7027 (Liu et al. liu (1996))
Complete SWS01 (speed 4, 6700 sec total integration time) and LWS01 (4400 sec total integration time, no background spectrum subtracted) spectra centered at the peak of [FeII]1.644 m line emission (cf. Fig. 7) were obtained on February 6 and February 20, 1996. These were complemented by a quick PHT-S spectrum (448 sec, February 20) and deeper SWS02 observations at selected wavelengths (total 7000 sec, obtained on August 15, 1996 and February 17, 1997), always centered at the same position. The short wavelength section (2.5–5 m) of the PHT-S spectrum was strongly contaminated by detector memory effects (a very bright source was observed just before RCW103), the PHT-SS results are therefore unreliable and not presented here.
The SWS data were reduced using standard routines of the SWS interactive analysis system (IA) using calibration tables as of September 1997. Reduction relied mainly on the default pipeline steps, plus removal of signal spikes, elimination of the most noisy band 3 detectors, and flat–fielding. The LWS spectrum is based on the end–product of the automatic pipeline as of April 1997 (i.e. OLP 6). A post-processing was performed within the ISO Spectral Analysis Package (ISAP)111The ISO Spectral Analysis Package (ISAP) is a joint development by the LWS and SWS Instrument Teams and Data Centers. Contributing institutes are CESR, IAS, IPAC, MPE, RAL and SRON., Version 1.2, with special emphasis on removal of signal spikes and memory effects, averaging of the different scans, and flat-fielding of the 10 detectors.
The final rebinned spectra are displayed in Figs. 1 to 4 and the derived line fluxes are listed in Table 1 together with additional information. Note that most of the lines in the 2.4–40 m range were observed twice, i.e. in the complete SWS01 spectrum (Fig. 2) and in the deeper SWS02 line scans (Fig. 1). The derived fluxes were always within 30% and in most cases equal to much better than 20%. The errors quoted in Table 1 also include the differences between the two measurements. It should be noted that, to the best of our knowledge, the transitions of [ClII]14.36 and [PII]32.8 are newly detected astronomical lines. Of interest is also the marginal detection of an unidentified feature at 74.2 m whose position and flux are remarkably similar to those found in the spectrum of NGC7027 (Liu et al. liu (1996)).
The SWS spectrum (Figs. 1, 2) is characterized by prominent lines over a faint continuum (about 0.5 Jy at 10 m) while emission by cold dust is evident in the LWS spectrum (Fig. 3). The level of the 100 m continuum is similar to the background IRAS level reported by Arendt (arendt (1989)) and the continuum seen in the LWS spectrum is, therefore, probably dominated by back/foreground emission from the galaxy disk. The same applies to the PAH’s features visible in the PHT-S spectrum (Fig. 4) and to the [OI]63.2, [NII]121 and [CII]157 lines which are likely to be strongly contaminated by emission from the diffuse ISM.
Given the relatively large extinction towards RCW103, i.e. A or A (cf. Oliva et al. 1990, hereafter OMD (90)), the reddening corrections are not negligible for the lines at the shortest wavelengths. Therefore, in Table 1 we also list the extinctions values which were derived assuming a ‘typical’ reddening curve, i.e. outside of the silicate band. The largest and most uncertain correction is for [SIV]10.52 which lies within the silicate band and for which we have assumed A(10m)/AV0.1.
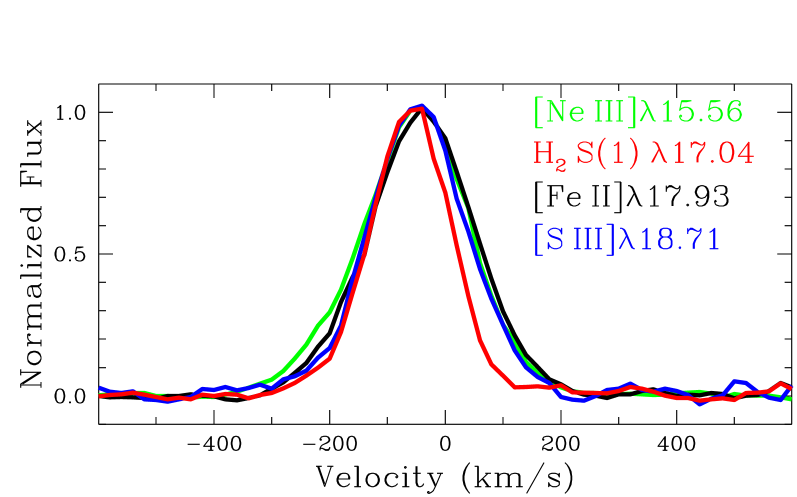
Useful dynamical information can be derived from the profiles of the lines between 15 and 19 m, the wavelength range where SWS02 grating spectra achieve their highest spectral resolution. The instrumental resolution depends on the size of the source along the dispersion direction and varies, for example, between 120 and 175 km/s for a compact and extended [SIII]18.7 source, respectively. Luckily, the SWS slit was almost exactly aligned N–S and was, therefore, roughly uniformly illuminated in the dispersion (E–W) direction (cf. Fig. 7). The observed line profiles are displayed in Fig. 6. The ionic lines are resolved and exhibit similar profiles, within the errors, but are broader than the H2 line which is unresolved. This agrees well with the higher spatial resolution velocity maps from the NIR data discussed below.
2.2 Ground based near infrared spectroscopy
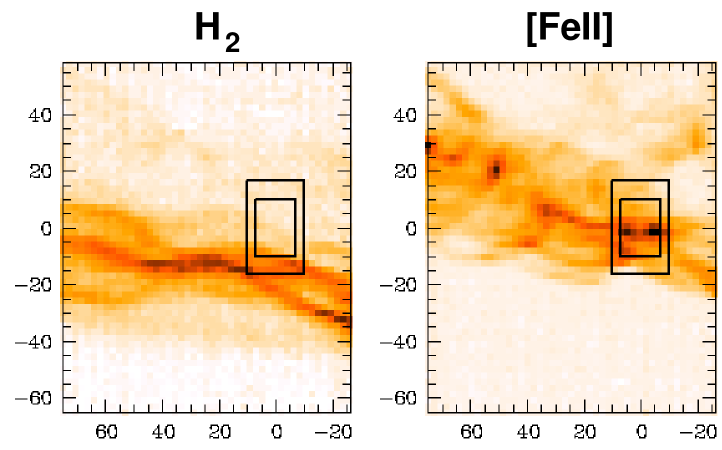
Near infrared observations were collected in Jan 1992 at the ESO–NTT using the long–slit spectrometer IRSPEC equipped with a 62x58 SBRC InSb array whose pixel size was 2.2″ along the slit and 5 Å along the dispersion direction. Line images of [FeII]1.644 and H2 2.121 were reconstructed from 57 spectra with the 100″ x 2.2″ slit aligned E-W and shifted by steps of 2.2″ along the N-S direction. Each long-slit spectrum consisted of a single on–chip integration of 30 sec with sky exposures every 10 spectra.


The integrated line images are displayed in Fig. 7 whose
caption also include results of [FeII] aperture photometry which has been
used to determine the
correction factors for the different beams used by SWS (see
also Table 1).
These assume that all ionized species have spatial distribution similar to
[FeII] which is justified by the following arguments.
– The flux of Br seen by ISO is within 10% of the value extrapolated
from the ground based measurement (OMD (90)) assuming
a constant [FeII]/Br ratio
over the region of interest.
– The morphology of the [FeII] filaments is
virtually identical to those seen in optical line images
(cf. e.g. Moorwood et al. moorwood87 (1987)).
It should be noted, however, that the H2 lines arise from a totally
different region 20″ south of the ionized gas and
outside the optical/radio/X–ray remnant,
as originally found by OMD (89). This indicates that H2 emission
traces material which has not yet been reached
by the shock, most probably a molecular cloud heated by the soft
X–rays from the shock front (cf. OMD (90)).
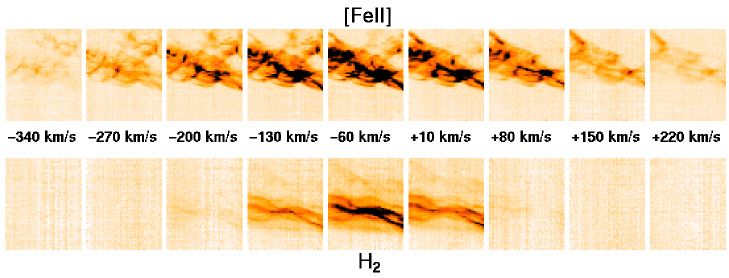
Fig. 5 shows images at various velocity bins, each roughly corresponding to the wavelength range covered by 1 pixel. Evident are the high velocity [FeII] filaments whose projected velocities extend up to 250 km/s and are compatible with the idea that this line is produced downstream of the fast shock (cf. the Introduction). The H2 filaments, on the contrary, do not show evidence of motions larger than the FWHM=130 km/s instrumental resolution.
3 Physical parameters of the emitting gas
3.1 Temperature and density
| Line ratio | Observed(1) | (2) | (2) |
|---|---|---|---|
| (cm-3) | (x K) | ||
| [OIII]51.7/88.2 | 30–250 | – | |
| [NeIII]15.6/36.0 | 5000 | – | |
| [NeIII]3869/15.6a | – | 8.3–10.5 | |
| [NeV]14.3/24.3 | 5000 | – | |
| [SIII]18.7/33.5 | 1200 | – | |
| [SIII]953118.7a | – | 7.1–13.8 | |
| [SII]6731/6716b | 800–2000 | – | |
| [FeII]35.3/26.0 | any | – | |
| [FeII]24.5/17.9 | any | – | |
| [FeII]17.9/5.34 | 400–1000 | – | |
| [FeII]17.9/26.0 | 80–320 | ||
| [FeII]26.0/1.64c | – | 5.2–8.7 | |
| [FeII]1.53/1.64d | 2500–4100 | – |
(2) Deduced gas density and temperature, see also Fig. 9
a From [NeIII]3869/H=0.41 (Leibowitz & Danziger leibowitz (1983)) and [SIII]9531/H=0.16 (Dennefeld dennefeld (1986)) adopting the case–B H/Br=13 ratio
b [SII] lines from Leibowitz & Danziger (leibowitz (1983))
c Flux of [FeII]1.644 from IRSPEC image (cf. caption of Fig. 7) corrected for extinction using AH=0.75
d Near infrared [FeII] lines from OMD (90)
The ISO spectra include several density and/or temperature sensitive line pairs. Besides the well known, –sensitive [OIII], [NeIII], [NeV] and [SIII] fine structure lines, useful transitions are those of [FeII] whose paths are displayed in Fig. 8, while their dependence on and is visualized in Fig. 9. Note that the ratios [FeII]35.3/26.0 and [FeII]24.5/17.9 are also density sensitive, but vary by only a factor 1.7 between the low and the high density limits so the resulting is highly uncertain.
The deduced values of and are summarized in Table 2 where the most remarkable result is the large spread of densities deduced from the various diagnostic ratios. The lowest value is from the [OIII] lines which are measured through the much larger LWS beam (cf. Table 1) and are probably affected by the emission of a diffuse, lower density component. Some of the discrepancies between the [FeII] densities could also reflect density and temperature stratification. In particular, the ground state line at 26.0 m could partially arise from excitation by collisions with atomic hydrogen in regions far downstream of the shock where the temperature is too low to produce the other [FeII] lines. However, such a cold component should primarily show up in the temperature sensitive [FeII]26.0/1.64 ratio which, on the contrary, yields a relatively high value for and therefore implies that any cold component can account, at most, for 30% of the observed flux of [FeII]26.0. An alternative explanation is that the different [FeII] densities simply reflect relatively small uncertainties in the atomic parameters of Fe+ which, for example, overestimate the critical density of [FeII]1.53 and of the other satellite lines in the near infrared.
It should be noted that much larger discrepancies between the [FeII]
densities from FIR and NIR line ratios were found from observations
of the Galactic center (GC, Lutz et al. galactic_center (1996))
where, however, all the [FeII] lines but one are reasonably well
explained by a collisionally excited plasma
with 8000 K and = cm-3. The only
line which does not fit is
17.9
which is a factor of 10
lower than predicted.
This cannot be easily explained neither by alternative
excitation mechanisms such as e.g. UV pumping (Lucy private communication)
nor by advocating large uncertainties on the collision strengths which
are ruled out by the results presented here.
A partial explanation to the “GC anomaly” could be to assume that the
foreground extinction at 17.9 m is a factor of 2–3 larger than that
predicted from the standard reddening curve.
The [NeIII], [NeV] and [SIII] ground state lines ratios are compatible, within the errors, with their low density limits, but useful estimates of temperature can be obtained including measurements of optical transitions from the same ions. The values listed in Table 2 are derived from the available fluxes of optical and FIR lines relative to H and Br, respectively, and assume a generous error of 0.2 dex to include e.g. possible uncertainties in the reddening correction of the optical data. The resulting temperatures are quite well constrained, nevertheless, and the values are compatible with those predicted for the post–shock region of shocks with velocities 300 km/s (cf. Tables 3A–3D of DS (96)). Note in particular that slower shocks are predicted to have a post–shock [NeIII] temperature of 15–30 K and significantly hotter than the observed value.
The temperature of [NeV] is of particular interest to verify if this ion is produced downstream of the shock, in which case NeV is predicted to be collisionally ionized in plasma at about K, or in the much cooler ( K) photoionized precursor. In the first case one expects [NeV]3426/14.3=8 or, equivalently, [NeV]3426/H=0.1, while values a factor of 6–7 lower are expected if the emission is from the precursor. Unfortunately, no observation of [NeV]3426 is available in the literature and, given the quite high extinction, measurements at the required depth (a few % of H) are not straightforward.
3.2 Abundances
| Lines used(1) | Abundance ratio(2) | Solar value |
|---|---|---|
| [FeIII]22.9/[FeII]26.0 | [Fe++/Fe+] = | – |
| [NeIII]15.6/[NeII]12.8 | [Ne++/Ne+] = | – |
| [ArIII]8.99/[ArII]6.98 | [Ar++/Ar+] = | – |
| [SIV]10.5/[SIII]18.7 | [S+3/S++] = : | – |
| [NIII]57.3/[OIII]51.7 | [N++/O++] = : | [N/O] = |
| [NeII]12.8/Br | [Ne+/H+] = : | [Ne/H] = |
| [SiII]34.8/[NeII]12.8 | [Si+/Ne+] = | [Si/Ne] = |
| [PII]32.8/[NeII]12.8 | [P+/Ne+] = : | [P/Ne] = |
| [SIII]18.7/[NeIII]15.6 | [S++/Ne++] = | [S/Ne] = |
| [ClII]14.4/[NeII]12.8 | [Cl+/Ne+] = | [Cl/Ne] = |
| [ArII]6.98/[NeII]12.8 | [Ar+/Ne+] = | [Ar/Ne] = |
| [FeII]17.9/[NeII]12.8 | [Fe+/Ne+] = | [Fe/Ne] = |
| [NiII]6.64/[NeII]12.8 | [Ni+/Ne+] = | [Ni/Ne] = |
(1) Fluxes from Table 1 including aperture and reddening corrections
(2) Logaritmic values, typical uncertainties are dex except for those marked with a column which are dex
A specific advantage of FIR lines is that their emissivities depend very little on the gas temperature and abundances derived from these lines are, therefore, little affected by uncertainties in the assumed value of . Also, to minimize the effect of density variations, we selected for each ion the line with the largest critical density which, for most species, was cm-3 and larger than the values of derived above. The derived abundances are listed in Table 3 where the quoted errors also include generous uncertainties on temperature (i.e. =5000–10000 K and =7000–15000 K for singly and double ionized species, respectively) and density ( cm-3).
The most remarkable result is that, apart for the anomaly of nickel which is discussed below, all the metal abundances are close to the solar values. This indicates that the emitting gas is indeed ISM material in which the dust grains have been destroyed by the shock front thus returning all the refractory species (Si, Fe) into the gas phase. It should also be noted that, to the best of our knowledge, the ISO data provide for the first time a measurement of the abundances of phosphorus and chlorine in any supernova remnant. Moreover, the abundance of silicon from the FIR [SiII] line is much less uncertain than those normally derived from UV lines whose intensities strongly depend on the assumed gas temperature (e.g. Russel & Dopita russel (1990)).
3.2.1 The nickel anomaly
The relatively large strength of the optical [NiII]7379 line
in SNRs and other nebulae
has long puzzled astronomers because it requires a Ni+/Fe+
abundance ratio a factor 10 larger than the cosmic value.
A similar overabundance, i.e. [Ni+/Fe+]= dex or
a factor of 7 above the solar [Ni/Fe]= value, is inferred here from
the [NiII]6.64 ground state transition
(cf. Table 3).
This result is very difficult to understand because the line emitting
gas is shock excited interstellar material which should not have,
therefore, an anomalous Ni abundance.
A number of explanations for the optical result have been
proposed (cf. Bautista et al. bautista (1996) for a recent review).
These include:
– Selective dust depletion of Fe relative to Ni, which cannot
hold in our case because most of the iron is in the gas phase.
– Low Fe+/Fe relative abundances, which can be excluded
because most of the iron is in the form of Fe+
(cf. Table 3).
– Contribution by UV fluorescence to the [NiII] lines, which could be
important
for the optical lines but has negligible effect on
the [NiII]6.64 ground state transition
(cf. Table 1 of Lucy lucy (1995)). Also, no obvious source of strong
UV radiation exists in RCW103 (cf. Sect. 4.1.3 of OMD (90)).
– Density stratification with low regions emitting [SII], higher
density gas emitting [FeII] and the densest (106 cm-3) regions
dominating [NiII] whose lines have the highest critical density
(Bautista et al. bautista (1996)).
However, such a high density component should also (but does not) show up in
other lines with high critical density, in particular [NeII]12.8
which has cm-3 and only a factor of 10
lower than the critical density of the [NiII]6.64 line. Since
the [NiII]/[NeII] ratio also requires a nickel overabundance of a factor of 6
(cf. Table 3), and considering also the relatively low
densities derived from the [FeII] lines (cf. Table 2),
one is forced to assume that most
of the nickel is in regions with densities cm-3 while
all the other species, including Fe, must be in regions with densities
cm-3, which is implausible.
We therefore conclude that the apparently large Ni+/Fe+ relative abundance simply reflects uncertainties in the collision strengths for [NiII] whose computed values are systematically a factor 10 lower than those of [FeII]. In particular, the collision strength of the [NiII]6.64 ground state line is only =0.15 and by far (i.e. a factor of 5) lower than the collision strengths of the main ground state transitions of any other astrophysical abundant species. Adopting, for example, =1.0 for the [NiII]6.64 transition would yield [Ni+/Ne+]= and [Ni+/Fe+]=, i.e. values within 0.1 dex of the solar Ni/Ne and Ni/Fe relative abundances.
4 Discussion
4.1 Comparison with shock models
Explicit predictions for a few FIR lines have been included in the models for relatively slow (150 km/s) shock interacting with low density material by Raymond (raymond (1979)) and Shull & McKee (shull_mckee (1979)). The first lists [NeII], [SiII] and [FeII] while the latter include [SiII], [SIII] and [SIV]. The predicted line ratios from the above mentioned models are not in good agreement with our results. In particular, the observed [SIV]/[SIII] ratio is a factor 5 larger than the computed values. Also, most models predict a factor of 3 too strong [SiII] (relative to [NeII], [FeII], [SIII]), but this could be attributed to uncertainties in the atomic parameters of SiII which have been updated several times since the publication of the shock model results. The most important discrepancy, however, is that the predicted surface brightnesses are always a factor 10 lower than the observed values, which simply reflects the fact that the shock of RCW103 is much faster than the values used in the above models (cf. the Introduction and below).
Models of slow shocks interacting with very dense gas
( cm-3) were developed by Hollenbach & McKee
(hollenbach89 (1989)) who also include explicit predictions for all
the FIR lines of singly ionized and neutral species. The main problem
with these models is that they span preshock densities much larger than
the 300 cm-3 required to account for the measured electron densities
in the post–shock region. Consequently, lines with low critical densities,
e.g. [SiII], are predicted too faint. Moreover, the models underestimate the
flux of [FeII] lines by a factor of 5.
The most recent models of DS (96), which cover shock velocities of 200–500 km/s and are more representative of the conditions of RCW103, do not however give explicit predictions for the FIR lines. Nevertheless, reasonably accurate line ratios can be computed from the values of ionic column densities and mean temperatures listed in the above paper. To a first approximation, the ratio of two lines from the post–shock region is
where and are the column densities and temperature of the emitting ions and is the line emission coefficient which, for FIR lines, is very little dependent on the gas temperature. The contribution from the photoionized precursor can be also computed from the published tables of and in the pre–shock region, while the compression factor (i.e. the ratio between the electron density in the post and pre shock regions) can be estimated imposing that the regions have similar H surface brightnesses (cf. Sect. 3.2 of DS (96)), i.e.

Out of the many FIR line ratios we have identified those which are
most sensitive to the shock speed and to the presence of the photoionized
precursor.
The behaviour of the selected line ratios
is plotted in Fig. 10 where the most remarkable
result is that models including the emission from the precursor
largely overpredict the strength of [SIV] and [NeV].
The velocity dependence of the [NeV]/[NeIII] ratio in
the post–shock region may appear at first sight surprising, but can be easily
understood as follows. The post–shock [NeV] emission always occurs
in collisionally ionized gas at K and whose
column density, which primarily depends on the shape of the gas
cooling curve, does not strongly vary with the shock speed.
The [NeIII] line, on the contrary, could be strongly enhanced by emission
from photoionized gas in the post–shock region, but this
only occurs at km/s while slower shocks do not produce
enough ionizing photons to support a large NeIII zone. In short,
the sharp decrease of [NeV]/[NeIII] between 200 and 300 km/s is
because the [NeIII] line emission rapidly increases in this velocity
interval.
The main conclusion of this analysis is that all ionic lines can be reasonably well reproduced by post–shock emission. This conclusion also agrees with the broad line profiles observed by SWS (Sect. 2.1) and imaging–spectroscopy observations of [OIII]5007 which show complex dynamical structures, similar to those seen in [FeII] (Fig. 5) and incompatible with emission from the precursor (Moorwood et al. moorwood87 (1987)). The only ionic line which cannot be accounted for by post–shock emission is [SIV] which should be a factor of 10 fainter, but can be reproduced adding a quite ‘incomplete precursor’, i.e. 5% the SIV column density of the precursor predicted by the DS (96) models (cf. Fig. 10).
Given the importance that the photoionized precursor may have in
modelling the spectra of active galaxy nuclei (Sect. 4.3),
it is of interest to investigate why little or no ionic
line emission is observed from the precursor of RCW103.
We envisage the following possibilities.
– The precursor in RCW103 is very thin to UV ionizing photons,
but this is very difficult
to reconcile with the fact that
H2 emission is observed from pre–shock molecular gas
lying outside of the shock front (cf. Fig. 7).
For H2 to exist, the molecules must be shielded from the
strong field of UV ionizing radiation from the shock front or,
equivalently, the preshock region must be optically thick.
– The shock front in RCW103 is significantly slower than so far
assumed and below 150 km/s, the minimum speed required to
produce a prominent phototoionized precursor.
This is in strict constrast with the observed line widths and filament
dynamics (cf. Sect. 2 and Fig. 5).
Moreover, slow shocks cannot explain the very large
surface brightness of the lines which require a large mechanical
power of the shock, i.e. a large product, being
the preshock density and the shock speed.
More specifically, the average surface brightness of Br within the ISO
beam corresponds to
= erg cm-2 s-1 sr-1
which, coupled to the predicted values from shock models
(Eq. 3.4 of DS (96)), yields
or, equivalently, a shock speed of about km/s
for a pre–shock
density of 300 cm-3. Larger pre–shock
densities are effectively excluded by the measured electron
densities (Table 2)
in the post–shock region, i.e. after the gas has been compressed
by the shock front.
The factor takes into account projection effects such as those
modelled in details by Hester (hester (1987)) who interpreted the bright
filaments in IC443 and Cygnus–Loop in therms of relatively slow shocks
seen quasi edge–on and found that small filaments
amplified by a factor 10–100 should be quite common. However,
this model cannot hold for RCW103 for the following reasons.
This remnant is much brighter (factor of 10) than IC443 and Cygnus–Loop.
The average surface brightness within the relatively large
ISO–SWS beam (i.e. the value used in Eq. 3) is already
a factor of 4 lower than that observed
on arcsec scales in optical/IR line images of RCW103.
The most largely amplified edge–on filaments should have small
radial velocities (FWHM40 km, cf. Fig. 2 of Hester hester (1987))
amd this is not compatible with the observed line widths and dynamics.
– The shock models largely overpredict the contribution of the
photoionized precursor. Indeed, DS (96) state that the column
density of ionized gas in the precursor might be overestimated
due to a possibly incorrect treatment of the transfer of the
UV ionizing photons (cf. end of Sect. 4.2 of DS (96)).
Moreover, the ionization structure of the
precursor could be much different than computed in DS (96) if the shock
evolves on time scales shorter than 100 yr, i.e.
the recombination time in the pre–shock gas.
| Line ratio | RCW103(1) | GC(2) | Circinus(3) |
|---|---|---|---|
| [FeIII]22.9/[FeII]26.0 | 0.089 | 3.7 | – |
| [NeIII]15.6/[NeII]12.8 | 0.89 | 0.044 | 0.46 |
| [NeV]14.3/[NeIII]15.6 | 0.012 | – | 1.0 |
| [NeIII]15.6/[FeII]26.0 | 3.1 | 1.2 | 5.4 |
| [OIV]25.9/[FeII]26.0 | 0.30 | 0.24 | 8.8 |
| [SiIX]3.94/[SiII]34.8 | 0.003 | – | 0.025 |
(1) Line fluxes from this paper
(2) Data from Lutz et al. (galactic_center (1996))
(3) Data from Moorwood et al. (moorwood96 (1996))
4.2 Comparison with the Galactic center
The region on the line of sight of the GC has a rich spectrum of prominent IR lines which are believed to arise from gas with an unusually large Fe gas phase abundance and which is primarily photoionized by quite hot stars (Lutz et al. galactic_center (1996)). Table 4 is a comparison between the most significant line ratios measured in RCW103 and in the GC.
The [FeIII]22.9/[FeII]26.0 ratio is much higher (a factor of 42) in the GC spectrum. This implies Fe++/Fe and a factor 10 larger than in RCW103, regardless of the assumed gas density in the GC. This simply reflects the fact that a region predominantly photoionized by stars, such as those near to the GC, contains only a relatively small fraction of partially ionized gas. The recombining region behind the SNR shock front, on the contrary, has a large zone of partially ionized gas, which is heated by photoionization from the shock front radiation, and where most of iron is forced into Fe+ by the very rapid charge exchange reactions with neutral hydrogen.
The [OIV]25.9/[FeII]26.0 ratio is the same in the two objects, within the errors. Given the difficulties to produce both FeII and OIV with photoionization from normal stars, it seems not unreasonable to conclude that both species are primarily produced by shock excited gas in the line of sight of the GC.
The [NeIII]15.6/[NeII]12.8 ratio is a factor of 20 lower in the GC than in RCW103 which indicates that fast shocks are more effective than late O stars in producing NeIII. Moreover, the [NeIII]15.6/[FeII]26.0 ratio is only a factor of 2.6 higher in the GC than in RCW103 and this indicates that a non negligible fraction of the [NeIII] emission from the GC could come from shock excited gas.
4.3 Photoionized precursor and shocks in active galaxy nuclei
According to the shock models of DS (96),
the precursor could be an important source of lines
from high ionization species (e.g. [OIII]5007), but its importance relative
to the post–shock region may strongly depend on the
column density of the pre–shock material.
In a paper specifically dedicated to study
the spectral signatures of shocks in active galaxies,
Dopita & Sutherland (dopita95 (1995)) consider the following
limiting cases:
– Shock only, in which the precursor is very thin and its emission is
effectively negligible relative to the post–shock region.
This can fairly well reproduce the line ratios observed in low excitation
AGNs (LINERS).
– Shock + precursor, where the pre–shock region
is opaque to the ionizing photons from the shock front.
Since the ionizing spectrum is quite hard and effectively similar
to a typical AGN spectrum, the ionization
structure of the precursor is similar to that of standard narrow
line regions photoionized by the AGN. Consequently, the emerging line spectrum
is similar to that of standard photoionization models and could explain,
therefore, the high excitation lines from e.g. type 2 Seyferts.
In view of this proposed scenario, it is interesting to compare the spectra of RCW103 with that of the Circinus galaxy, an archetype Seyfert 2 galaxy whose observed line ratios are listed in Table 4. The most striking difference is that the high excitation (coronal) lines are much stronger in Circinus with, in particular, [NeV]/[NeIII]=1 and roughly 2 orders of magnitude larger than in RCW103. Such a strong [NeV] could be in principle compatible with emission from the precursor of a km/s shock (cf. Fig. 10), while even higher velocities, i.e. 1000 km/s, could probably account for highest ionization coronal lines (e.g. [SiX]). The main problem is that these shocks should also emit prominent low excitation lines from their fast moving post–shock gas, but this is incompatible with the observed line profiles which are remarkably narrow (FWHM150 km/s, Oliva et al. oliva94 (1994)) and similar for all ionization species. Therefore, a shock dominated model for the Circinus galaxy seems very unlikely and, more generally, the role played by the photoionized precursor in Seyferts could be questioned on the basis of the following arguments.
If dominated by photoionization, the low excitation lines from the post–shock region (e.g. [SII]) should be broader than those from the photoionized precursor (e.g. [OIII]), but this is in strict contrast with the observations which show that [OIII] and higher excitation lines are usually broader than those of [SII] and lower excitation species.
The ISM medium of Seyfert galaxies is well known to be quite “porous”, especially within the ionization cones, and several arguments indicate that the line emitting clouds are probably density bounded (e.g. Binette et al. binette96 (1996)). The host galaxies of LINERS, on the contrary, are often very rich in both gas and dust, a spectacular example being NGC4945 (e.g. Moorwood et al. n4945 (1996)). It seems therefore curious that the shocks in Seyferts should primarily impact onto the relatively few large clouds (i.e. those with large enough column density to absorb all the ionizing photons from the shock) while, in LINERS, the shocks should selectively avoid the largest clouds and only hit regions with low column densities (i.e. those which cannot produce a bright precursor).
The absence of significant emission from the pre–shock region in RCW103 indicates that shock models may overestimate the importance of the precursor region.
5 Conclusions
We have presented IR spectroscopic observations of RCW103, a relatively young and fast (about yr and 1200 km/s, Nugent et al. nugent (1984)) supernova remnant whose prominent line emitting filaments result from the interaction of the fast SNR blast wave with ISM clouds. The secondary shocks driven into the higher density medium have velocities 300 km/s, as indicated by the observed dynamics of the filaments (cf. Fig.5), by the very high surface brightness of the lines and by velocity sensitive line ratios such as [NeV]/[NeIII] (Sect. 4.1).
The spectrum is dominated by prominent lines from low excitation species which have been used to estimate the density, temperature and abundances of the emitting region. The results indicate this is post–shock gas with relatively low density ( cm-3), normal ISM abundance and essentially free of dust. Although the [NiII] lines seem to require a large nickel overabundance we argue, however, that this simply reflects uncertainties in the atomic parameters and propose that the collision strength for [NiII]6.64 is =1 and a factor of 7 larger than the computed value. Smaller uncertainties in some of the atomic parameters for [FeII] are also suggested by the data which nevertheless exclude large errors in the computed collision strengths.
An important discrepancy with fast shock models is that the prominent high excitation lines predicted from the photoionized precursor are not seen in RCW103. Since low column densities in the pre–shock region are ruled out by the observed H2 emission from the shock precursor, this discrepancy probably indicates that shock models largely overestimate the strength of the lines from the precursor. This may cause problems to shock models of Seyfert galaxies where the high excitation lines should be dominated by emission from the photoionized pre–shock region.
Acknowledgements.
E. Oliva acknowledges the partial support of the Italian Space Agency (ASI) through the grant ARS–98–116/22. We thank Henrik Spoon for help with the ISOPHOT-S data. SWS and the ISO Spectrometer Data Center at MPE are supported by DLR (formerly DARA) under grants 50–QI–8610–8 and 50–QI–9402–3.References
- (1) Arendt R.G., 1989, ApJS 70, 1
- (2) Bautista M.A., Peng J., Pradhan A.K., 1996, ApJ 460, 372
- (3) Binette L., Wilson A. S., Storchi-Bergmann T., 1996, A&A 312, 365
- (4) Leibowitz E.M., Danziger I.J., 1983, MNRAS 204, 273
- (5) Dennefeld M., 1986, A&A 157, 267
- (6) Dopita M.A., Sutherland R.S., 1995, ApJ 455, 468
- DS (96) Dopita M.A., Sutherland R.S., 1996, ApJS 102, 161 (DS96)
- (8) Draine B.T., McKee C.F., 1993, ARA&A 31, 373
- (9) Hester J.J., 1987, ApJ 314, 187
- (10) Hollenbach D., McKee C.F., 1989, ApJ 342, 306
- (11) Liu X.W. et al., 1996, A&A 315, L257
- (12) Lucy L.B., 1995, A&A 294, 555
- (13) Lutz D. et al., 1996, A&A 315, L269
- (14) Moorwood A.F.M., Danziger I.J., Oliva E., 1987, The Messenger 48, 49
- (15) Moorwood A.F.M., van der Werf P.P., Kotilainen J.K., Marconi A., Oliva E., 1996 A&A 308, L1
- (16) Moorwood A.F.M., Lutz D., Oliva E., Marconi A., Netzer H., Genzel R., Sturm E., de Graauw T., 1996, A&A 315, L109
- (17) Nugent J.J., Pravdo S.H., Garmire G.P., Becker R.H., Tuohy I.R., Winkler P.F, 1984, ApJ 284, 612
- (18) Nussbaumer H., Storey P.J., 1988, A&A 193, 333
- OMD (89) Oliva E., Moorwood A.F.M., Danziger I.J., 1989, A&A 214, 307 (OMD89)
- OMD (90) Oliva E., Moorwood A.F.M., Danziger I.J., 1989, A&A 240, 453 (OMD90)
- (21) Oliva E., Salvati M., Moorwood A.F.M., Marconi A., 1994, A&A 288, 457
- (22) Pradhan A.K., Zhang H.L., 1993, ApJL 409, L77
- (23) Quinet P., Le Dourneuf M., Zeippen C.J., 1996, A&AS 120, 361
- (24) Raymond J.C., 1979, ApJS 39, 1
- (25) Russel S.C., Dopita M.A., 1990, ApJS 74, 93
- (26) Shull J.M., McKee C.F., 1979, ApJ 227, 131