Abstract
What can we learn from the somewhat arduous study of old stellar populations in nearby galaxies? Unless the nearby universe is subtly anomalous, it should contain a relatively normal selection of galaxies whose histories are representative of field galaxies in general throughout the Universe. We can therefore take advantage of our ability to resolve local galaxies into individual stars to directly, and accurately, measure star formation histories. The star formation histories are determined from numerical models, based on stellar evolution tracks, of colour-magnitude diagrams. The most accurate information on star formation rates extending back to the earliest epoches can be obtained from the structure of the main sequence. However, the oldest main sequence turnoffs are very faint, and it is often necessary to use the brighter, more evolved, populations to infer the star formation history at older times. A complete star formation history can be compared with the spectroscopic properties of galaxies seen over a large range of lookback times in redshift surveys. There is considerable evidence that the faint blue galaxies seen in large numbers in cosmological surveys are the progenitors of the late-type irregular galaxies seen in copious numbers in the Local Group, and beyond. We consider how the “Madau-diagram”, the star formation history of the Universe, would look if the Local Group were to be considered representative of the Universe as a whole.
1 Introduction
The study of resolved stellar populations provides a powerful tool to follow galaxy evolution directly in terms of physical parameters such as age (star formation history, SFH), chemical composition and enrichment history, initial mass function, environment, and dynamical history of the system. Photometry of individual stars in at least two filters and the interpretation of Colour-Magnitude Diagram (CMD) morphology gives the least ambiguous and most accurate information about variations in star formation within a galaxy back to the oldest stars. Some of the physical parameters that affect a CMD are strongly correlated, such as metallicity and age, since successive generations of star formation may be progressively enriched in the heavier elements. Careful, detailed CMD analysis is a proven, uniquely powerful approach (e.g., Tosi et al. 1991; Tolstoy & Saha 1996; Aparicio et al. 1996; Mighell 1997; Dohm-Palmer et al. 1997, 1998; Hurley-Keller et al. 1998; Gallagher et al. 1998; Tolstoy et al. 1998) that benefits enormously from the high spatial resolution of to the point that ground based CMD analysis is only worthwhile in ideal conditions beyond about the distance of the Magellanic Clouds.
Because of the tremendous gains in data quality and thus understanding which have come from recent high quality CMDs of nearby galaxies it is now clearly worthwhile and fundamentally important to complete a survey of the resolved stellar populations of all the galaxies in our Local Group (LG). This will provide a uniform picture of the global star formation properties of galaxies with a wide variety of mass, metallicity, gas content etc. (e.g. Mateo 1998), and will make a sample that ought to reflect the SFH of the Universe and give results which can be compared to high redshift survey results (e.g., Madau et al. 1998). Initial comparisons suggest these different approaches do not yield the same results (Fukugita et al. 1998), but the errors are large.

2 Colour-Magnitude Diagram Analysis
Much of our detailed knowledge of the SFHs of galaxies beyond 1 Gyr ago comes from the Milky Way and its nearby dSph satellites or from CMDs. To date, the limiting factors have been crowding and resolution limits for accurate stellar photometry from the ground. provides a unique opportunity to extend beyond our immediate vicinity and encompass the whole LG. To date has observed the resolved stellar populations in variety of nearby galaxies (e.g., dE, NGC 147, Han et al 1997; Irr, LMC, Geha et al. 1998; Spiral, M 31, Holland et al. 1996; BCD, VII Zw 403, Lynds et al. 1998; dI, Leo A, Tolstoy et al. 1998; dSph, Leo I, Gallart et al. 1998). For every LG galaxy at which has pointed at we have learnt something new and fundamentally important that was not discernable from ground based images, especially in the case of small dIs. The small dIs, like the dSph appear to exhibit a wide variety of SFHs. These results have affected our understanding of galaxy formation and evolution by demonstrating the importance of episodic star formation in nearby low mass galaxies. The larger galaxies in the LG have evidence of sizeable old halos, which appear to represent the majority of star formation in the LG by mass, although the problems distinguishing between effects of age and metallicity in a CMD result in a degree of uncertainty in the exact age distribution in these halos. It is important that detailed comparative studies of all galaxies in the LG are made in the future, including the M 31 and M 33 halo populations, to obtain a picture of the fossil record of star formation in galaxies of various types and sizes, and to identify both commonalities and differences in their SFH across the LG. In addition to a better understanding of galaxy evolution this will enable the comparison with cosmological surveys to be made more accurately.
Stellar evolution theory provides a number of clear predictions, based on relatively well understood physics, of features expected in CMDs for different age and metallicity stellar populations (see Figure 1). There are a number of clear indicators of varying star formation rates (sfr) at different times which can be combined to obtain a very accurate picture of the entire SFH of a galaxy.
Main Sequence Turnoffs (MSTOs): If we can obtain deep enough exposures of the resolved stellar populations in nearby galaxies we can obtain the unambiguous age information that comes from the luminosity of MSTOs. Along the Main Sequence itself different age populations overlie each other completely making the interpretation of the Main Sequence luminosity function complex, especially for older populations. However the MSTOs do not overlap each other like this and hence provide the most direct, accurate information about the SFH of a galaxy. MSTOs can clearly distinguish between bursting star formation and quiescent star formation, (e.g. Hurley-Keller et al. 1998).
The Red Giant Branch (RGB): The RGB is a very bright evolved phase of stellar evolution, where the star is burning H in a shell around its He core. For a given metallicity the RGB red and blue limits are given by the young and old limits (respectively) of the stars populating it (for ages 1 Gyr). As a stellar population ages the RGB moves to the red, for constant metallicity, the blue edge is determined by the age of the oldest stars. However increasing the metallicity of a stellar population will also produce exactly the same effect as aging, and also makes the RGB redder. This is the (in)famous age-metallicity degeneracy problem. The result is that if there is metallicity evolution within a galaxy, it impossible to uniquely disentangle effects due to age and metallicity on the basis of the optical colours of the RGB alone.
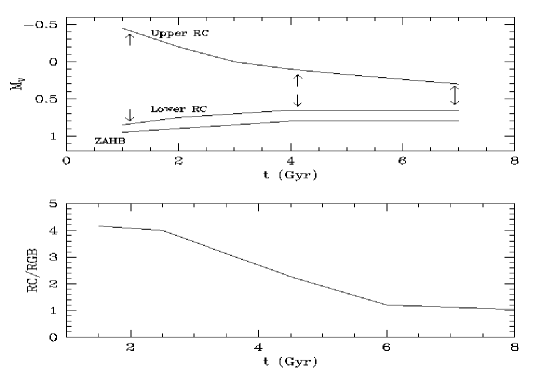
The Red Clump/Horizontal Branch (RC/HB): Red Clump (RC) stars and their lower mass cousins, Horizontal Branch (HB) stars are core helium-burning stars, and their luminosity varies depending upon age, metallicity and mass loss (Caputo et al. 1995). The extent in luminosity of the RC can be used to estimate the age of the population that produced it (Caputo et al. 1995), as shown in the upper panel of Figure 2. The ratio, tRC / tRGB, is a decreasing function of the age of the dominant stellar population in a galaxy, and the ratio of the numbers of stars in the RC, and the HB to the number of RGB is sensitive to the SFH of the galaxy (Tolstoy et al. 1998; Han et al. 1997). Thus, the higher the ratio, N(RC)/N(RGB), the younger the dominant stellar population in a galaxy, as shown in the lower panel of Figure 2. This age measure is independent of absolute magnitude and hence distance, and indeed these properties can be used to determine an accurate distance measure on the basis of the RC (e.g. Cole 1998). The presence of a large HB population on the other hand (high N(HB)/N(RGB) or even N(HB)/N(MS), is caused by a predominantly much older (10 Gyr) stellar population in a galaxy. The HB is the brightest indicator of very lowest mass (hence oldest) stellar populations in a galaxy.
The Extended Asymptotic Giant Branch (EAGB): The temperature and colour of the EAGB stars in a galaxy are determined by the age and metallicity of the population they represent (see Figure 3). However there remain a number of uncertainties in the comparison between the models and the data (Gallart et al. 1994; Lynds et al. 1998). It is very important that more work is done to enable a better calibration of these very bright indicators of past star formation events. In Figure 3 theoretical EAGB isochrones (Bertelli et al. 1994) are overlaid on the HST CMD of a post-starburst BCD galaxy VII Zw403, and we can see that a large population of EAGB stars is a bright indicator of a past high sfr, and the luminosity spread depends upon metallicity and the age of the sfr. That the RGB+AGB population of VII Zw403 looks so similar to NGC 6822 (Gallart et al. 1994) is suggestive that dI and BCD galaxies can easily transform into each other on very short time scales.

3 The Connection to High Redshift
Star-forming, dI galaxies represent the largest fraction by number of galaxies in the LG, and it is clear from deep imaging surveys that this number count dominance appears to increase throughout the Universe with lookback time (Ellis 1997). The large numbers of “Faint Blue Galaxies” (FBG) found in deep imaging-redshift surveys appear to be predominantly intermediate redshift (, or a look-back time out to roughly half a Hubble time), intrinsically small late type galaxies, undergoing strong bursts of star formation (Babul & Ferguson 1996). Thus we can assume that the dIs we see in the LG are a cosmologically important population of galaxies which can be used to trace the evolutionary changes in the sfr of the Universe with redshift. The “Madau-diagram” (Madau et al. 1998) uses the results of redshift surveys to plot the SFH of the Universe against redshift. It predicts that most of the stars that have formed in the Universe have done so at redshifts, z . If it is correct, then the MSTOs from the most active period of star formation in the Universe will be easily visible as 79 Gyr old MSTOs in the galaxies of the LG (e.g. Rich 1998). Determining accurate SFHs for all the galaxies in the local Universe using CMD analysis provides an alternate route to and thus check upon the Madau-diagram.
Recent detailed CMDs of several nearby galaxies and self-consistent grids of theoretical stellar evolution models have transformed our understanding of galactic SFHs. Most of the dI CMDs to date suggest that the sfr was higher in the past, although the peak in the sfr has occured at relatively recent times as defined by Madau-diagram (the peaks occur at z=0.10.2, within the first bin). The Mateo review of all LG dwarf galaxies (Mateo 1998) and studies of M31 and our Galaxy (Renzini 1998), on the other hand, suggest that the LG had its most significant peak in star formation 10 Gyr ago (i.e at z 3), the epoch of halo formation. Many galaxies contain large numbers of RR Lyr variables (or HB) and/or globular clusters which can only come from a significant older population. It is possible that dI galaxies have quite different SFHs to the more massive galaxies. Thus although the small dI galaxies in the LG have been having short, often intense, bursts of star formation in comparatively recent times this is not representative of the majority of the star formation in the LG. However direct observations of the details of the oldest star forming episodes in any galaxy are limited at best. This is an area where advanced CMD analysis techniques have been developed (e.g. Tolstoy & Saha 1996) and telescopes with sufficient image quality exist and the required deep, high quality imaging are observations are waiting to be made.

Figure 4 summarizes what can currently be said about the SFH of the LG and how this compares with the Madau et al. (1998) and Shanks et al. (1998) redshift survey predictions. We have not included the dominant large galaxies in the LG, the Galaxy and M 31, but the SFH of the combined dwarfs is broadly consistent with what is known about the SFH of these large systems. They have, as far as we can tell, had a global sfr that has been gradually but steadily declining since their (presumed) formation epoch 10 Gyr ago. There is currently no evidence for a particular peak in sfr around 79 Gyr ago or any other time, as predicted by the Madau-diagram for either large galaxies or dwarfs. The dominant population by mass in the LG dwarfs are dE, if dIs are singled out a population with a star formation peak in the Madau-diagram range can be found. But at present the statistics are too limited to determine the typical fraction of old population in LG dIs. There is clearly a total mismatch between the SFH of the LG and the results from the redshifts surveys. This might hint at serious incompleteness problems in high redshift galaxy surveys, which appear to miss passively evolving systems in favour of small bursting systems.
The recent HST CMD results give much cause for optimism that we can hope to sort out in detail the SFH of all the different types of galaxies within in the LG if only HST would point at them occasionally. There is also great potential for ground based imaging using high quality imaging telescopes with large collecting areas, such as VLT is clearly going to be.
References
- [] Aparicio, A. et al. (1996) Astroph. J. Lett., 469, 97
- [] Bertelli, G. et al. (1994) Astron. & Astrophys. Supp.106, 275
- [] Caputo F. et al. (1995) Astron. & Astrophys., 304, 365
- [] Cole A. (1998) Astroph. J. Lett., 500, L137
- [] Dohm-Palmer, R.C. et al. (1997) Astron. J., 114, 2514
- [] Dohm-Palmer, R.C. it et al. (1998), Astron. J., 116, 1227
- [] Fagotto et al. 1994 Astron. & Astrophys. Supp., 104, 365
- [] Fukugita M., Hogan C.J., Peebles P.J.E. (1998) ApJ, 503, 518
- [] Gallagher, J.S. et al. (1998) Astron. J., 115, 1869.
- [] Gallart C. et al. (1994) Astroph. J. Lett., 425, 9L
- [] Gallart C. et al. (1999) Astroph. J., in press (astro-ph/9811122)
- [] Geha et al. (1998) Astron. J., 115, 1045
- [] Han M. et al. (1997) Astron. J., 113, 1001
- [] Holland et al. (1996) Astron. J., 112, 1035
- [] Hurley-Keller D., Mateo M., Nemec J. (1998) Astron. J., 115, 1840
- [] Lynds, R., Tolstoy, E., O’Neil, E. & Hunter, D.A. (1998) Astron. J., 116, 146
- [] Madau P., Pozzetti L. & Dickinson M. (1998) Astroph. J., 498, 106
- [] Mateo M. (1998) Ann. Rev. Astron.& Astrophys., 36, 435
- [] Mighell K. (1997) Astron. J., 114, 1458
- [] Tolstoy E. (1996) Astroph. J., 462, 684
- [] Tolstoy E. & Saha A. (1996) Astroph. J., 462, 672
- [] Tolstoy, E. et al. (1998) Astron. J., 116, 1244
- [] Tosi M., et al. (1991) Astron. J., 102, 951