The Relative Orientation of Nuclear Accretion and Galaxy Stellar Disks in Seyfert Galaxies
Abstract
We use the difference () between the position angles of the nuclear radio emission and the host galaxy major axis to investigate the distribution of the angle () between the axes of the nuclear accretion disk and the host galaxy disk in Seyfert galaxies. We provide a critical appraisal of the quality of all measurements, and find that the data are limited by observational uncertainties and biases, such as the well known deficiency of Seyfert galaxies of high inclination. There is weak evidence that the distribution of for Seyfert 2 galaxies may be different (at the 90% confidence level) from a uniform distribution, while the Seyfert 1 distribution is not significantly different from a uniform distribution or from the Seyfert 2 distribution. The cause of the possible non-uniformity in the distribution of for Seyfert 2 galaxies is discussed. Seyfert nuclei in late-type spiral galaxies may favor large values of (at the 96% confidence level), while those in early-type galaxies show a more or less random distribution of . This may imply that the nuclear accretion disk in non-interacting late-type spirals tends to align with the stellar disk, while that in early-type galaxies is more randomly oriented, perhaps as a result of accretion following a galaxy merger.
We point out that biases in the distribution of inclination translate to biased estimates of in the context of the unified scheme. When this effect is taken into account, the distributions of for all Seyferts together, and of Seyfert 1’s and 2’s separately, agree with the hypothesis that the radio jets are randomly oriented with respect to the galaxy disk. The data are consistent with the expectations of the unified scheme, but do not demand it.
To appear in ApJ, Vol 516 #1, May 1, 1999
1 Introduction
The nuclear radio sources in Seyfert galaxies often show a “linear” (i.e. double, triple or jet-like) structure on the tens of pc to kpc scale. Such sources are believed to result from collimated ejection of radio-emitting plasma by the nucleus (Wilson & Willis 1980), presumably along the rotation axis of the nuclear accretion disk (e.g. Pringle 1993, Blandford 1993). The observed orientations of the linear radio sources can then be used to probe the distribution of the angle (; we use the nomenclature of Clarke, Kinney & Pringle 1998, hereafter C98) between the nuclear accretion disk and the stellar disk of the host galaxy. This distribution may provide clues to the origin of accretion disks in active spirals.
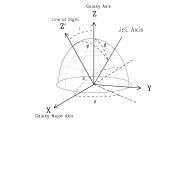
The distribution of the angle, , between the direction on the sky of the radio sources and the apparent major axis of the galaxy disk (see Fig. 1) has been investigated by Ulvestad & Wilson (1984b, hereafter Paper VI), Schmitt et al. (1997, hereafter S97) and C98. In Paper VI, a weak trend was found for the distribution of to avoid values near 0° or 90°, but this trend was not statistically significant given the small size of the sample. S97 found that Seyfert 1’s are less likely to have extended radio structures along the host galaxy major axis (i.e. values of near 0°) while Seyfert 2’s have these structures distributed in most directions. They also concluded that both Seyfert types seem to avoid close alignment between radio and galaxy disk axes (i.e. values of near 90°). S97 interpreted their results in terms of a model in which Seyfert 1’s have the axis of their accretion disk aligned preferentially along the host galaxy disk axis while the accretion disk axis in Seyfert 2’s can assume any angle relative to the host galaxy plane, with the exception of those angles which result in an observed 70°. This is consistent with an earlier model proposed by Schmitt & Kinney (1996), in which the axis of the accretion disk in Seyfert 1’s may be aligned preferentially along the rotation axis of the host galaxy. The analysis of Schmitt & Kinney (1996) was based on the spatial extent of line emission in archival HST images of Seyferts, finding a much greater extent for Seyfert 2’s than 1’s. However, the galaxies selected for these early (pre-COSTAR) observations by HST were preferentially Seyfert 2’s known to have extended emission lines in ground-based observations (Wilson 1997), so the very large difference in sizes found should be treated with caution111More explicitly, most of the pre-COSTAR HST emission-line images of Seyfert galaxies used by Schmitt & Kinney (1996) were taken in three programs - the FOS GTO program, the FOC GTO program and GO program 3724. Two galaxies were observed in other programs. The FOS team selected a mixture of Seyfert 1’s and 2’s without an obvious bias towards galaxies known to have extended emission-line regions in ground-based observations. On the other hand, the galaxies imaged in the FOC GTO and GO 3724 were preferentially selected to be Seyfert 2’s with extended emission-line regions in ground-based observations. Seyfert 2’s were preferentially observed in order to avoid confusion by the PSF of the strong compact nuclear source of Seyfert 1’s. Galaxies with extended emission lines in ground-based observations were selected to ensure an “informative” image with HST. Thus the Seyfert 1’s and Seyfert 2’s studied by Schmitt & Kinney (1996) were selected according to different criteria, and the sample is not well suited to investigating differences in their extended emission-line regions. As they noted, a sample selected by an isotropic property would be required for a conclusive result..
C98 have shown how measurements of both the galaxy inclination () and can be used to obtain better estimates of the distribution of than if only is used. In a comprehensive analysis, they found that the distribution of for the whole sample (Seyfert 1’s and 2’s taken together) is consistent with a uniform distribution in , i.e. the accretion disks are randomly oriented w.r.t. the galaxy stellar disk. They also investigated the distributions of for Seyfert 1’s and 2’s separately, assuming the validity of the unified scheme. In this scheme (see, e.g., Antonucci 1993), Seyfert 1’s are supposed to be galaxies in which the angle, , between the line of sight and accretion disk axis is less than some canonical value, , while Seyfert 2’s have values of greater than . The value of is believed to be about 30° based on the relative number of Seyfert 1 and Seyfert 2 galaxies (e.g. Osterbrock & Shaw (1988)). Assuming that the value of is the only difference between Seyfert 1’s and 2’s, C98 found that the distributions of for Seyfert 1’s and 2’s are different at the 96% confidence level (i.e. approximately 2), with Seyfert 1’s favoring low values and Seyfert 2’s high values of . They concluded that may not be a universal constant or the distributions of Seyfert 1’s and 2’s are significantly different. In the present paper (Section 3.2), however, we argue that a bias in the distribution of for Seyfert galaxies can account for the apparent difference in the distributions of Seyfert 1’s and 2’s, and that there is no evidence that the distributions of the two Seyfert types differ from each other.
Any observational study of the relative orientation of the radio and galaxy disk axes in Seyfert galaxies is limited by small numbers and large observational uncertainties and biases. In this paper, we reevaluate the distribution of following the technique devised by C98. We include new radio maps of Seyferts from a recent survey by Nagar et al. (1998, hereafter Paper VIII), and provide a critical appraisal of all measurements of radio and galaxy major axes and galaxy inclinations. Section 2 describes the samples and data used in this paper, and provides a detailed discussion of the uncertainties in the measurements of the radio axis and host galaxy major axis. Section 3 presents the results and Section 4 provides a brief discussion. Distance dependent quantities are calculated using H0 = 50 km s-1 Mpc-1.
2 Samples & Measurements
2.1 The Samples
The analysis used in this paper requires that we know the P.A.’s of the nuclear radio sources and host galaxy major axes, and the inclination of the host galaxy disk. We determine these parameters for two samples. The first sample comprises all Seyferts with extended nuclear radio structure in the distance- and magnitude-limited sample of early-type Seyfert galaxies of Paper VIII. This sample consists of all Seyferts known as of 1991 with total magnitude mV 14.5, recessional velocity cz 7,000 km s-1, morphological type E, S0 or S0/a, and declination north of =41°. It numbers 43 Seyfert galaxies (14 Seyfert 1’s, 2 Seyfert 1.9’s and 27 Seyfert 2.0’s222We use ‘Seyfert 1’ to denote Seyfert 1.0 through Seyfert 1.5, and ‘Seyfert 2.0’ for galaxies without broad wings on any permitted lines. Seyfert 1.8’s and 1.9’s are treated separately, as these could represent Seyfert 1’s reddened by dust in the plane of the galaxy disk outside of the putative circumnuclear torus (see, e.g., Lawrence & Elvis 1982, Keel 1980 and Maiolino & Rieke 1995). ). All these objects have been observed with the VLA at both 3.6 cm and 20 cm with resolutions of 03 and 15, respectively. To create the second sample used in this paper - the “radio-extended Seyfert sample” - we added to the early-type Seyfert sample all other Seyferts in the literature for which high-resolution ( 2″) radio imaging shows extended nuclear radio structure. The radio-extended Seyfert sample consists of 75 Seyferts (26 Seyfert 1’s, 9 Seyfert 1.8’s and 1.9’s, and 40 Seyfert 2.0’s). This sample includes the 46 Seyferts in the list compiled by S97. Sixty six percent of the 75 galaxies belong to either or both of the distance- and magnitude-limited early-type Seyfert sample of Paper VIII and the distance-limited Seyfert sample of Ulvestad & Wilson (1989, hereafter Paper VII); most of the remaining Seyferts are Markarian galaxies from Ulvestad & Wilson (1984a, hereafter Paper V). We emphasize that such a sample must contain several selection effects, and that a future sample selected by a more isotropic property would be better suited for such a study.
2.2 Difficulties in determining the radio axis
The most reliable radio axes come from sources classified ‘L’ (i.e. double, triple or jet-like sources straddling the optical nucleus). Even here, observations have shown that the apparent axis of the radio ejecta can change significantly with increasing distance from the nucleus. For example, in NGC 1068, the ejecta on a scale of 10 pc lie in P.A.7° (e.g. Gallimore, Baum and O’Dea 1996), but change to 30° at distances of 30400 pc (e.g. Wilson & Ulvestad (1987)). In another case, VLBA imaging of the nucleus of NGC 4151 reveals what may be a ‘bend’ in the jet, from P.A. 20° at the 40 pc scale to P.A. 75° at the 280 pc scale (Ulvestad et al. (1998)), though an interpretation of the inner radio sources as part of a disk or torus cannot be ruled out. For typical distances to Seyfert galaxies and the resolution of the VLA, only the hundred pckpc scale structure can be resolved, with consequent uncertainty in the true nuclear axis. The situation is worse for class ‘S’ (slightly resolved) sources, where it may be unclear whether the extended radio emission represents ejecta from the nucleus or disk radio emission or a mixture of both. The percentage of resolved radio sources which are of class ‘L’ or ‘(L)’ (the parentheses indicate uncertain classification) in the sample of early-type Seyferts, the sample of all radio-extended Seyferts, and the sample used by S97 are 53%, 52% and 67%, respectively. The lack of ‘L’ or ‘(L)’ class sources among Seyfert 1’s is particularly acute; in the early-type sample, the sample of all radio-extended Seyferts, and the sample of S97, there are only 5 (36% of extended radio sources in Seyfert 1’s), 11 (42%) and 8 (53%) such sources, respectively. We have attempted to provide a measure of the reliability of each radio source P.A. by means of a ‘quality flag’. ‘L’ class radio sources are assigned quality flag ‘a’, ‘S’ class radio sources with high S/N ratio are assigned quality flag ‘b’, and ‘S’ class radio sources with low S/N ratio, or doubtful extension are assigned quality flag ‘c’ (see Table 4 of Paper VIII).
We note that, while the three Seyfert 1’s with the highest recessional velocities in the radio-extended Seyfert sample all have very small values (10°) of , their radio structures are very likely to be nuclear in origin as they all show well defined ‘L’ class radio structure at high resolutions - 15 milli-arcsec (16 pc, Mrk 231, Ulvestad et al. (1997)), 02 (230 pc, UGC 5101, Sopp & Alexander (1991)), and 025 (350 pc, Mrk 926, Wilson (1996)).
2.3 Difficulties in determining the galaxy major axis
The P.A. of the major axis of the galaxy disk is also often uncertain. Seyfert galaxy disks may contain bars and oval distortions, leading to incorrect axes if these are interpreted as projections of inclined, circular disks (see e.g. Davies (1973) for NGC 4151 and Baldwin, Wilson & Whittle 1987 for NGC 1068). Nearby companion galaxies may also distort the outer isophotes of Seyfert galaxies.
The major axis of the galaxy should ideally be determined kinematically. Kinematic major axes are available from optical emission-line mapping of the gas rotating in the galaxy disk in four Seyferts - NGC 2110 (multiple long-slit spectra; Wilson & Baldwin (1985)), NGC 3081 (imaging Fabry-Perot; Buta & Purcell (1998)), NGC 5643 (imaging Fabry-Perot; Morris et al. (1985)) and NGC 5728 (imaging Fabry-Perot; Schommer et al. (1988)) - and from stellar kinematics in one Seyfert - NGC 3516 (bidimensional spectroscopy; Arribas et al. (1997)). HI 21 cm kinematic maps exist for 11 Seyferts (NGC 1068, NGC 1365, NGC 3227, NGC 3627, NGC 4051, NGC 4151, NGC 4258, NGC 5033, NGC 6300, NGC 6814 and Mrk 348). We compared the HI kinematic major axis P.A. for these galaxies with the photometric major axis P.A. listed in the “Third Reference Catalogue of Bright Galaxies” (de Vaucouleurs et al. 1991, hereafter RC3), and found that the two values of the P.A. were in good agreement for inclined galaxies (for which the log of the ratio of major to minor axes as defined in RC3 - log R25 - was 0.3), while the difference between the two P.A.’s was larger (up to 45° for NGC 1068) for more face-on galaxies (log R25 0.3). For this reason, we assign quality flag ‘a’ to all kinematic measurements of major axes, and to photometric measurements when the galaxy is highly inclined (log R 0.3). Photometric major axes for galaxies with 0.04 log R25 0.3 are assigned quality flag ‘b’. Galaxies for which no P.A. is listed in RC3, the “Uppsala General Catalogue of Galaxies” (Nilson 1973, hereafter UGC) or the “The ESO/Uppsala Survey of the ESO(B) Atlas” (Lauberts 1982, hereafter ESO), and for which a major axis has been obtained from other sources, are assigned quality flag ‘c’. Quality flag ‘c’ also includes objects with disturbed or peculiar morphology. Quality flag ‘d’ is given to galaxies with log R 0.04 or highly disturbed morphology or which are strongly interacting; such objects are omitted from our study. These flags are summarized in Table 4 of Paper VIII.
2.4 The Data
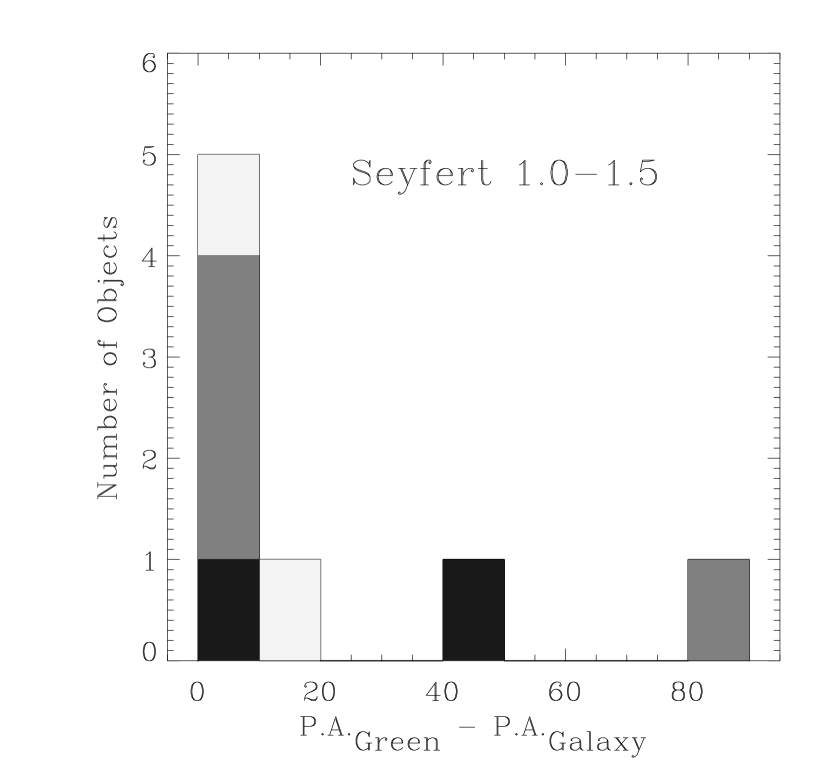
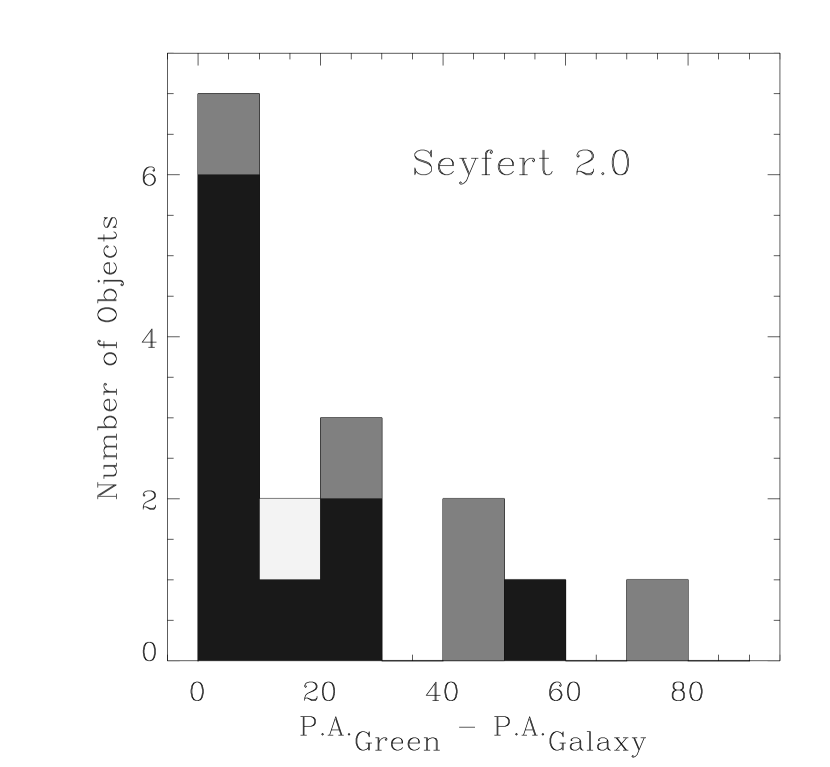
The P.A.’s of the radio and galaxy major axes (P.A.Radio and P.A.Galaxy) for the early-type Seyfert sample are listed in Table 3 of Paper VIII. We also use the P.A.’s of the major axes of the galaxies in the green continuum at a surface brightness of 2 10-18 erg cm-2 s-1 Å-1 (arcsec)-2 (P.A.Green, from CCD imaging by Mulchaey, Wilson & Tsvetanov 1996, hereafter MWZ) as a second measure of the host galaxy major axes. This surface brightness is higher than used for the first measure of host galaxy major axis and is thus more likely to be affected by bars or oval distortions. However, the P.A.’s at this brightness represent a more uniform data set and are available for all galaxies in the early-type sample. A histogram of the difference P.A.Green P.A.Galaxy (Figure 2) shows a strong trend for alignment between these two axes, but also a number of outliers. Brief notes on the radio and galaxy P.A.’s for most objects in the early-type sample can be found in Section 4 of Paper VIII.
The data for the sample of all radio-extended Seyferts are presented in Tables 1, 2 and 3, with columns as follows : (1) galaxy name; (2) Seyfert type. If broad permitted lines are present we follow, whenever possible, the Seyfert classification scheme adopted by Whittle (1992) which is based on the flux ratio R F[OIII]/FHβ, where F[OIII] is the [OIII]5007 flux and FHβ the total (broad plus narrow) H flux. These types are (with R values) Sey 1.0 (R 0.3), Sey 1.2 (0.3 R 1), Sey 1.5 (1 R 4), Sey 1.8 (R 4) and Sey 1.9 (assigned if only broad H is seen). The Seyfert 1.9 subclass is unsatisfactory as it depends on the sensitivity of the spectra. For example, NGC 5273 has been classified as a Seyfert 1.9 by Whittle (1992), but a deeper spectrum reveals broad wings on H as well as H and leads to a classification of Seyfert 1.5 (Ho et al. 1997b ). Fortunately, only 6 of our galaxies are classified as Seyfert 1.9’s. As in Whittle (1992), some Seyferts with highly variable H flux are classified as Sey 1.5. We have used emission-line fluxes listed in Whittle (1992) and Winkler (1992); for objects for which we could find no measurement of R, we use the classification given in “The NASA/IPAC Extragalactic Database” (see e.g. Helou et al. 1991, hereafter NED). Whenever the Seyfert type is derived from some method other than the flux ratio R given in Whittle (1992), the source of the Seyfert type is noted in column 9; (3) radio structure, where, as in Paper V: L = linear, D = diffuse, A = ambiguous, and S = slightly resolved; (4) radio extent in kilo-parsecs (using H0 = 50 km s-1 Mpc-1); (5) radio P.A., and quality flag (Section 2.2); (6) galaxy major axis P.A., and quality flag (Section 2.3); (7) inclination of the host galaxy calculated from the photometric axis ratio of the galaxy unless indicated otherwise in column 9. For galaxies which appear so close to face-on that it is difficult to assign a value for , we arbitarily list a value of 0°; (8) references for the [OIII] and H flux, the radio extent and P.A., and the galaxy major axis P.A. according to the key at the bottom of Table 1; (9) comments, according to the key at the bottom of Table 1. The appendix contains brief notes on the radio and galaxy major axes P.A.’s for some of the galaxies listed in Tables 1, 2 and 3 which are not in the early-type Seyfert sample.
3 Results
We use the techniques of “survival analysis” as coded in the ASURV software package (Lavalley, Isobe & Feigelson 1992) and the Kolmogorov-Smirnov (K-S) test to test for correlations in our data. The numerical values of the probabilities that the distributions are drawn from the same parent population are given in Table 4.
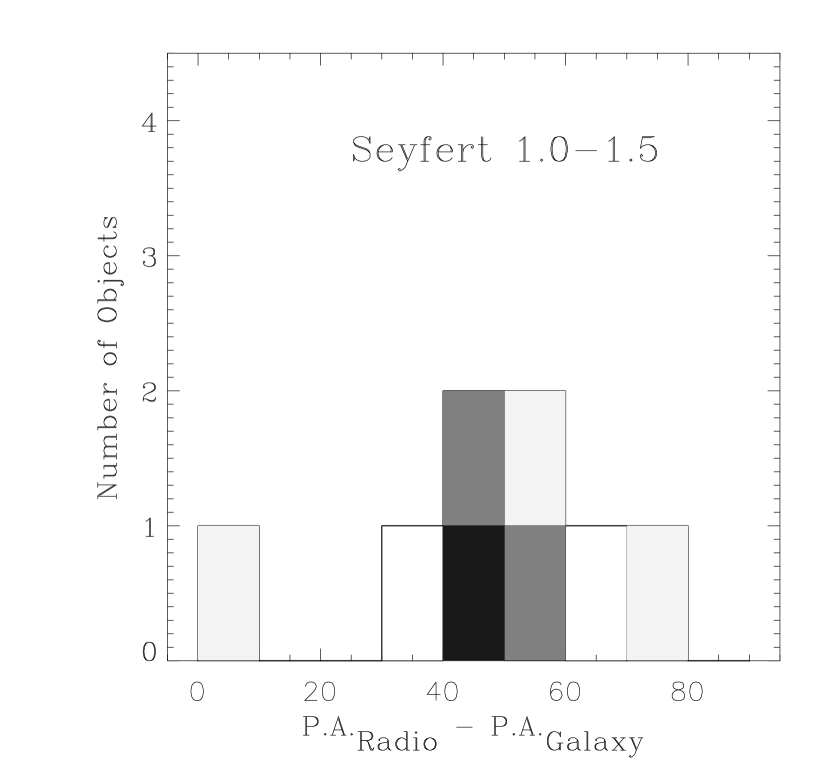
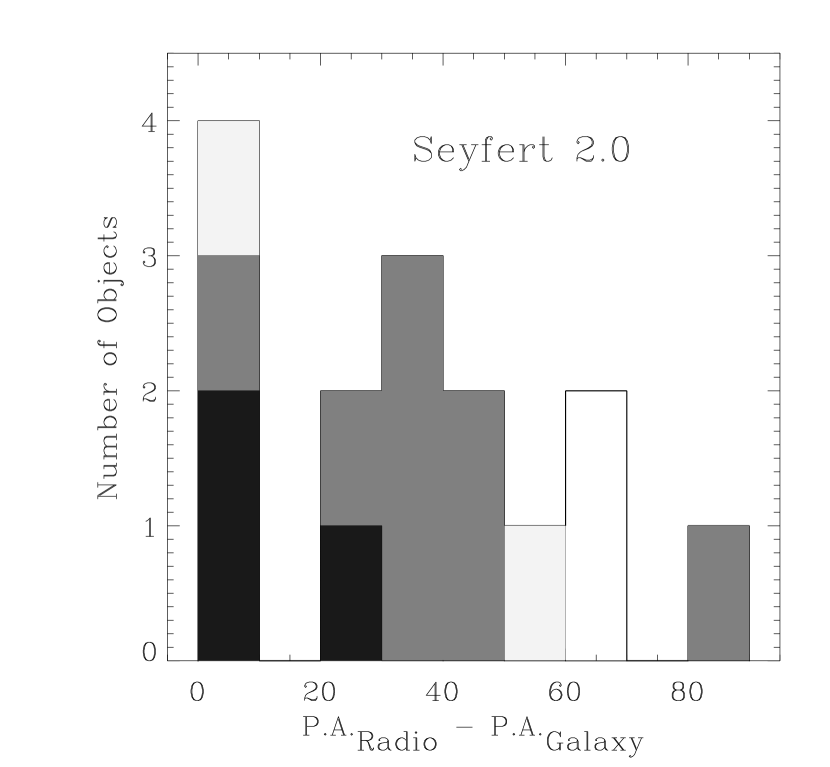
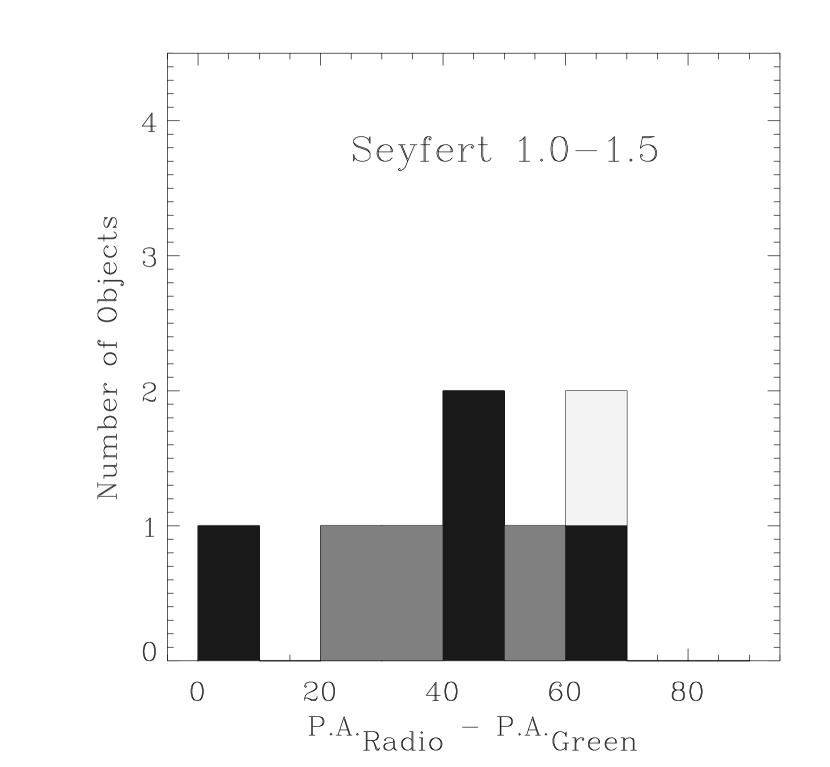
3.1 Distribution of
Histograms of , as measured by P.A.Radio P.A.Galaxy
and P.A.Radio P.A.Green,
for Seyferts in the early-type sample with extended radio structure and
measured galaxy major axes are plotted in Figure 3.
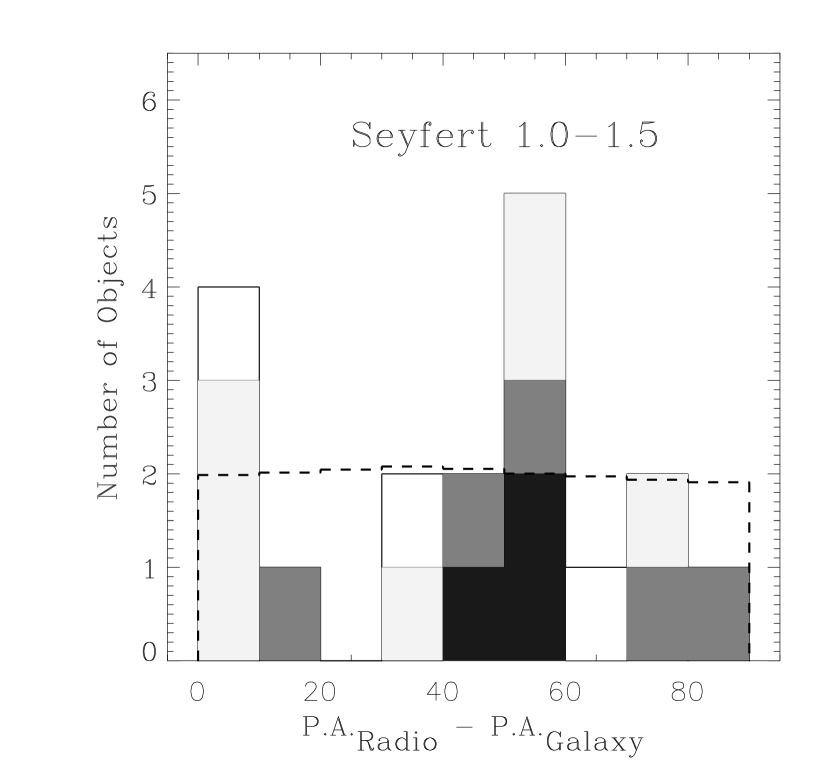
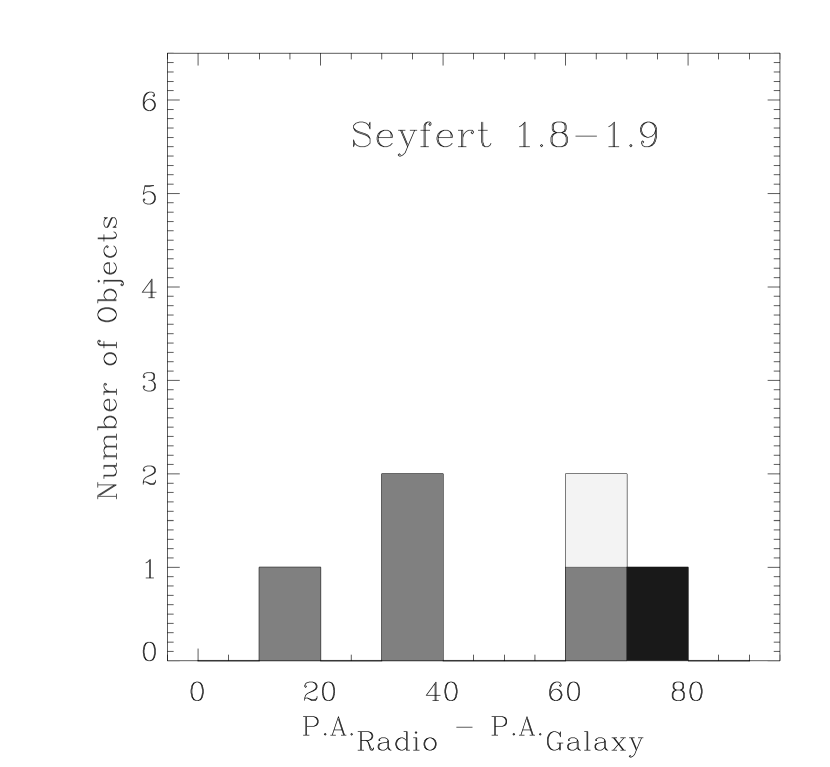
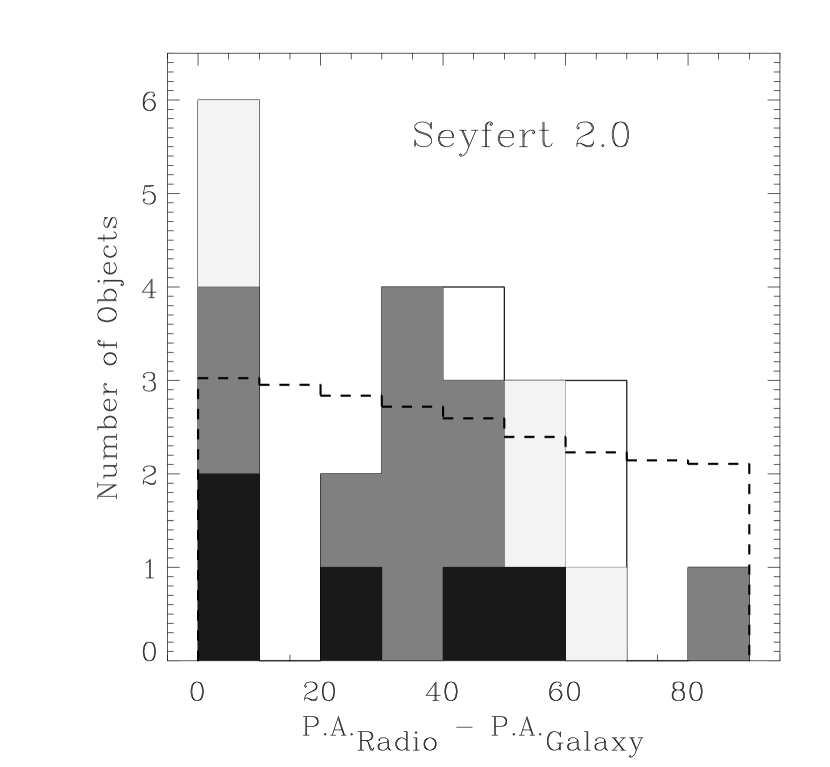
Histograms of = P.A.Radio P.A.Galaxy for the
radio-extended Seyfert sample are shown in Figure 4.
The histograms are shaded according to the reliability of the measurement of
, from black (high quality data) to
white (low quality data) - see caption to Figure 3 for details.
There are 23 (27) galaxies in the two upper (lower) panels of Figure 3,
and 47 galaxies in Figure 4. S97 had 46 galaxies in their study, but only 29
of them are included in Figure 4.
We did not include the remaining 17 because they do not satisfy
our criteria for a measurement of P.A.Galaxy (i.e. these 17 galaxies
are round, or almost so, or distorted by interactions and were assigned
quality flag ‘d’). Three conclusions can be drawn from the distributions
of in Figures 3 and 4:
(a) The data are severely limited by observational uncertainties.
There are very few (three Seyfert 1’s, one Seyfert 1.9 and 5 Seyfert 2.0’s
in Figure 4) high quality determinations of , i.e. galaxies
with quality flag ‘a’ for both the radio structure P.A. and
the host galaxy major axis P.A. (data shown in black). These high quality
values of still have typical errors of 5°;
(b) there is no significant difference between the
distributions of for Seyfert 1’s and Seyfert 2.0’s (Table 4).
The statistical tests were
applied to the complete distribution (all quality flags) and
also to all subsets of the complete distribution formed by selecting
only those data better than a certain quality level;
(c) the distribution of the Seyfert 2.0’s is different from a
uniform distribution at the 90% confidence level, while the
distribution of the Seyfert 1’s is not significantly
different from a uniform distribution (Table 4). As found by S97, there seems
to be a lack of Seyfert 2.0’s with 70°. A posteriori
Poisson statistics give a 3% probability of finding only the one
Seyfert 2.0 at 70° (Fig. 4) instead of the expected five.
Including the Seyfert 1.8 and 1.9 galaxies in either the Seyfert 1 or the
Seyfert 2.0 distribution does not change result (b). If we add the
Seyfert 1.8’s and 1.9’s to the Seyfert 2.0’s, the resulting distribution
of is different from uniform at a confidence
level of only 80%–90%.


Seyferts in host galaxies with morphological type earlier than Sab (T = 2) show a distribution of that is more or less uniformly distributed, with the exception of the possible deficiency for 70° noted above (Fig. 5a and Table 4). However, Seyferts in galaxies with host type Sab and later may favor larger values of (at a 90% confidence level; Table 4). The only late-type Seyfert with a low value of , Mrk 231, is a well known system of two galaxies in an advanced merger stage333 The outer isophotes of the DSS image of this galaxy do not show obvious signs of the merger, so it was retained in the sample for consistency. (Sanders et al. (1987)). The remaining late-type Seyferts do not show obvious signs of on-going mergers. Without Mrk 231, the distribution of for Seyferts of host type Sab and later is different from uniform at the 96% confidence level. Since a distribution of which favors low values gives a distribution of that favors large values, this result suggests that the nuclear accretion disk in non-interacting late-type spirals shares the angular momentum direction of the stellar disk. However, a larger sample is needed for a conclusive result. In early-type galaxies, the accretion disk is more randomly oriented with respect to the stellar disk and may have resulted from accretion following a galaxy merger. There is no significant correlation between the radio extent and (Fig. 5b), though it appears that the maximum extent at a specific value of , increases with increasing .
3.2 The 3-D geometry from and
The distribution of (Figs. 3 and 4) shows the relationship between
the radio axis and host galaxy major axis, as projected on the sky.
C98 have demonstrated
that knowledge of both and , the host galaxy
inclination, can be used in a 3-dimensional statistical analysis to
constrain the values of and (see Fig. 1 for a definition of
the angles).
Briefly, they show that for a given pair of values of and
, the jet vector is constrained to lie on a great circle of a
sphere centered on the galaxy. This great circle passes through the line
of sight and lies at some calculable angle with the plane of the galaxy. The
value of depends on the exact location of the jet vector on the great
circle, which is not known.
One can, however, calculate the minimum possible value of which
corresponds to the case where the great circle passes closest to the
galaxy disk axis. C98 show that
.


We have calculated the values of for all Seyferts in the
radio-extended Seyfert sample for which values of both and
are available and the results (Fig. 6a) are similar to those of C98,
namely Seyfert 1’s appear to favor smaller values of at a
confidence level of 90% (Table 4).
The difference between the two distributions appears larger
( 95% confidence level, Table 4)
when we consider only higher quality data (quality flag ‘b’ or better),
though the Kolmogorov-Smirnov (K-S) test only supports the difference at
the 82% confidence level.
This difference, however, is probably biased by the difference in the
inclination distributions of the Seyfert 1’s and 2.0’s.
Though the distributions of for Seyfert 1’s and 2.0’s in our sample are
not significantly different in a statistical sense (Table 4), Seyfert 2.0’s
are seen in higher inclination host galaxies than Seyfert 1’s (Fig. 7).
For example, eight (27%) Seyfert 2.0 host galaxies have as
compared to only one (5%) Seyfert 1 host galaxy.
Since can also be expressed as
smaller values of will result in smaller values of for
a given .
Indeed, omitting all galaxies with 60° from the sample
results in similar distributions for Seyfert 1’s and 2.0’s
(Fig. 6b and Table 4). We conclude there is no significant difference
between the distributions of for Seyfert 1’s and 2.0’s.

We have also estimated the probability distribution of for all Seyfert types using the method developed by C98. In this method, one starts with an assumed probability distribution for , P, such as the hypothesis that the jets are randomly oriented, P = . Then, for each data pair (,), one calculates the range of possible values for and . The data point is then distributed, using appropriate weighting, over all these possible values of and . After distributing all data points, one can integrate over azimuth (; see Fig. 1) and recover an output probability distribution for , P). If P and P are similar, then the input distribution is a good approximation to the actual distribution of . In agreement with C98, we find that the (,) data for the radio-extended Seyfert sample are consistent with the idea that the radio jets are randomly distributed with respect to the host galaxy plane when all Seyfert types are taken together (Fig. 8a). This results still holds when we use only higher quality data (quality flag ‘b’ and above). There is no significant difference between the distributions of for Seyfert 1’s and 2.0’s when these are considered separately (Figs. 8b and 8c).

Further, following C98, we can assume that the unified model is valid, namely that Seyfert 1’s and Seyfert 2’s are distinguished by whether is smaller or greater than, respectively, . We then obtain the distributions shown by the data points in Figure 9 for various assumed values of . The results for = 40° are similar to those calculated by C98 (their Fig. 5), with an apparent trend for Seyfert 2’s to favor high values of and Seyfert 1’s low values of . As we now show, this apparent difference between the Seyfert 1 and Seyfert 2.0 distributions is expected even if the radio jets are randomly distributed with respect to the host galaxy disk, i.e. even if the actual distribution is uniform in for both types of Seyferts. For galaxy inclination , a jet with and 90° will be directed along the l.o.s. and the galaxy will be seen as a Seyfert 1. In fact, all galaxies with jets within of the l.o.s. will be observed as Seyfert 1’s, so for this type of Seyfert, values of close to will be preferentially selected. The distributions of for the radio-extended Seyferts show a deficiency of high values of (Fig. 7), which is expected in a sensitivity-limited Seyfert sample due to obscuration in the galaxy disk (e.g. Ho, Filippenko & Sargent 1997a). This deficiency is especially strong for Seyfert 1’s. For the present analysis, there is also a lower cutoff of 20°, since nearly face-on galaxies (major to minor axes ratio 1.1) are omitted from the sample because they do not have a well defined galaxy major axis (see Section 2.3). This deficiency of high (low) values of results in a deficiency of high (low) values of for Seyfert 1’s. The rightmost bin in each panel of Figure 9 consists of 71° 90°. Seyfert 1 galaxies in this bin have inclinations and so should be relatively few in number. The actual number is very sensitive to the upper inclination cutoff in the observed sample and the value of . The depletion of Seyfert 1’s in the leftmost bin is not as significant because the surface area of the hemisphere between = 0° and 20° is 0.2 times the surface area between = 71° and 90°. The expected distributions of for Seyfert 1’s and 2.0’s, using the actual observed distributions of for the sample (Fig. 7), and the assumption that is randomly distributed, are shown by the solid lines in Figure 9. These expected distributions for values of do not change significantly if, instead, we use a distribution of that is uniform in over the range 20° 65° and zero elsewhere. For values of 30°, the expected distribution for Seyfert 2.0’s is barely different from uniform in , as Seyfert 2.0’s are seen over most (0.87 if =30°) of the hemisphere. A simple distribution (with two degrees of freedom) shows no significant difference between the observed and expected distributions of for both Seyfert 1’s and Seyfert 2.0’s. We also find that the data cannot be used for constraining as the observed and expected distributions of are in agreement for a wide range of values of (Figure 9).
The inclination bias that we have discussed here does not affect the expected distributions of Seyfert 1’s and 2.0’s. If the jets are randomly oriented, then, regardless of the galaxy inclination distribution, the expected distribution of is uniform for both Seyfert types. The weak trend for the distribution of for Seyfert 2.0’s to increase with is a consequence of the weak trend for the distribution of to decline toward higher for these galaxies (Section 3.1 and 4.1).

There is no known relativistic beaming in Seyferts on the scale of our radio extents (hundreds of pc – several kpc), so the brighter radio jet may point towards (; Fig. 1) or away () from us. Further, there is no significant absorption in the disk at short centimeter wavelengths, so the brighter jet may be on the near side ( 0; Fig. 1) or the far side ( 0) of the galaxy disk. For the analysis in this paper, symmetry ensures that it is sufficient to consider the region 0 only (C98). The relative geometry in NGC 1068, and perhaps NGC 3516, can be more closely constrained. In NGC 1068, the HI kinematics (Brinks & Mundell (1996)) and the assumption of trailing spiral arms indicate that the nearer half (; Fig. 1) of the galaxy disk is to the S. The NE radio-lobe is located in front of the HI disk and the SW radio-lobe behind (Gallimore et al. (1994)), so we know that the NE radio lobe projects against the farther side of the galaxy and has . In NGC 3516, Ferruit, Wilson & Mulchaey (1998) present evidence that the nearer half of the galaxy disk is to the NW, and that the ionized-gas associated with the N radio-lobe is on the far side of the galaxy disk. Therefore the S radio-lobe has .
4 Discussion
We have shown that the distributions of for Seyfert 1’s, Seyfert 2.0’s, and all Seyferts taken together are consistent with the hypothesis that the radio jets are randomly oriented with respect to the galaxy disk (Fig. 8). This hypothesis is also supported by the distribution of for Seyfert 1’s and Seyfert 2.0’s, under the assumptions of the unified scheme (Fig. 9). However, the distribution of (Figs. 3 and 4) for Seyfert 2.0’s may be different from a uniform distribution, but only at the 90% confidence level (Table 4). This possible non-uniformity shows up as an apparent deficiency of Seyfert 2.0’s with 70° 90°, as already noted by previous workers (Paper VI; S97). We now briefly discuss possible causes of this deficiency.
4.1 The Possible Deficiency of Seyfert 2.0’s at Large
In order to determine which jets contribute to the possible deficiency of
Seyfert 2.0’s at large , we have computed the distribution of galaxies
as a function of and for galaxies with
. We have used = 30° and the
observed distribution of (Figure 7). The resulting distribution, shown
in Figure 10, is asymmetric about the = 0° plane because
most of the jets near = 90°, = 40°
are directed towards the observer and therefore classified as Seyfert 1’s.
The central “valley floor” at the smaller values of
and 20° appears because these Seyfert 2.0’s have
70°.
Varying the value of and the weight distribution of
does not significantly change the results that :
(i) all values of contribute to the possible deficiency of
Seyfert 2.0’s at high , so this deficiency cannot result from a
simple absence or excess of galaxies with certain values of ;
(ii) an absence of jets with
70° 90°
at all values would produce the observed deficiency, but since the
angle is defined by the observer’s orientation, there is no physical
basis for such an absence.

The best explanation for the observed distribution of is a smooth decline in the number of galaxies from = 0° to = 90°, as suggested earlier by S97. Such a distribution can result from a distribution which has relatively few jets at and/or relatively more jets at (see Figure 6c of S97). We have computed the expected distribution of by starting with a random distribution of jets and then taking 50% fewer jets at and 50% more jets at , a distribution consistent with the points for Seyfert 2.0’s in Figures 8 and 9. We use = 30° and the observed distribution of (Fig. 7). The resulting expected distributions of are shown with the thick dashed lines in the two left panels of Figure 4, and are consistent with the observations.
A distribution which favors larger values of can result from any of the following effects: (i) an asymmetric distribution of ambient density in the central kpc, as mentioned by S97. If the density were lower along the disk axis, plasma ejecta with low might produce less radio emission, if interaction with the ambient medium is needed for significant radio synchrotron emission. (ii) contamination by SNR’s and other emission in the disk of the galaxy, which would be interpreted as radio ejecta at = 90°. (iii) gravitational bending of low velocity ,‘heavy’, radio ejecta by the gravitational potential of the disk (“fountain model”). For example, a plasmoid moving ballistically with an ejection velocity of 500 km s-1 at = 45° in a disk potential of M☉ kpc-2 will be bent to = 64° in 2 yr. This effect will change an initially random jet distribution to one which favors high values of . (iv) a preferential orientation of galactic magnetic field perpendicular to the disk over the inner kpc of the galaxy, which would cause radio ejecta at low values to see a smaller component of tangential magnetic field. Models which use ambient field compression (e.g. Wilson & Ulvestad (1987)) predict lower synchrotron emission from such ejecta. (v) a trend for the accretion disks to be preferentially highly inclined with respect to the galaxy stellar disks. While a process such as the radiatively-driven disk instability (Pringle (1997)) may serve to randomize the planes of the nuclear accretion disks, we know of no process which would lead to the accretion and galaxy stellar disks systematically avoiding being coplanar.
4.2 The Unified Scheme
Our analysis shows that the distributions of for Seyfert 1 and 2.0 galaxies are consistent with the unified scheme. There is, however, no evidence which favors the unified scheme over any alternative explanation. If the distribution of in a larger sample of Seyfert 1’s is found to significantly disfavor higher values of , then this, in light of the absence of highly inclined Seyfert 1’s, will provide strong support to the idea that the axes of the accretion disks in Seyfert 1’s are preferentially oriented along the line of sight.
5 Conclusions
We have used the distribution of and to investigate the distribution of in two samples, the early-type Seyfert sample and the sample of all radio-extended Seyferts. Our ability to derive the distribution of is limited by observational uncertainties and biases, and several selection effects within the Seyfert samples. An analysis of the distributions shows that the distribution for Seyfert 2.0’s is only marginally different from uniform (at the 90% confidence level), while that of Seyfert 1’s is not significantly different from uniform. The distributions of Seyfert 1’s and 2.0’s are not significantly different from each other, though all results are limited by the small number of objects, especially Seyfert 1’s.
The distribution of for non-interacting late-type (Sab and later) Seyferts may favor large values of (at the 96% confidence level), while that for early-type Seyferts is found to be more or less random. We suggest that this result indicates that the nuclear accretion disk in non-interacting late-type spirals shares the angular momentum direction of the stellar disk, while, in early-type galaxies, the accretion disk is randomly oriented with respect to the stellar disk and may have resulted from accretion following a galaxy merger.
We followed the method of C98 to find that the distributions of derived from all Seyfert data together, and from the Seyfert 1 and 2.0 data separately, are consistent with the hypothesis that the jets are randomly oriented. Following C98, we also used the unified scheme to calculate the distributions of for Seyfert 1’s and 2.0’s separately. The resulting distributions are different, but this difference may be ascribed to the absence of highly inclined galaxies in Seyfert samples, especially type 1 Seyferts. There is, therefore, no evidence that the distributions of Seyfert 1’s and 2.0’s are different from each other or that either one is significantly different from a random distribution. The results are also consistent with the unified scheme.
Finally, we discussed the possible non-uniformity of the distribution for Seyfert 2.0’s. The most straightforward interpretation is that the distribution of for Seyfert 2.0’s decreases smoothly from = 0° to = 90°. Such a distribution can occur if larger values of are somewhat more common than smaller values, and various possible physical explanations were discussed. A much larger sample will be required for a more definitive evaluation of this issue.
Appendix A Notes on Seyfert Galaxies not in Early-Type Sample
NGC 1068
Radio source S1 is generally believed to represent the location of the active nucleus, based on its spectrum (Gallimore et al. (1996)), morphology (Gallimore, Baum & O’Dea 1997) and the presence of water vapor masers (Greenhill et al. (1996)). The P.A. between sources S1 and S2 (Gallimore et al. 1996; their Figure 1) is 6° while the P.A. between sources S1 and C is 13°. We adopt a radio P.A. of 0°. RC3 lists a photometric major axis P.A.RC3 = 70° and log R25 = 0.07. HI kinematic data (Brinks & Mundell (1996)) show that the galaxy disk is warped, with a major axis P.A. (P.A.HI) that increases from 95° in the high surface brightness inner ring to 115° in the faint outer extensions at radius 200″. Thus, P.A.RC3 - P.A.HI = 45°.
NGC 1144
(Arp 118) This galaxy shares a common envelope with NGC 1143. P.A.RC3 = 110° for NGC 1143 and P.A.RC3 = 130° for NGC 1144.
NGC 1365
RC3 lists major axis P.A.RC3 = 32° and log R25 = 0.26. The HI kinematic studies of Ondrechen & van der Hulst (1989) indicate a major axis P.A.HI of 222° and an inclination of 46°. Thus, P.A.RC3 - P.A.HI = 10°.
NGC 2622
RC3 lists log R25 = 0.24 but does not give a major axis P.A. A second generation DSS image clearly shows that the galaxy is interacting with its nearest neighbor which is at a distance of 1′.
NGC 2992
(Arp 245, MCG2-25-14). This galaxy forms an interacting pair with NGC 2993. RC3 lists log R25 = 0.51, but does not give a major axis P.A. The “Extended Southern Galactic Catalog” (Corwin et al. 1998, hereafter ESGC), lists galaxy major axis P.A. = 15° and diameter = 603 x 219 in B. Thompson & Martin (1988) used enlarged Sky Survey prints to measure a major axis P.A. of 18°. DSS images show that while the galaxy is strongly interacting, the central and northern parts of the galaxy appear undisturbed and the isophotes show a consistent major axis P.A.
NGC 3227
(Arp 94). RC3 lists major axis P.A.RC3 = 155° and log R25 = 0.17. We use the major axis P.A. and inclination obtained from HI kinematic observations (Mundell et al. (1995)). P.A.RC3 - P.A.HI = 3°.
NGC 5135
(ESO 444-G32, MCG5-32-13) RC3 lists log R25 = 0.15 but does not list a major axis P.A. ESO lists a diameter of 35 x 33. Corwin et al. (1985) find the galaxy diameter to be 55 x 537. A first generation DSS image confirms that the galaxy is nearly circular.
NGC 5643
RC3 lists log R25 = 0.06 and does not list a major axis P.A. The ESO catalog lists the galaxy diameter as 6′ x 55 in B. de Vaucouleurs (1977) gives a galaxy diameter of 537 x 479, while Corwin et al. (1985) give 692 x 646. Morris et al. (1985) measure a photometric major axis P.A. of 128°10° and a kinematic major axis P.A. of 136525.
NGC 5728
RC3 lists major axis P.A.RC3 = 30°, which is the P.A. of the bar. ESGC lists major axis P.A. = 0° at a diameter of 692 x 537 in B. DSS images show that the major axis P.A. is close to 0°. Schommer et al. (1988) find the galaxy to have a photometric major axis P.A. of 2°5° and a kinematic major axis P.A. of 2°.
NGC 5929
This galaxy shares a common outer envelope with its neighbor NGC 5930. RC3 lists log R25 = 0.03 and does not list a major axis P.A. UGC lists a galaxy diameter of 11 x 1′ in R and 1′ x 09 in B. The galaxy is too round to measure a major axis P.A.
NGC 6814
RC3 does not list a major axis P.A. for this object. ESGC lists a diameter of 447 x 447 and Buta (1988, private communication to “The Lyon-Meudon Extragalactic Database” see e.g. Paturel et al. 1997, hereafter LEDA) finds a diameter of 302 x 288. Liszt & Dickey (1995) have mapped the HI emission in this galaxy out to a diameter of about 6′. They find a large kinematic warp in the outer galaxy disk: the kinematic major axis decreases monotonically from 200° at distance 3 kpc from the center to 165° at distance 21 kpc from the center, leading them to adopt a major axis P.A.HI = 176°. They also suggest that the galaxy is much more nearly face-on than = 22°, and we therefore label its inclination as = 0° (see Section 2.4).
NGC 7450
(Mrk 1126) RC3 lists log R25 = 0 while ESGC lists a galaxy diameter of 219 x 219 in B. A second generation DSS image confirms that the galaxy is almost circular.
Mrk 34
This galaxy is not listed in the RC3 and UGC catalogs. Garnier et al. (1996) find the galaxy to have a diameter of 063 x 044 in B. A second generation DSS image shows the galaxy is compact, with ill-defined outer isophotes.
Mrk 78
RC3 lists log R25 = 0.26, but does not give a galaxy major axis P.A. Takase & Miyauchi-Isobe (1987) list a galaxy diameter of 04 x 02. A first generation DSS image shows the outer isophotes to be ill-defined.
Mrk 79
Oke and Lauer (1979) state that this galaxy is extended along P.A.65°. MacKenty (1990) measures a major axis P.A. of 65° at the 24 mag (arcsec)-2 contour in R corresponding to a major axis diameter of 08. The image published in MacKenty (1990) shows an anomalous arm which starts to the NE and then curves to the SE. This is the most extended feature in the image and biases any attempt to determine a major axis P.A. UGC lists galaxy diameters of 141 x 141 in B and 151 x 129 in R and Garnier et al. (1996) measure a diameter of 107 x 107 in B. Since these measurements are at a larger diameter than those in MacKenty (1990), we consider the galaxy to be essentially circular.
Mrk 110
This galaxy is not listed in the RC3 and UGC catalogs. Takase & Miyauchi-Isobe (1987) list a galaxy diameter of 05 x 03. while MacKenty (1990) finds this object is circular at the 24 mag (arcsec)-2 isophote in R, which corresponds to a diameter of 24″. A second generation DSS image shows that the outer isophotes of the galaxy are disturbed, with a prominent tail to the west.
Mrk 176
(Arp 322) RC3 lists log R25 = 0.53 but does not give a major axis P.A. Garnier et al. (1996) measure a major axis P.A. of 59° and a galaxy extent of 081 x 041 in B. A second generation DSS image shows that Mrk 176 shares a common outer envelope with two close companion galaxies.
Mrk 231
The radio morphology of this source is complex. Recent VLBA images (Ulvestad, Wrobel & Carilli 1998) reveal a 2 pc scale ‘jet’ in P.A. 65°, and a 40 pc scale triple radio structure in P.A. 0° which is the P.A. of the larger scale VLBA and VLA radio structure. There is no evidence of radio structure linking the 2 pc and 40 pc scale radio knots. We use a radio P.A. of 0° in order to be consistent with the scale over which the radio P.A. has been measured for most other sources in the sample.
Mrk 266
(NGC 5256) This galactic pair consists of a Seyfert 2 nucleus to the SW and a LINER nucleus to the NE. RC3 lists log R25 = 0.05 but does not give a major axis P.A. UGC lists an extent of 12 x 11 in B and Garnier et al. (1996) find a diameter of 117 x 117 in B. The galaxy is thus essentially circular. Kukula et al. (1995) give a P.A. of 32° for the overall radio structure between the Seyfert and LINER nucleus. Mazzarella et al. (1988) have used deeper high resolution VLA maps to find the radio structure associated with the Seyfert nucleus has an ‘L’ type morphology in P.A. 10°.
Mrk 270
Both RC3 and UGC indicate this galaxy is nearly circular. We have confirmed this with a second generation DSS image.
Mrk 273
RC3 lists log R25 = 0.64 but does not give a major axis P.A. (the galaxy is classified as peculiar). UGC lists a diameter of 12 x 025 in B but also does not list a major axis P.A. Garnier et al. (1996) give a major axis P.A. of 11° at a diameter of 162 x 052. A second generation DSS image shows that the most prominent feature is a peculiar extension to the S.
Mrk 423
This galaxy is not listed in UGC or ESO. RC3 lists log R25 = 0.23 but does not give a major axis P.A. DSS images show an extension in P.A. 58° at an extent of about 1′ x 05. The extension appears to be a pair of spiral arms and the image is not deep enough to determine a major axis P.A. for the putative disk.
Mrk 463E
The other component of the pair, Mrk 463W, is either a Seyfert 2 or a starburst galaxy (Mazzarella et al. (1991)). Neff & Ulvestad (1988) find the radio P.A. = 10° for Mrk 463E, while Mrk 463W remains unresolved. Mazzarella et al. (1991) have found a radio component 13 S of Mkn 463E, corresponding to a linear distance of 1.9 kpc. RC3 does not give a major axis P.A. but lists log R25 = 0.34. Thompson & Martin (1988) used enlarged Sky Survey prints to measure a major axis P.A. of 89°. A second generation DSS image shows that while the inner isophotes are elliptical, the outer isophotes show an extension to the SW. This faint extension is the most extended feature in the galaxy and biases any measurement of the major axis.
Mrk 509
This galaxy is not listed in RC3 or UGC. Thompson & Martin (1988) used enlarged Sky Survey prints to measure a major axis P.A. of 70° at an extent of 017 x 01. Phillips, Baldwin & Atwood (1983) used deeper images to measure a P.A. of 70°5°.
Mrk 530
RC3 lists the major axis P.A.RC3 = 165° and log R25 = 0.18. UGC also gives the major axis P.A. = 165° at a diameter of 158 x 089 in B. ESGC lists the major axis P.A. = 5° at a diameter of 257 x 195.
Mrk 533
(NGC 7674) RC3 lists log R25 = 0.04 and does not give a major axis P.A. Paturel & Petit (private communication to LEDA) derive a major axis P.A. of 150°, which appears to be the P.A. of the brighter isophotes. The fainter isophotes are more circular and are affected by a nearby companion to the NE.
Mrk 609
RC3 lists log R25 = 0.16, but does not give a major axis P.A. ESGC lists major axis P.A. = 90° at a diameter of 091 x 06 in B. A first generation DSS image shows the major axis of the outer isophotes is ill defined.
Mrk 618
RC3 lists log R25 = 0.12 but does not give a major axis P.A. ESGC lists major axis P.A. = 85° at a diameter of 132 x 102 in B. A second generation DSS image shows the galaxy to be nearly circular.
Mrk 926
This galaxy is not listed in the RC3, UGC and ESO catalogs. Garnier et al. (1996) measure a diameter of 078 x 054 in V. We used a first generation DSS image to measure a major axis P.A. of 90° at a diameter of 071 x 064.
MCG 8-11-11
RC3 and UGC list major axis P.A. = 90°. UGC lists a diameter of 282 x 251 in B. A second generation DSS image shows the galaxy to be near circular at a diameter of about 2′.
ESO428-G14
This is listed as 0714-2914 in Paper VII.
UGC 5101
UGC lists major axis P.A. = 87° and an extent of 12 x 06 in B and 12 x 079 in R. A first generation DSS image reveals that while the brighter isophotes of the galaxy are elliptical, part of the emission along the major axis is made up of a narrow 30″ finger extending to the west.
References
- (1)
- Acosta-Pulido et al. (1996) Acosta-Pulido, J. A., Vila-Viraró, B., Pérez-Fournon, I., Wilson, A. S., & Tsvetanov, Z. I. 1996, ApJ, 464, 177
- Antonucci (1993) Antonucci, R. R. J. 1993, ARA&A, 31, 473
- Arribas et al. (1997) Arribas, S., Mediavilla, E., Garcia-Lorenzo, B., & del Burgo, C. 1997, ApJ, 490, 227
- Baldwin et al. (1987) Baldwin, J. A., Wilson, A. S., & Whittle, M. 1987, ApJ, 319, 84
- Blandford (1993) Blandford, R. D. 1993, in Astrophysical Jets, STScI Symposium Nr.6, ed. D. Burgarella, M. Livio & C. P. O’Dea (Cambridge University Press), 15
- Brinks & Mundell (1996) Brinks, E., & Mundell, C. G. 1996, in The Minnesota Lectures on Extragalactic Neutral Hydrogen, ASP conference series Vol. 106, ed. E. D. Skillman, 268
- Buta (1988) Buta, R. 1988, private communication to LEDA
- Buta & Purcell (1998) Buta, R., & Purcell, G. B. 1998, AJ, 115, 484
- Clarke et al. (1998) Clarke, C. J., Kinney, A. L., & Pringle, J. E. 1998, ApJ, 495, 189 (C98)
- Corwin et al. (1985) Corwin, H. G., de Vaucouleurs, A., de Vaucouleurs, G. H. 1985, Southern Galaxy Catalog, University of Texas Monographs in Astronomy (Austin: University of Texas)
- Corwin et al. (1998) Corwin et al. 1998, The Extended Southern Galactic Catalog, to be published; data accessed from LEDA (ESGC)
- de Vaucouleurs (1977) de Vaucouleurs, G. 1977, ApJS, 33, 211
- de Vaucouleurs et al. (1991) de Vaucouleurs, G., de Vaucouleurs, A., Corwin, H. G., Buta, R. J., Paturel, G., & Fouque, P. 1991, Third Reference Catalogue of Bright Galaxies (Springer-Verlag) (RC3)
- Davies (1973) Davies, R. D. 1973, MNRAS, 161, 25
- Edmunds & Pagel (1982) Edmunds, M. G., & Pagel, B. E. 1982, MNRAS, 198, 1089
- Falcke et al. (1998) Falcke, H., Wilson, A. S., & Simpson, C. 1998, ApJ, 502, 199
- Ferruit et al. (1998) Ferruit, P., Wilson, A. S., & Mulchaey, J. S. 1998, ApJ, in press
- Gallimore et al. (1996) Gallimore, J. F., Baum, S. A., & O’Dea, C. P. 1996, ApJ, 464, 198
- Gallimore et al. (1997) Gallimore, J. F., Baum, S. A., & O’Dea, C. P. 1997, Nature, 388, 852
- Gallimore et al. (1994) Gallimore, J. F., Baum, S. A., O’Dea, C. P., Brinks, E., & Pedlar, A. 1994, ApJ, 422, L13
- (22) Garnier R., Paturel G., Petit C., Marthinet M. C., & Rousseau J. 1996, A&AS, 117, 467
- Greenhill et al. (1996) Greenhill, L. J., Gwinn, C. R., Antonucci, R. R. J., & Barvainis, R. 1996, ApJ, 472, 21
- Helou et al. (1991) Helou, G., Madore, B. F., Schmitz, M., Bicay, M. D., Wu, X., & Bennett, J. 1991, in Databases and On-Line Data in Astronomy, ed. D. Egret & M. Albrecht (Dordrecht Kluwer), 89 (NED)
- (25) Ho, L. C., Filippenko, A. V., & Sargent, W. L. 1997a, ApJ, 487, 568
- (26) Ho, L. C., Filippenko, A. V., Sargent, W. L., & Peng, C.Y. 1997b, ApJS, 112, 391
- Keel (1980) Keel, W. C. 1980, AJ, 85, 198
- Kukula et al. (1995) Kukula, M. J., Pedlar, A., Baum, S. A., & O’Dea, C. P. 1995, MNRAS, 276, 1262
- Lauberts (1982) Lauberts, A. 1982, The ESO/Uppsala Survey of the ESO(B) Atlas, European Southern Observatory (ESO)
- Lawrence & Elvis (1982) Lawrence, A., & Elvis, M. 1982, ApJ, 256, 410
- Lavalley et al. (1992) Lavalley, M., Isobe, T., & Feigelson, E. 1992, in Astronomical Data Analysis Software and Systems I, A.S.P. Conference Series Vol. 25, ed. Worrall, D., Biemesderfer, C., & Barnes, J., 245
- Liszt & Dickey (1995) Liszt, H. S., & Dickey, J. M. 1995, AJ, 110, 998
- MacKenty (1990) MacKenty, J. W. 1990, ApJS, 72, 231
- Maiolino & Rieke (1995) Maiolino, R., & Rieke, G. H. 1995, ApJ, 454, 95
- Mazzarella et al. (1988) Mazzarella, J. M., Gaume, R. A., Aller, H. D., & Hughes, P. A. 1988, ApJ, 333, 168
- Mazzarella et al. (1991) Mazzarella, J. M., Gaume, R. A., Soifer, B. T., Graham, J. R., Neugebauer, G., & Matthews, K. 1991, AJ, 102, 1241
- Miyaji et al. (1992) Miyaji, T., Wilson, A. S., & Pérez-Fournon, I. 1992, ApJ, 385, 137
- Morris et al. (1985) Morris, S., Ward, M., Whittle, M., Wilson, A. S., & Taylor, K. 1985, MNRAS, 216, 193
- (39) Mulchaey, J. S., Wilson, A. S., & Tsvetanov, Z. 1996, ApJS, 102, 309 (MWZ)
- Mundell et al. (1995) Mundell, C. G., Pedlar, A., Axon, D. J., Meaburn, J., & Unger, S. W. 1995, MNRAS, 277, 641
- Nagar et al. (1998) Nagar, N. M., Wilson, A. S., Mulchaey, J. S., & Gallimore, J. F. 1999, ApJS, in press (Paper VIII)
- Neff & de Bruyn (1983) Neff, S. G., & de Bruyn, A. G. 1983, A&A, 128, 318
- Neff & Ulvestad (1988) Neff, S. G., & Ulvestad, J. S. 1988, AJ, 96, 841
- Nilson (1973) Nilson, P. 1973, Uppsala General Catalogue of Galaxies, Royal Society of Sciences of Uppsala (UGC)
- Oke & Lauer (1979) Oke, J. B., & Lauer, T. R. 1979, ApJ, 230, 360
- Ondrechen & van der Hulst (1989) Ondrechen, M. P., & van der Hulst, J. M., ApJ, 1989, 342, 29
- Osterbrock & Shaw (1988) Osterbrock, D. E., & Shaw, R. A. 1988, ApJ, 327, 89
- Paturel et al. (1997) Paturel, G., et al. 1997, A&AS, 124, 109 (LEDA)
- (49) Paturel, G., & Petit, C., private communication to LEDA
- Pedlar et al. (1992) Pedlar, A., Howley, P., Axon, D. J., & Unger, S. W. 1992, MNRAS, 259, 369
- Phillips et al. (1983) Phillips, M. M., Baldwin, J. A., & Atwood, B. 1983, ApJ, 274, 558
- Pringle (1993) Pringle, J. E. 1993, in Astrophysical Jets, STScI Symposium Series Nr. 6, ed. D. Burgarella, M. Livio, & C. P. O’Dea (Cambridge University Press), 1
- Pringle (1997) Pringle, J. E. 1997, MNRAS, 292, 136
- Sanders et al. (1987) Sanders, D. B., Young, J. S., Scoville, N. Z., Soifer, B. T., & Danielson, G. E. 1987, ApJ, 312, L5
- Sandqvist et al. (1995) Sandqvist, A., Joersaeter, S., & Lindblad, P. O. 1995, A&A, 295, 585
- Schmitt & Kinney (1996) Schmitt, H. & Kinney, A. L. 1996, ApJ, 463, 498
- Schmitt et al. (1997) Schmitt, H. R., Kinney, A. L., Storchi-Bergmann, T., & Antonucci, R. 1997, ApJ, 477, 623, and Erratum ApJ, 485, 434 (S97)
- Schommer et al. (1988) Schommer, R. A., Caldwell, N., Wilson, A. S., Baldwin, J. A., Phillips, M. M., Williams, T. B., & Turtle, A. J. 1988, ApJ, 324, 154
- Simpkin et al. (1987) Simpkin, S. M., van Gorkom, J., Hibbard, J., & Hong-Jun, S. 1987, Science, 235, 1367
- Sopp & Alexander (1991) Sopp, H. M., & Alexander, P. 1991, MNRAS, 251, 112
- Takase & Miyauchi-Isobe (1987) Takase, B., & Miyauchi-Isobe, N. 1987, Ann. Tokyo Astron. Obs., 21, 251
- Thompson & Martin (1988) Thompson, I. B., & Martin, P. G. 1988, ApJ, 330, 121
- Ulvestad (1986) Ulvestad, J. S. 1986, ApJ, 310, 136
- Ulvestad et al. (1998) Ulvestad, J. S., Roy, A. L., Colbert, E. J. M., & Wilson, A. S. 1998, ApJ, in press
- (65) Ulvestad, J. S., & Wilson, A. S. 1984a, ApJ, 278, 544 (Paper V)
- (66) Ulvestad, J. S., & Wilson, A. S. 1984b, ApJ, 285, 439 (Paper VI)
- Ulvestad & Wilson (1986) Ulvestad, J. S., & Wilson, A. S. 1986, MNRAS, 218, 711
- (68) Ulvestad, J. S., & Wilson, A. S. 1989, ApJ, 343, 659 (Paper VII)
- Ulvestad et al. (1997) Ulvestad, J. S., Wrobel, J. M., & Carilli, C. L. 1997, in Radio Emission from Galactic and Extragalactic Compact Sources, IAU Colloquium 164, in press
- Ulvestad et al. (1998) Ulvestad, J. S., Wrobel, J. M., & Carilli, C. L. 1998, ApJ, submitted
- Unger et al. (1987) Unger, S. W., Lawrence, A., Wilson, A. S., Elvis, M., & Wright, A. E. 1987, MNRAS, 228, 521
- Whittle (1992) Whittle, M. 1992, ApJS, 79, 49
- Wilson (1996) Wilson, A. S. 1996, in Barred Galaxies and Circumnuclear Activity, Nobel Symposium 98, ed. Aa. Sandqvist & P. O. Lindblad (Springer), 201
- Wilson (1997) Wilson, A. S. 1997, in Emission Lines in Active Galaxies: New Methods and Techniques, ASP Conference Series Vol. 113, ed. B. M. Peterson, F-Z Cheng & A. S. Wilson, 264
- Wilson & Baldwin (1985) Wilson, A. S., & Baldwin, J. 1985, ApJ, 289, 124
- Wilson & Ulvestad (1987) Wilson, A. S., & Ulvestad, J. S. 1987, ApJ, 319, 105
- Wilson & Willis (1980) Wilson, A. S., & Willis, A. G. 1980, ApJ, 240, 429
- Winkler (1992) Winkler, H. 1992, MNRAS, 257, 677
![[Uncaptioned image]](/html/astro-ph/9901214/assets/x20.png)
![[Uncaptioned image]](/html/astro-ph/9901214/assets/x21.png)
![[Uncaptioned image]](/html/astro-ph/9901214/assets/x22.png)
![[Uncaptioned image]](/html/astro-ph/9901214/assets/x23.png)