1 Introduction.
The QSO 3C 345 (=16, =0.595) is a core-dominated radio source that displays apparent superluminal motions, with components traveling in the parsec-scale jet along curved trajectories and speeds up to 10 [Zensus et al. (1995)]. We have observed this QSO with the very long baseline interferometry (VLBI) technique using the NRAO Very Long Baseline Array (VLBA) at three epochs and four frequencies, in order to monitor it in total and linear polarization intensity.
2 Observations and Imaging.
We observed 3C 345 in 1995.84, 1996.41, and 1996.81, using the VLBA at 22, 15, 8.4, and 5 GHz, and recording with a 16 MHz bandwidth at all frequencies. At each frequency, the source was observed for about 14 hrs, using 5-minute scans and interleaving all observing frequencies. Some calibrator scans (on 3C 279, 3C 84, NRAO 91, OQ 208 and 3C 286) were inserted during the observations.
Total Intensity.
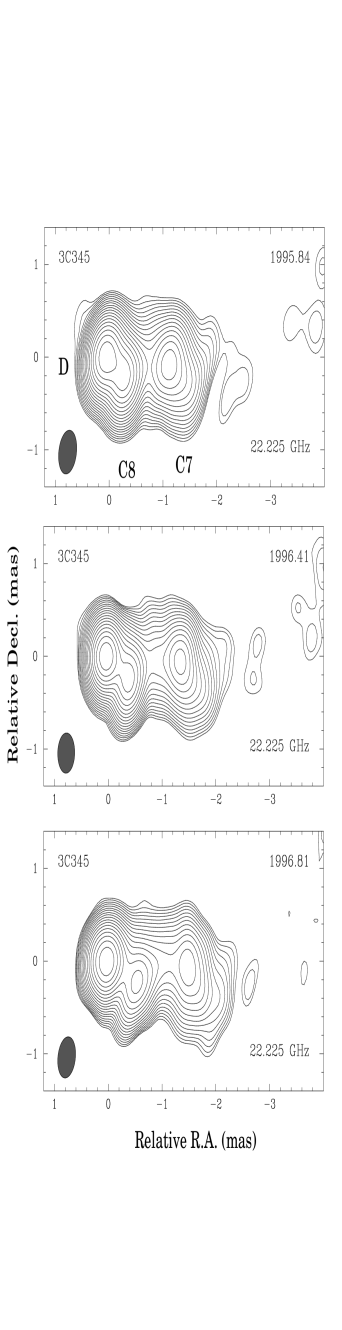
After the fringe-fitting process, we exported the data into the differential mapping program DIFMAP [Shepherd et al. (1994)], and we obtained total intensity images using the hybrid mapping technique. The components C7 and C8 can be identified close to the core D, in the images at higher frequencies. At the lower frequencies, the jet extends to the NW direction, turning to the N at 20 mas distances from the core. In Fig. 1, we show the central region of the source at 22 GHz for the three sampled epochs.
To describe the structures observed within 3 mas distance from the core, we fit elliptical components with Gaussian brightness profiles to the visibility data at 15 and 22 GHz. The change measured in the fitted positions for the component C8 indicates that the component was moving away from the core, at an angular speed of 0.260.08 mas/yr at 22 GHz, which corresponds to an apparent speed of 5.11.8 (assuming =100 km s-1 Mpc-1 and =0.5). The trajectory of C7 at the same frequency shows a proper motion of 0.290.08 mas/yr, or apparent speed of 5.71.8. At 15 GHz the respective values are C8: mas/yr () and C7: mas/yr ().
Polarized Intensity.
Since the early works of Cotton et al. Cotton et al. (1984) up to now, important progress has been made in polarimetric VLBI observations. The VLBA has standardized feeds with low instrumental polarization, and the relatively small size of the antennas is compensated by the excellent performance of the receivers. In addition, a new method for self-calibrating the polarimetric data has been introduced Leppänen et al. (1995), enabling D-term determination by using the program source itself. Using this method, we have calibrated the instrumental polarization, determining the feed solutions for the receivers of all the antennas. This has allowed us to obtain maps of the linearly polarized emission from the source (, where and are the Stokes parameters, is the polarized intensity, is the fractional linear polarization, and is the position angle of the electric vector in the sky). In Fig. 2, we show a composition of the total intensity (grey scale), the polarized intensity (contours) and the electric vector orientation angle (segments, length proportional to p) for the 22 GHz observations in 1995.84.
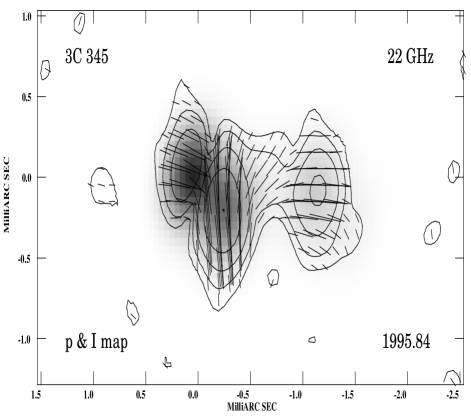
In Fig. 2 the electric vector is aligned with the extremely curved jet direction at the inner 3 mas both for the core and the C7 component. The component C8 is boosted in polarized emission, showing an electric vector apparently perpendicular to this jet direction. Gómez et al. Gómez et al. (1994a, b) have modeled features similar to the ones presented here. They reported anticorrelation between the polarized and the total intensity flux close to a shock wave along a jet in its early evolution (near to the core). We should point out that the possible superposition between components with different electric vector orientations can lead to a cancellation of flux and produce apparent separations between polarized emission components. The brighter polarized emission in C8 might be explained by a shock wave in a curved jet geometry. More generally, the features of Fig. 2 can be explained in terms of a comprehensive shock model Wardle et al. (1994) in the framework of a helical geometry for the motion of the components Steffen et al. (1995).
3 Conclusions.
We have monitored the superluminal QSO 3C 345 at three epochs within one year, observing with the VLBA at four frequencies. We have presented some results of these studies at the higher frequencies, showing the superluminal motions of components C8 and C7 with respect to the core component D, and the remarkably complex polarization structure near the core, which provides evidence for emerging components and changing projected jet direction within 3 mas from the core. The twist in the orientation of the electric vector along the jet can be explained in terms of an extremely curved helical geometry, following Steffen et al. Steffen et al. (1995). The electric field is parallel to the jet direction, and the boosting in the polarized emission at the component C8 and the change in the vector orientation can be the result of the presence of a shock wave in a bent jet.
References
- Cotton et al. (1984) Cotton, W.D., Geldzahler, B.J., Marcaide, J.M., Shapiro, I.I., Sanromà, M., Rius, A. (1984), ApJ, 286, 503
- Gómez et al. (1994a) Gómez, J.L., Alberdi, A., Marcaide, J.M. (1994a), A&A, 284, 51
- Gómez et al. (1994b) Gómez, J.L., Alberdi, A., Marcaide, J.M., Marscher, A.P., Travis, J.P. (1994b), A&A, 292, 33
- Leppänen et al. (1995) Leppänen, K.J., Zensus, J.A., Diamond, P.J. (1995), AJ, 110, 2479
- Shepherd et al. (1994) Shepherd, M.C., Pearson, T.J., Taylor, G.B. (1994), BAAS, 26, 987
- Steffen et al. (1995) Steffen, W., Zensus, J.A., Krichbaum, T.P., Witzel, A., Qian, S.J. (1995), A&A 302, 335
- Wardle et al. (1994) Wardle, J.F.C., Cawthorne, T.V., Roberts, D.H., Brown, L.F. (1994), ApJ, 437, 122
- Zensus et al. (1995) Zensus, J.A., Cohen, M.H., Unwin, S.C. (1995), AJ, 443, 35