The Cosmic Ray Proton Spectrum
determined with the
Imaging Atmospheric Cherenkov-Technique
Abstract
The HEGRA system of 4 Imaging Atmospheric Cherenkov Telescopes (IACTs) has been used to determine the flux and the spectrum of cosmic ray protons over a limited energy range around 1.5 TeV. Although the IACT system is designed for the detection of -rays with energies above 500 GeV, it has also a large detection area of 106 m2 3 msr for primary protons of energies above 1 TeV and the capability to reconstruct the primary proton energy with a reasonable accuracy E/E of 50% near this threshold. Furthermore, the principle of stereoscopic detection of air showers permits the effective suppression of air showers induced by heavier primaries already on the trigger level, and in addition on the software level by analysis of the stereoscopic images. The combination of both capabilities permits a determination of the proton spectrum almost independently of the cosmic ray chemical composition. The accuracy of our estimate of the spectral index at 1.5 TeV is limited by systematic uncertainties and is comparable to the accuracy achieved with recent balloon and space borne experiments. In this paper we describe in detail the analysis tools, namely the detailed Monte Carlo simulation, the analysis procedure and the results. We determine the local (i.e. in the range of 1.5 to 3 TeV) differential spectral index to be and obtain an integral flux above 1.5 TeV of s sr m2.
pacs:
96.40, 95.85.S, 98.70.SI Introduction
The stereoscopic system of Imaging Atmospheric Cherenkov telescopes (IACT-system) of the HEGRA collaboration [1] is a powerful tool for detecting TeV -ray sources and for performing detailed spectroscopic studies in the energy range from 500 GeV to 50 TeV, where the latter limit is determined by event statistics alone. With the nearly background-free detection of -rays from the Crab Nebula [1], an energy flux sensitivity of 10-11 ergs/cm2 s at 1 TeV for one hour of observation time has been estimated. The high signal to noise ratio together with the energy resolution of better than 20% for primary photons makes it possible to study the spectra of strong sources on time scales of one hour, as demonstrated by the observation of the BL Lac object Mkn 501 during its 1997 state of high and variable emission [2].
The IACT system can not only be used for -ray astronomy. It can also contribute to the study of charged cosmic rays (CR) for energies between a few TeV and possibly 100 TeV, a key energy region for the understanding of the sources of CRs and their propagation through our galaxy (see e. g. [3, 4] and references therein for reviews).
The measurement with the IACT system described in this paper has systematic uncertainties comparable to recent measurements of satellite and balloon borne experiments (see e. g. [5] for a recent compilation). A clear advantage of the IACT technique is the large effective area of 3103 m2 sr for TeV cosmic rays combined with a field of view of 3 msr, corresponding to a detection rate of around 12 Hz for 1 TeV cosmic rays.
In an earlier paper [6] we explored the possibilities to use the IACT technique to measure the energy spectra and mass composition of CRs and especially CR protons. The stereoscopic observation of air showers with at least two IACTs suppresses heavier primaries already on the trigger level. This is because the energy threshold Ethr, defined as the energy where the differential detection rate peaks, increases substantially with the nucleon number , approximately as E . The stereoscopic detection of the air shower under different viewing angles with high resolution imaging cameras permits us to unambiguously reconstruct the air shower axis in three dimensions. Knowing the location of the shower core with a precision of 30 m, the energy of a primary proton can be determined with an accuracy of 50% and the different projections of the longitudinal and lateral shower development can be used to obtain an event sample enriched with particles of a certain primary species. The net effect of the trigger scheme and of the software cuts is a suppression of heavier nuclei by a factor larger than 10 at TeV energies. This makes the extraction of an almost pure proton data sample possible and permits the determination of its energy spectrum, at least in a narrow range around 1.5 TeV. Even a rather limited knowledge of the CR chemical composition significantly extends this dynamical range.
In this paper we give a detailed description of the principles underlying a proton measurement. Then we apply the method to data from the HEGRA experiment, that automatically accumulates CR air shower data in the form of background events during -ray observations. The HEGRA experiment is introduced in Section II, the analysis tools are described in Section III and the results and the systematic errors are presented in Section IV. Section V discusses the results. This paper is based on the results of the PhD thesis [7].
II The HEGRA IACT-System
The HEGRA experiment, located on the Canary Island La Palma at the Observatorio del Roque de los Muchachos (2200 m a.s.l., 28.75∘ N, 17.89∘ W), is a large detector complex dedicated to the study of cosmic rays and -ray astronomy [8]. In particular, the HEGRA collaboration operates two air shower arrays on a surface of m2. The first one is an array of 243 scintillation detectors of one square meter area each [9] which samples the particle cascade reaching the observation level. The other one is the AIROBICC array of 97 wide angle Cherenkov counters [10] which samples the atmospheric Cherenkov photons emitted by the particle cascade. Apart from -ray astronomy in the energy range above 15 TeV, the arrays are used to measure the all particle spectrum and the chemical composition in the energy range above 200 TeV [11, 12]. The third element in operation is the stereoscopic IACT system together with two IACTs observing in single telescope mode. One of these telescopes has very recently been incorporated into the stereoscopic system. Here we concentrate on results obtained by the IACT system.
At the time when the data used in this analysis were taken, the stereoscopic IACT-System consisted of 4 telescopes with 8.5 m2 mirror area each. Each telescope is equipped with a 271 pixel camera, covering a field of view of 4.3∘. The pixel size is 0.25∘. The cameras are readout by an 8 bit 120 MHz Flash-ADC system.
The telescope system uses a multi level trigger scheme [13]. A coincidence of two neighboring pixels above a given threshold triggers an individual telescope. This trigger condition is called hereafter, where NN denotes the next-neighbour condition and is the threshold in units of registered photoelectrons. A coincidence of at least two telescopes (named hereafter 2/M-telescope multiplicity, with M=4) triggers the telescope system and results in the readout of the buffered FADC information of all telescopes.
An absolute calibration of the system has been performed with a laser measurement and a calibrated low-power photon detector [14]. This measurement has determined the conversion factor from photons to FADC counts with an accuracy of 12%. The error on the energy scale is estimated to be 15% which derives from the uncertainty in the conversion factor from Cherenkov photon counts to FADC counts, and from the uncertainty in the atmospheric absorption.
To obtain the data used in the following analysis, the photomultipliers are operated in a regime where saturation effects due to space charges are smaller than 10%, for less than 400 photoelectrons per pixel. A total amplitude of the image, the Size, of 400 photoelectrons represents an energy of protons of around 15 TeV.
III Analysis Tools
A Monte Carlo Simulations
The CR-induced extensive air showers have been simulated with the ALTAI code [15, 16, 17]. The simulation of the electromagnetic shower development models the elementary processes of bremsstrahlung, ionization losses and Coulomb scattering of charged particles as well as pair production and Compton scattering of photons. The effect of multiple scattering of the charged particles is simulated with a fast semi-analytical algorithm which computes the probability distributions of the lateral and angular distributions of charged particles in a given volume in space. The simulation of the hadron component is based on accelerator data of - and -interactions using, where necessary, extrapolations of the cross sections to TeV energies. The code uses a modified version of the radial-scaling model [18]. Taking into account the probability coefficients for the different fragmentation channels, the model of independent nucleon interactions was used to describe the fragmentation of the nuclear projectile.
In order to study the model dependence of the observable parameters, a second air shower library was generated, using the CORSIKA code (Version 4.50) [19, 20] to simulate the hadronic interactions of the air shower cascade. CORSIKA offers several interaction models. High energy interactions ( GeV) were simulated with the HDPM (‘hadronic interactions inspired by the Dual Parton Model’) [21]. Low energy interactions ( GeV) were modeled with the GHEISHA code (‘Gamma Hadron Electron Interaction Shower Algorithm’). HDPM is known to describe, also for heavier primary particles, reasonably well the available accelerator data in the energy region relevant here ( eV). Instead of EGS our variant of CORSIKA uses the ALTAI code to model the electromagnetic shower development.
A first comparison of the essential characteristics was performed using showers of vertical incidence, simulated both with the ALTAI and the CORSIKA hadronic interaction models in an energy range of 0.3 to 50 TeV and a distance scale of 250 m to the central telescope of the system. The construction of an energy spectrum relies on the determination of the effective areas. In Figure 1 the effective areas for proton- and helium-induced showers, as computed with the two interaction models, are compared with each other. The difference between the two models is smaller than 10% over the full energy range. Although completely different interaction models have been used, the agreement is excellent. Predicted HEGRA detection rates have been computed, weighting the individual showers according to the chemical composition of the nuclei as known from the literature ([22], see Table I). The predictions of both models, summarized in Table II, are in very good agreement.
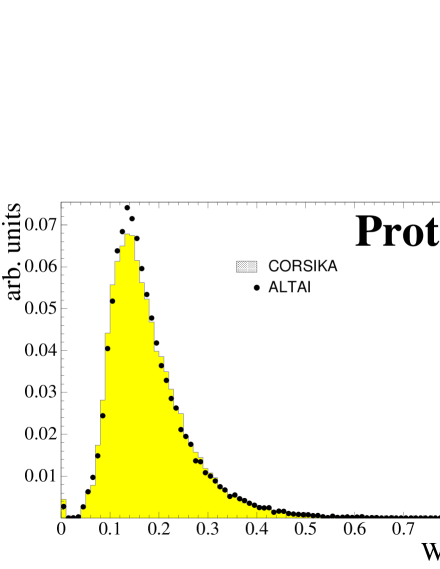
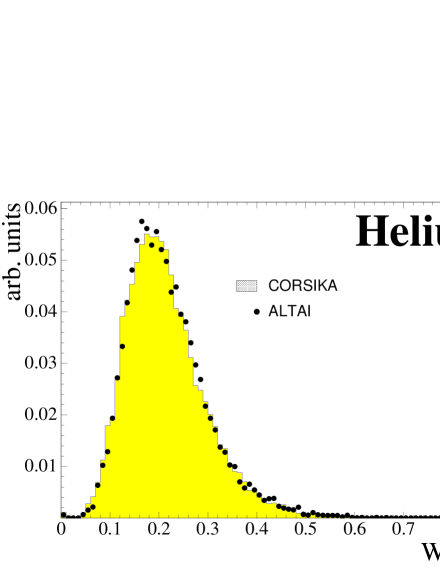
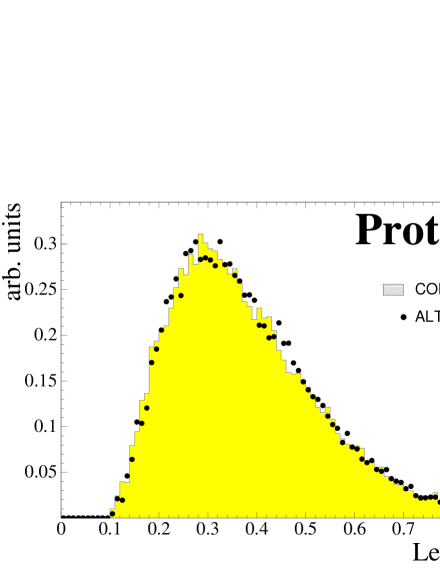
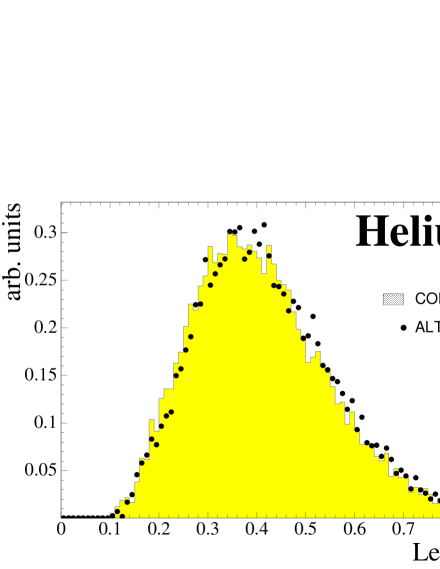
To characterize the telescope images, a 2nd-moment analysis is used to derive the standard Hillas parameters [23], i.e. the Width-parameter which reflects the lateral development of the air shower, and the Length-parameter which is related to the longitudinal shower development. Figure 2 compares the Width and Length parameter distribution as derived with the two interaction models for proton- and helium-induced air showers. The agreement is good.
In the following a set of CORSIKA generated showers in the energy and distance range given above is used to analyze the data, comprising simulations for air showers induced by proton and helium as well as by light and medium nuclei (with mass numbers 6 to 19, in the following abbreviated with LM), and finally by heavy and very heavy nuclei (with mass numbers 20 to 56, abbreviated as HVH). For the LM- and HVH-groups the atomic numbers of the primary nuclei were randomly distributed inside the group.
In addition to vertical proton-showers, proton showers incident under 20∘ zenith angles were simulated in order to interpolate the effective area for . The effective area varies in this range only weakly according to the expected -dependence.
After the air shower simulation, the showers are processed with a new detector simulation of the HEGRA-System of IACTs. This improved detector simulation includes a full detector simulation, taking into account Cherenkov photon losses due to atmospheric absorption and scattering and due to the telescope mirror, the mirror geometry and the arrival times of the Cherenkov photons, the photomultiplier (PM) response and the characteristics of the electronic chain to derive the trigger decision and the digitized signal. The new simulations permit an identical treatment of Monte Carlo simulated showers and real data. A detailed description can be found in [7].
B Proton Enrichment of the Data Sample
The proton component can effectively be separated from heavier cosmic rays over the energy range from 1 to more than 10 TeV [6]. The suppression of heavier CRs is based on the following air shower characteristics: At a given energy, showers induced by heavier nuclei develop at substantially greater heights in the atmosphere since the cross section for an inelastic hadronic interaction of a primary of nucleon number with the air nuclei increases wit : to first order approximation, is given by , with being the geometric cross section, , and . In addition, the ratio of transverse momentum to total momentum in the first interaction increases with increasing nucleon number. Also, the momentum of the primary is for heavy primaries shared among several nucleons and the typical transverse momentum generated in interactions is fixed, leading to a larger lateral extension of showers induced by heavy particles. Furthermore, the fraction of energy channeled into electromagnetic subshowers, responsible for the emission of Cherenkov photons, decreases with increasing nucleon number [12]. The combination of all these effects results in a larger but less intensive Cherenkov light pool, increasing the threshold energy of heavier particles.
A first suppression of the heavier nuclei occurs on the trigger level. Figure 3 shows the detection rates for different particles, assuming for all nuclei a differential spectrum . As can be seen, at 1.5 TeV, the energy threshold for protons, heavier nuclei are suppressed by more than one order of magnitude.
Note that apparently the suppression of heavier nuclei is best at the trigger threshold. Remarkably a similar suppression occurs de facto also at higher energies by sorting the events into bins according to their reconstructed energies. Since at a given energy heavier particles produce a smaller Cherenkov light density, their energy is estimated (see next section) to be smaller by a factor with for Helium, Oxygen and Iron induced air showers, respectively. In an energy bin centered at the reconstructed energy , protons of the mean true energy are contained, but also heavier particles with the mean true energy E. Since the flux of all primary particles rapidly decreases with increasing energy, to first order approximation according to dF/dE E-2.7, heavier particles are suppressed by a factor . This effect is slightly counterbalanced by a relatively larger effective area for heavier particles at higher energies ( TeV), due to the larger (although less intensive) light pool. Detailed studies of the separation capabilities at higher energies ( TeV) are still under way.
A further important suppression of heavier particles is achieved by an analysis of the stereoscopic IACT images which mirror the longitudinal and lateral shower development, described by the Hillas-parameters [23]. Pixels with a small S/N-ratio are excluded from the analysis, by computing the image parameters only from the so called “picture” and “boundary“ pixels [24]. Picture-pixels are all pixels with an amplitude above the “high tailcut” (here 6 photoelectrons). Boundary pixels are all pixels with an amplitude below the “high tailcut” but above the “low tailcut” (here 3 photoelectrons) which are neighbours of a picture-pixel.
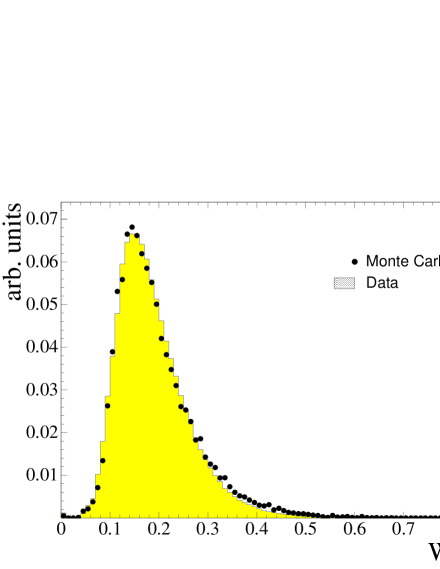
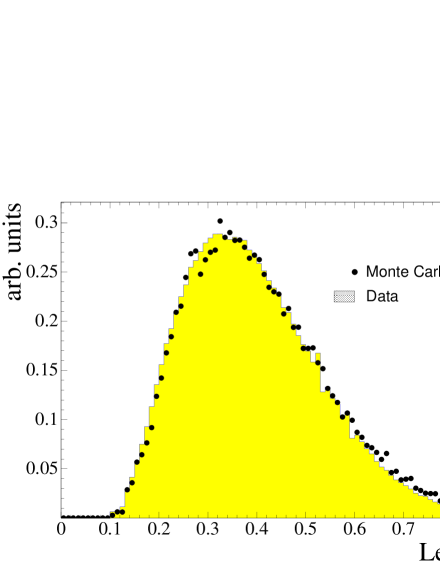
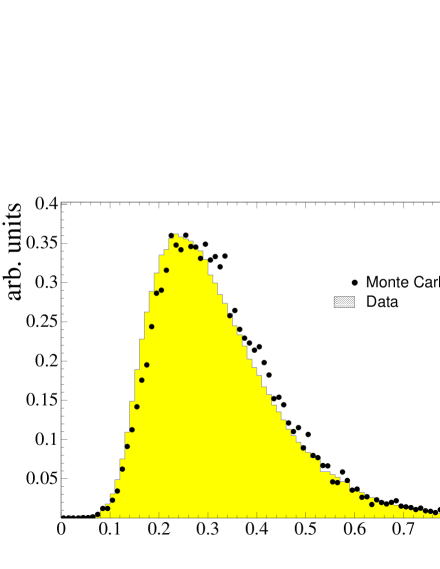
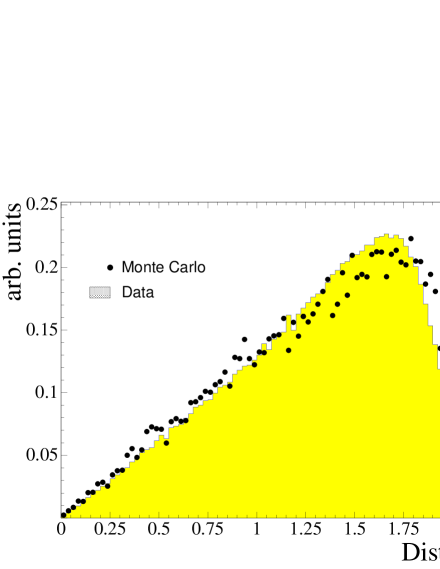
Figure 4 shows the distribution of the most important Hillas parameters for data and for Monte Carlo generated events. Both in the data and the Monte Carlo events, a software threshold has been applied, requiring two or more telescopes with at least two pixels above 10 photoelectrons, and a sum “Size” of at least 40 photoelectrons recorded in the picture and boundary pixels. The Monte Carlo events have been weighted according to the chemical composition from the literature (Table I). The Conc-parameter, measuring the concentration of the amplitude in the image, is defined as the amplitude in the two most prominent pixels divided by the total amplitude in the image. Proton images are more concentrated than images of heavier nuclei. The Distance represents the position of the image centroid in the camera. Since hadronic showers fall in isotropic, the Distance distribution should rise linearly until it is cut by the edge of the camera. The agreement between Monte Carlo and data image parameter distributions in Figure 4 is very good.
Note that, since heavier particles are suppressed already on the trigger level, the distributions in Figure 4 depend only slightly on the assumed chemical composition. In future work we will try to use these small differences to determine the CR chemical composition.
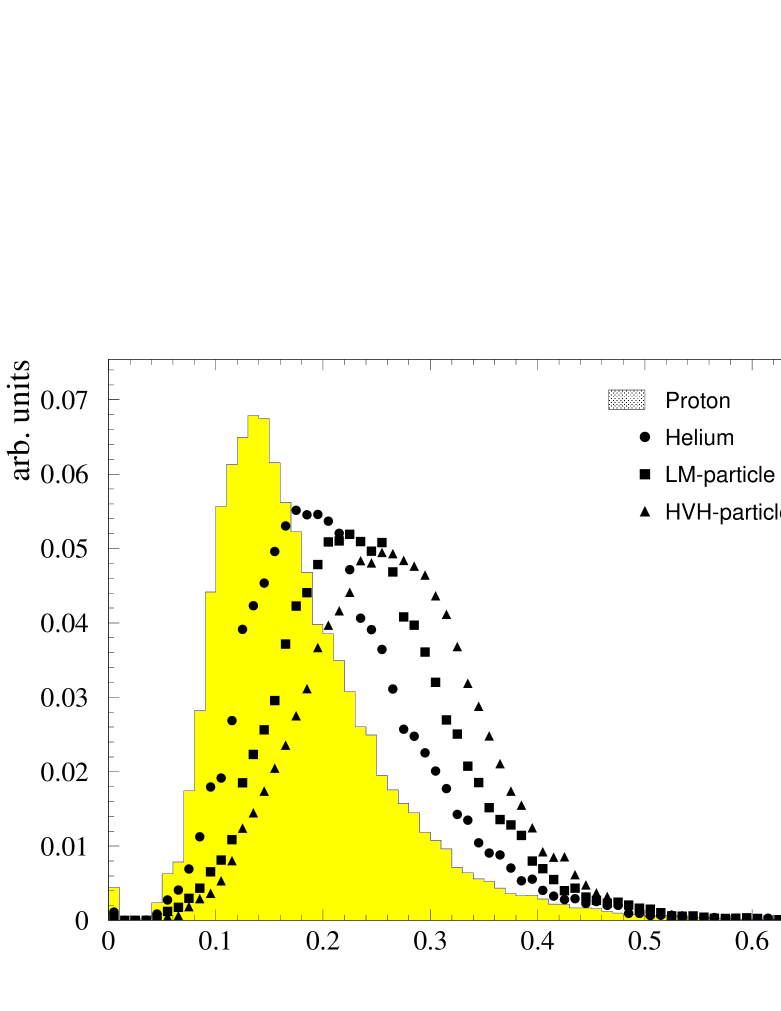
As outlined already in [6] and as seen in Figure 2, the Width parameter, reflecting the lateral extent of the air shower, is sensitive to the relatively larger transverse momentum in showers induced by heavier particles and can therefore be used to extract a data sample enriched with primaries of a certain species. Figure 5 shows the distributions of the Width-parameter for the different particle groups. The heavier the primary particle, the larger is the Width parameter.
In the following the parameter mean scaled width, introduced in [26] and first applied successfully to -ray data in [1], is used. For each telescope the Width-value is normalized to the value expected for a proton shower given the sum of photoelectrons of the image, Sizei, and the distance of the shower core from the telescope. The values obtained from the triggered telescopes are combined to the quantity
| (1) |
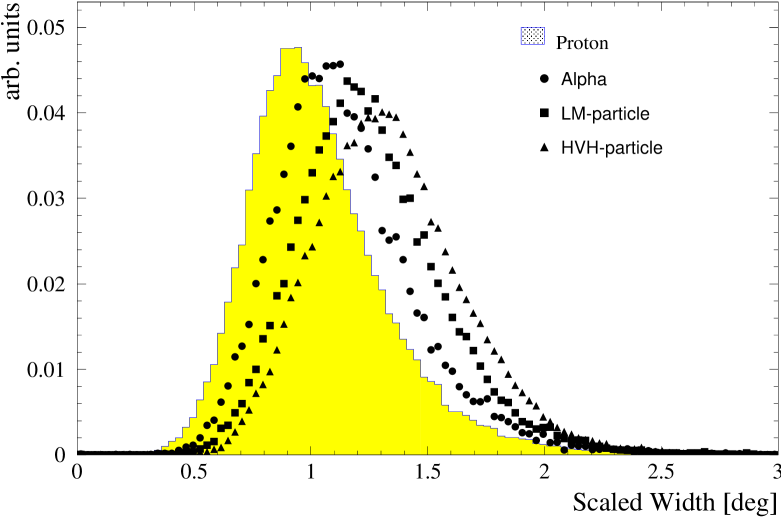
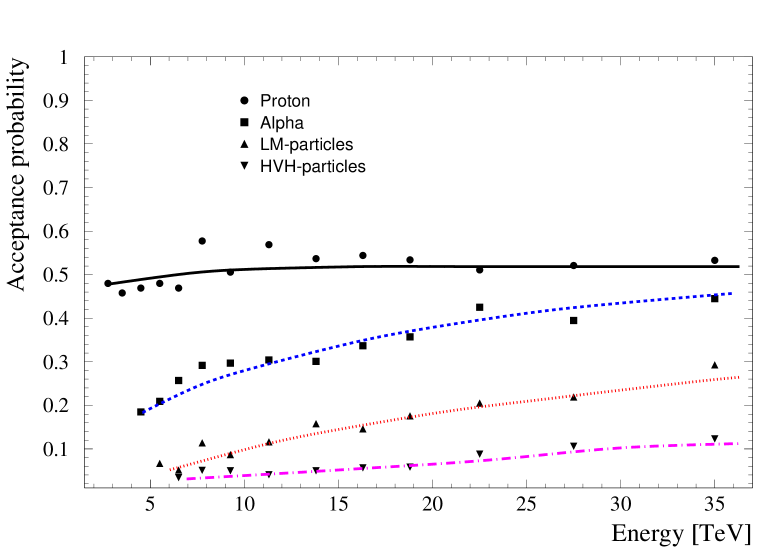
Figure 6 shows the distribution of the -parameter for the different groups of primaries (assuming a chemical composition as given in Table I). The -parameter, taking into account the distance and amplitude dependence of the image width, allows one to enhance proton induced showers among showers induced by all particles. The acceptances of the different cuts are shown in Table III. A cut in Widthscal 0.85, for example, accepts % of the primary protons, but only 20% of the primary helium, and 10% of the heavier nuclei. The main advantage of scaling the Width-parameter consists in energy independent cut efficiencies for proton-induced air showers and almost energy independent cut efficiencies for the heavier primaries, as shown in Figure 7. Since the image widths of proton-induced showers and showers induced by heavier particles become more similar at higher energies, the acceptance of heavier nuclei increases slightly with their energy.
To summarize, at energies between 1 and 10 TeV the combined effect of suppression of heavier nuclei by the detection principle and by the image analysis enriches the data sample with proton-induced showers by a large factor up to one order of magnitude, depending on the used image shape cuts. In future we shall investigate if additional image parameters can be used to obtain a similar effective suppression also at energies above 10 TeV.
C Energy Determination
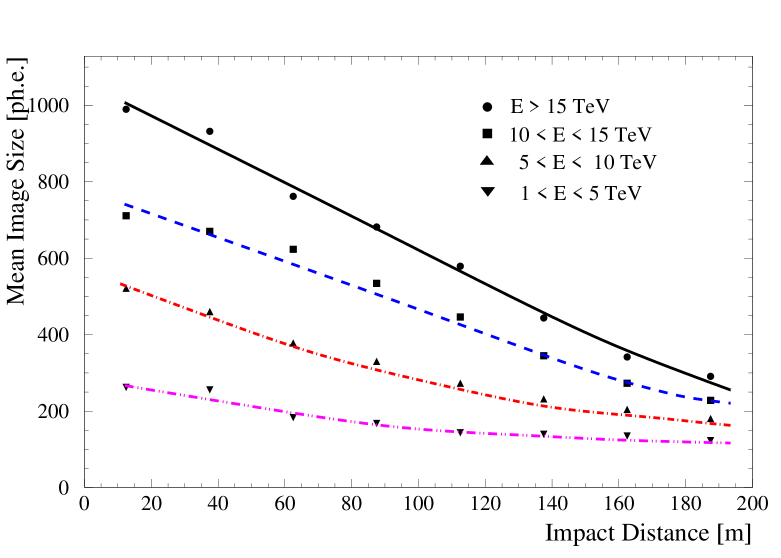
For each triggered telescope, an energy estimate of the primary particle is computed under the hypothesis of the primary particle being a proton, from the image Size, , measured in the th telescope at the distance of the telescope from the shower core. Averaging over all triggered telescopes gives a common energy estimate. The energy estimate is determined by inversion of the relation between primary energy , impact distance and expected image Size , as computed from the Monte Carlo simulations for proton induced showers. For illustration purposes, the function is shown in Figure 8 for 4 broad energy bins. The expected number of photoelectrons decreases with increasing distance from the shower core. The higher the proton’s primary energy is, the more pronounced is the light concentration near the shower axis. More energetic showers penetrate more deeply into the atmosphere. The tails of these showers give rise to the increased light intensity near the shower axis in contrast to the flat light pool of primary photons [27].
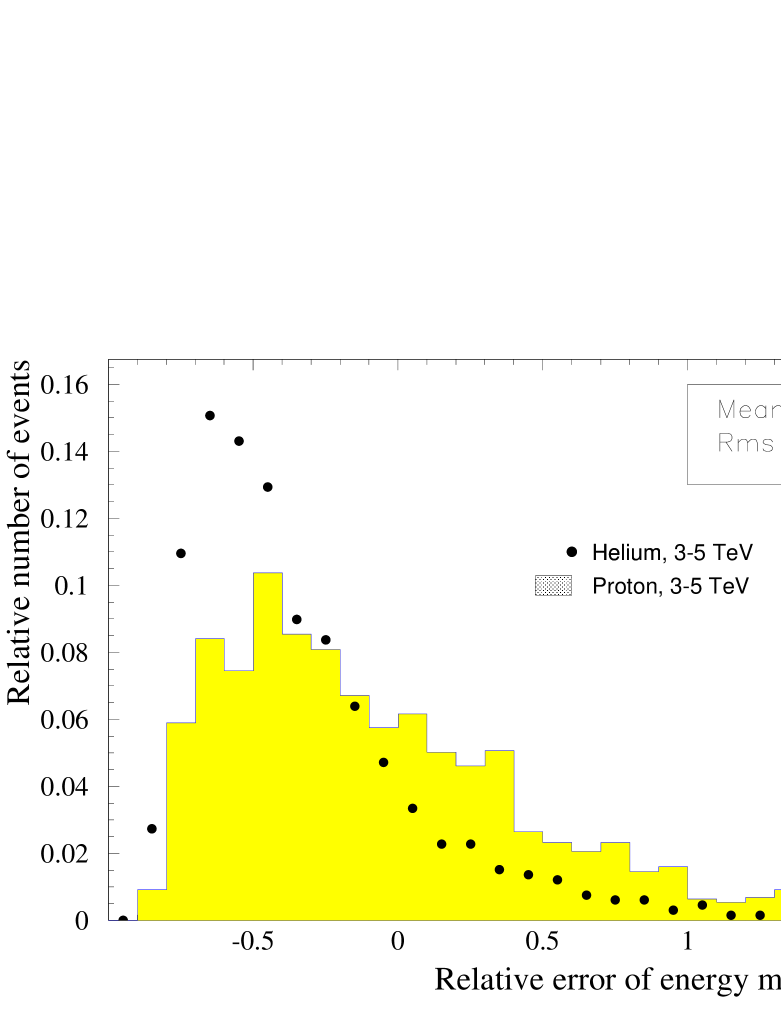
This method leads to an energy resolution of 50% for primary protons, as shown in Figure 9 for proton induced showers. The energy resolution is determined by the accuracy of the shower core reconstruction of m and by the variations of the image size (which is a function of and ). Cores which are reconstructed too far away from the telescopes are partly responsible for the long tail towards large values of . A second cause are the fluctuations of the image size due to fluctuations in the shower development. As shown in Table IV the energy resolution as a function of primary proton energy is rather constant, an important requirement for a robust and reliable deconvolution of the spectrum.
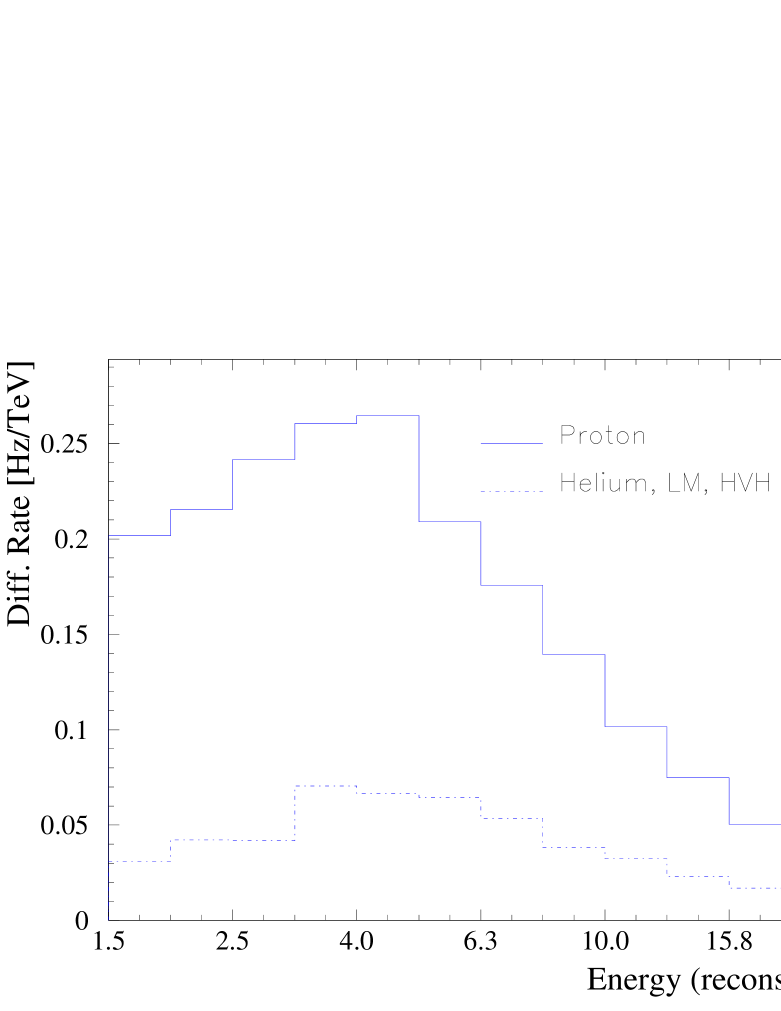
The filled points in Figure 9 show the distribution of for the helium-induced air showers. As mentioned above, showers induced by heavier nuclei produce, in comparison to proton-induced air showers of the same energy, a lower Cherenkov light density at observation level. This effect effectively suppresses, due to the steeply falling spectra of CR primaries, the contamination of certain energy bins with heavier nuclei. In Figure 10 the differential detection rates after the cut Width are shown as a function of the reconstructed energy, assuming the chemical composition from the literature (Table I). As can be seen, even if the helium to proton ratio would exceed the value given in the literature by a factor of 2, the contamination of the data sample by heavier particles is small, i.e. 20%, taking into account also the cut efficiencies as given in Figure 7.
D Method to determine the proton spectrum
The proton spectrum is determined using the standard method of forward folding.
The Monte Carlo events of the particle group are weighted to correspond to a power law for the flux dF/dE E where the and the (except the of the proton component) reflect the chemical composition taken from the literature ([22], see Table I). The fitted parameters are the common scaling parameter and the spectral index of the proton component . These two parameters are varied until the -difference of the observed histogram of reconstructed energies and the corresponding histogram predicted with the weighted Monte Carlo events is minimized. The fit is performed in the range from 1.5 to 3 TeV of the reconstructed energy.
As we have shown in the previous sections, the contamination of the data sample with heavier particles is small, especially in the energy range from 1 to 3 TeV, and therefore the result depends only slightly on their assumed abundances and spectral index. This dependence has been studied in detail and will be discussed in detail below.
Flux estimates at given energies are derived as follows: Knowing the best fit value of the spectral index of the proton component, a correction function is computed from Monte Carlo simulations so that the differential flux of protons at the reconstructed energy E can be computed from the number ni of observed events in the th energy bin by
| (2) |
where is the observation time, is the width of the th energy bin, is the acceptance for protons of the Widthscal-cut, and is the effective area for proton registration. In this ansatz, the effect of the energy resolution and the sample contamination by heavier particles is accounted for by the function which depends, for the reasons mentioned above, only slightly on the assumed chemical composition and on the Widthscal-cut in the energy range of 1.5 to 3 TeV. Eq. 2 can strictly only be used if the proton spectrum indeed follows the power law determined in the forward folding fit. However, since the correction function depends only weakly on the spectral index, the method gives reasonable results, also for spectra which deviate from the power law shape.
IV Results
A Data Set
For the following analysis, the data primarily taken for the observation of Mkn 501 during 1997 have been used. Only runs taken under excellent weather and hardware conditions were accepted. Table V gives a summary of the data set.
The Mkn 501 data set was used because of its large fraction of small zenith angle data. Furthermore, the solid angle region around Mkn 501 does not contain very bright stars which cause excessive additional noise. As a matter of fact, the strong -ray beam from Mkn 501 in 1997 did not only supply informations of astrophysical interest, but made it in addition possible to test the simulation of electromagnetic showers and the simulation of the detector response to these showers with unprecedented statistics (in 1997, 38,000 photons were recorded). The strong -ray beam could easily be excluded from the analysis by rejecting all showers reconstructed within 0.3∘ from the source direction.
Identical cuts were applied to the measured data and the Monte Carlo data. In addition to the cuts already mentioned above, a cut on the distance of the shower axis from the central telescope of 175 m was applied. Only telescopes with a distance smaller than 200 m from the shower axis entered the analysis, suppressing by these means images close to the edge of the camera. We apply a mean scaled width cut of Width, which minimizes, to our present understanding, the systematic uncertainties caused by the contamination of the data sample by heavier particles and by the limited accuracy of the Monte Carlo simulations.
B The proton spectrum
The forward folding method described above gives a best power law fit to the data in the energy range from 1.5 to 3 TeV for:
| (3) |
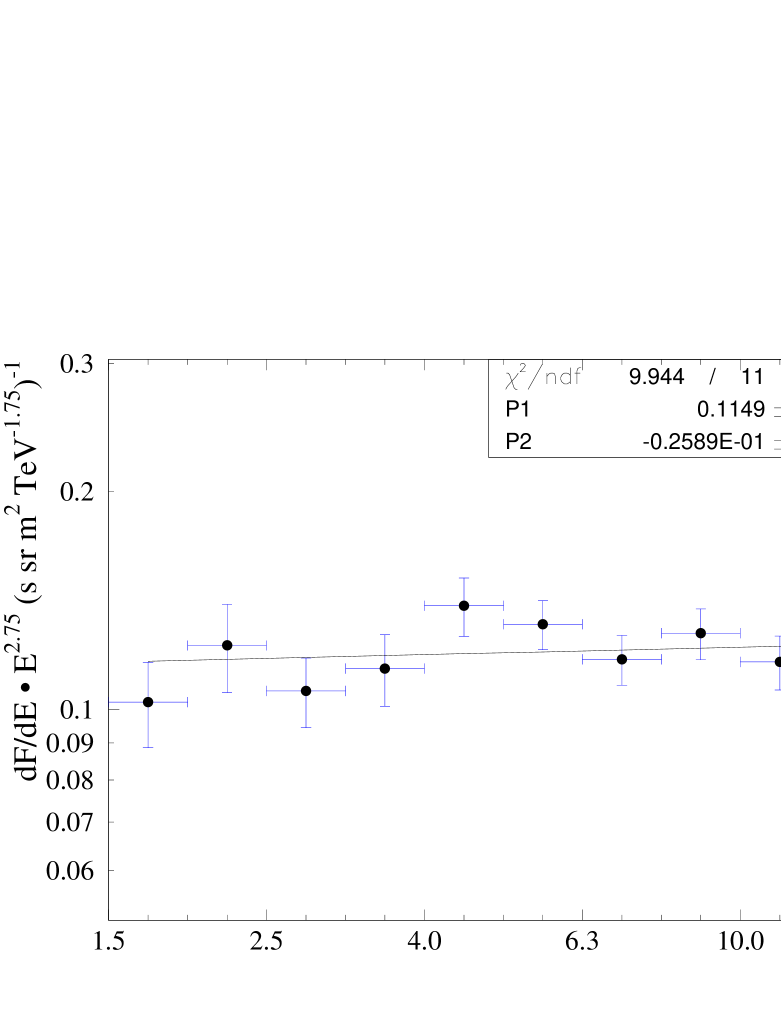
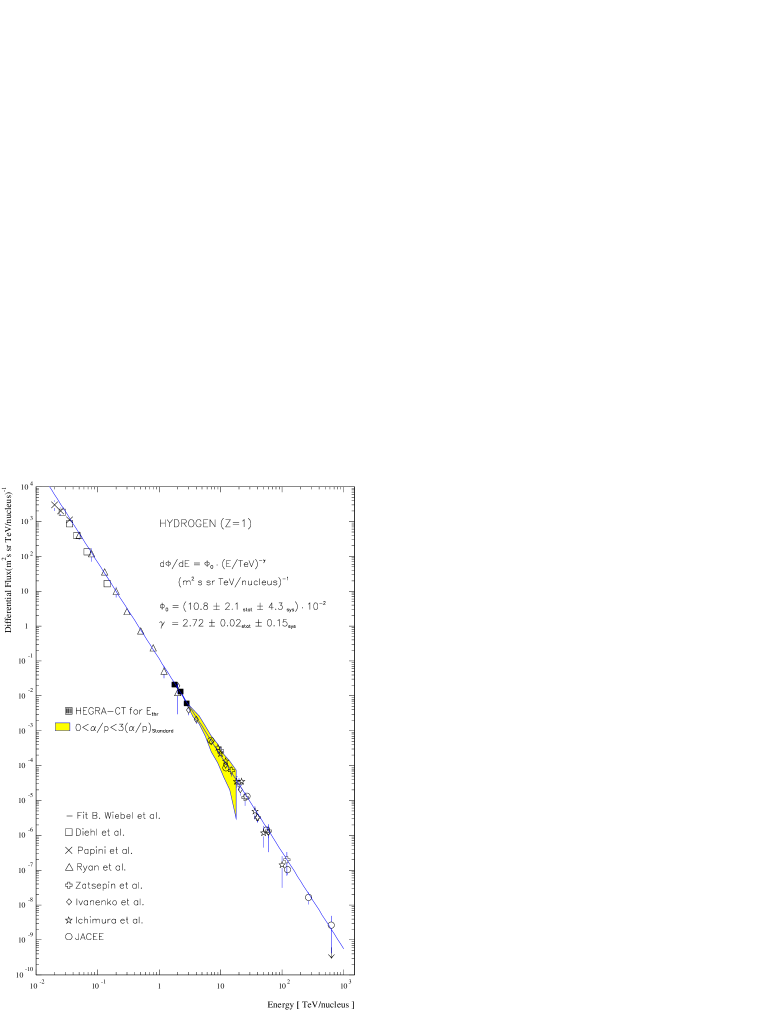
In Figure 11 the differential energy spectrum is shown assuming the chemical composition from Table I. This assumption allows to extend the energy range of our measurement to energies above TeV, as will be explained later. As can be seen, a single power fits the data very well. The systematic error on the spectral index is dominated by the Monte Carlo dependence of the results and by the contamination of the data sample by heavier particles. The systematic error of the absolute flux is affected in addition by an uncertainty in the energy scale of 15%. We obtain an integral flux above 1.5 TeV of s sr m2.
A rough estimate of the systematic errors can be derived by varying the Widthscal-cut. The different cuts lead to a varying percentage of heavier nuclei in the remaining data sample. Table VI summarizes the results for cut-values between 1.15 and 0.65. The derived spectral index varies between 2.68 and 2.76 and the flux amplitude (differential flux at 1 TeV) varies between 0.08 and 0.13 .
We have performed the following studies to estimate the systematic error on the spectral index.
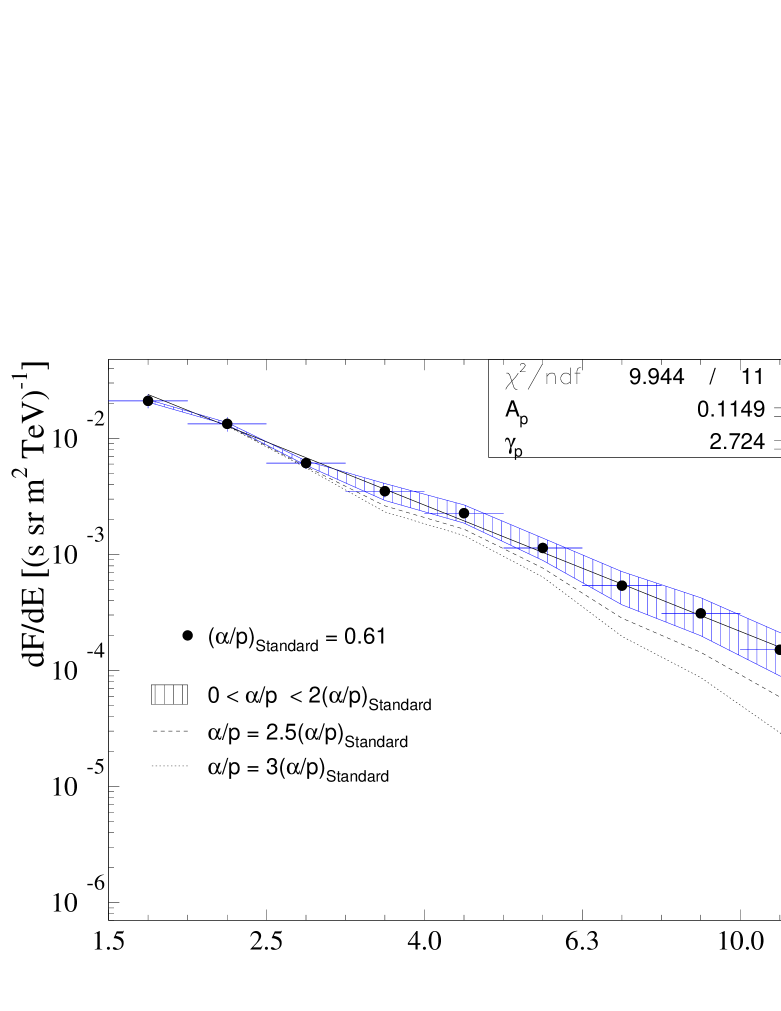
The dependence of the results on the assumed spectrum for helium, LM- and HVH-particles was determined in a Monte Carlo study by varying the assumed abundance of the heavier particles over a wide margin. Setting the assumed flux of one of the groups to zero or increasing it by a factor of 2, yields the proton spectral indices given in Table VII. Since Helium has the lowest HEGRA energy threshold of the heavier elements, the spectral index is most sensitive to the abundance of the Helium component. Setting the assumed Helium flux to zero results in a proton spectral index of 2.79, and doubling it decreases the index to 2.73 from an assumed spectral index of 2.75. (see also Figure 12).
Table VIII compares the measured CR detection rates with the rates predicted by weighting the simulated events with the CR spectra of Table I. The rates are in very good agreement. A much higher relative abundance of the heavier particles than assumed in Table I is therefore not probable. Furthermore, if the Helium abundance would be much larger than assumed here (more than two times the assumed abundance), the image parameter distributions found in the data (see Figure 2 and compare with Figure 4) would not fit anymore the Monte Carlo predictions. Consequently, to our present understanding, the systematic error in the spectral index due to the uncertainty in the chemical composition is already estimated conservatively by varying the relative abundances of the heavier elements by factors between zero and two, and is in the order of 0.05.
Table IX shows the results obtained from experimental data under the extreme hypothesis of a pure CR proton flux as function of the cut in Widthscal. Comparison with Table VI shows, that after applying tight cuts (Width or tighter) the results agree nicely and consequently depend only weakly on the assumed chemical composition.
The dependence of the spectral index on the detector performance and on the atmospheric conditions has been derived as follows. First, the data was divided into 4 parts of equal event statistics, and the analysis was performed for each of the 4 subsamples. Second, the data was divided into 4 seasonal parts and for each group the spectrum was determined. The derived spectral indices are given in Table X. They are constant within .
The dependence of the spectral index on the details of the Monte Carlo simulation (mainly threshold effects), has been examined in the framework of determining the systematic error on -ray spectra measured with the HEGRA IACT system. The studies will be published elsewhere. The uncertainties on the spectral index are currently estimated to be in the order of 0.1. The quadratic sum of these systematic errors (dependence on assumed CR chemical composition 0.05, changing atmospheric and detector conditions 0.05, threshold effects 0.1) gives a total systematic error on the spectral index of 0.15.
Two effects dominate the systematic error on the flux amplitude.
The uncertainty in the energy scale of 15% [2] translates into an uncertainty of 30% in the differential flux at a given energy. The uncertainty of the differential flux in the energy range from 1.5 to 3 TeV from threshold effects is estimated to be 10%, because with increasing energy the slope of the effective area changes only slowly (compare with Figure 1). Note that since the energy threshold for heavier particles (Helium to Iron) is much higher than for protons, the reconstructed proton flux between 1.5 and 3 TeV is essentially independent of the assumed contamination of the data sample by heavier particles. Figure 12 shows the reconstructed proton spectrum varying the Helium flux from zero to 3 times the value from the literature. As can be seen, from 1.5 to 3 TeV, the reconstructed flux is to a good approximation independent of the assumed Helium flux.
The quadratic sum of the systematic errors (energy scale 30%, threshold effects and cut efficiencies 15%) gives a total systematic of 35%.
We also investigated wether broken power law models fit our data in the energy range from 1 to 10 TeV better than single power law spectra. Due to the limited energy resolution of = 50% for proton induced showers we would be able to detect a break in the 1 to 10 TeV spectrum only for changes in the differential index that are larger than . The data do not indicate such a break.
V Discussion
In this paper we used a new method to determine the Cosmic Ray proton spectrum in the energy range from 1.5 to 3 TeV with the stereoscopic IACT system of HEGRA.
As shown in Figure 13, the results are in very good agreement with recent results of satellite and balloon-borne experiments (see the Figure for references). We have shown that the new technique yields a similar accuracy as achieved with the present day satellite and ballon-borne experiments, i.e. an error on the absolute flux of 50% and an error on the spectral index of 0.15.
Earlier claims about a possible cutoff in the proton spectrum at energies below 10 TeV are clearly not confirmed (e.g. [28, 29] and references therein).
Our measurement of the proton spectrum is based on the large effective area of the atmospheric Cherenkov Technique of 103 m2 sr for a field of view of msr, and the stereoscopic imaging technique which permits to reconstruct the protons’ primary energy with the reasonable accuracy of of 50%. The extraction of an almost pure proton data sample is possible due to a suppression of the number of heavier primaries by more than one order of magnitude using the multi-telescope trigger and the stereoscopic image analysis. The accuracy of the measurements is limited by an uncertainty in the energy scale of 15%, by uncertainties of the detector acceptance, and by a residuum of heavier particles which could contaminate the data sample, if the relative abundance of heavier particles is much higher than presently believed. In future work we shall attempt to extend the measurement of the proton spectrum to higher energies. This might be possible by increasing the software threshold despite decreasing statistics. Improved cuts should also yield information about the spectrum of heavier nuclei.
Acknowledgements.
The support of the German Ministry for Research and technology BMBF and of the Spanish Research Council CYCIT is gratefully acknowledged. We thank the Instituto de Astrofisica de Canarias (IAC) for supplying excellent working conditions at La Palma. We gratefully acknowledge the work of the technical support staff of Heidelberg, Kiel, Munich and Yerevan. We thank H. Rebel and D. Müller for fruitful discussions.

| Nucleus | p | He | LM | HVH |
|---|---|---|---|---|
| Atomic Number | 1 | 4 | 6-19 | 20-56 |
| Mean Atomic Number | 1 | 4 | 14 | 40 |
| 0.1090.32 | 0.0660.15 | 0.0280.06 | 0.0500.19 | |
| 2.750.02 | 2.620.02 | 2.670.02 | 2.610.03 | |
| Proportion [at 1 TeV] | 0.43 | 0.26 | 0.11 | 0.20 |
| CR primary | p, CORSIKA | p, ALTAI | He, CORSIKA | He, ALTAI |
|---|---|---|---|---|
| , ph.e. | R [Hz] | R [Hz] | R [Hz] | R [Hz] |
| 7 | 11.96 | 11.96 | 3.65 | 3.74 |
| 10 | 6.63 | 6.61 | 2.14 | 2.19 |
| 12 | 4.78 | 4.68 | 1.57 | 1.63 |
| 15 | 3.62 | 3.56 | 1.21 | 1.28 |
| 20 | 2.23 | 2.23 | 0.79 | 0.83 |
| 30 | 1.22 | 1.22 | 0.46 | 0.47 |
| Cut, Widthscal [deg] | 1.15 | 1.0 | 0.85 | 0.75 | 0.65 | 0.55 |
|---|---|---|---|---|---|---|
| Acceptance prob. for p | 0.854 | 0.706 | 0.477 | 0.293 | 0.143 | 0.049 |
| Proton proportion | 0.723 | 0.762 | 0.815 | 0.858 | 0.889 | 0.918 |
| Helium proportion | 0.215 | 0.193 | 0.158 | 0.124 | 0.100 | 0.074 |
| LM-proportion | 0.032 | 0.024 | 0.016 | 0.012 | 0.007 | 0.005 |
| HVH-proportion | 0.031 | 0.021 | 0.011 | 0.007 | 0.004 | 0.003 |
| Energy [TeV] | 1.75 | 2.5 | 4.0 | 6.0 | 8.5 | 12.5 | 17.5 | 25.0 | 40.0 |
|---|---|---|---|---|---|---|---|---|---|
| 0.113 | 0.026 | -0.072 | -0.118 | -0.109 | -0.199 | -0.295 | -0.403 | -0.648 | |
| Resolution | 0.565 | 0.575 | 0.535 | 0.531 | 0.542 | 0.516 | 0.461 | 0.396 | 0.251 |
| Runs | 79 |
|---|---|
| Period | March-August 1997 |
| max. [deg] | 20 |
| [deg] | 14.0 |
| t, s | 191630 |
| t, h | 53.2 |
| Events | |
| Events (e.g. ) |
| Widthscal [deg] | 1.15 | 1.0 | 0.85 | 0.75 | 0.65 |
|---|---|---|---|---|---|
| 0.08290.0040 | 0.09750.0052 | 0.11490.0076 | 0.12060.0101 | 0.12740.0149 | |
| 2.6750.022 | 2.7090.024 | 2.7260.030 | 2.7260.038 | 2.7580.053 |
| Content | Helium | LM-particles | HVH-particles |
|---|---|---|---|
| Double | 2.733 | 2.755 | 2.755 |
| No | 2.793 | 2.762 | 2.762 |
| System | Trigger | , ph.e. | 7 | 10 | 12 | 15 | 20 | 30 |
|---|---|---|---|---|---|---|---|---|
| 2/4 | Measurement | 16.2 | 9.6 | 7.3 | 5.5 | 4.0 | 2.4 | |
| Monte Carlo | 18.1 | 10.1 | 7.3 | 5.6 | 3.5 | 2.0 | ||
| NN | 3/4 | Measurement | 8.5 | 4.7 | 3.7 | 3.0 | 2.1 | 1.2 |
| Monte Carlo | 9.0 | 5.1 | 3.6 | 2.7 | 1.7 | 0.9 | ||
| 4/4 | Measurement | 3.8 | 1.8 | 1.6 | 1.3 | 0.8 | 0.5 | |
| Monte Carlo | 3.6 | 1.9 | 1.3 | 1.0 | 0.6 | 0.3 | ||
| 2/4 | Measurement | 18.8 | 11.1 | 8.3 | 5.5 | 3.9 | 2.5 | |
| Monte Carlo | 20.8 | 11.1 | 7.8 | 5.9 | 3.6 | 2.0 | ||
| Data Runs | 9.1 | 7.7 | 5.9 | 3.9 | 2.2 | |||
| MJ | 3/4 | Measurement | 8.8 | 5.9 | 4.5 | 2.9 | 2.1 | 1.4 |
| Monte Carlo | 10.4 | 5.5 | 3.9 | 2.9 | 1.7 | 0.9 | ||
| 4/4 | Measurement | 3.9 | 2.5 | 1.9 | 1.1 | 0.8 | 0.6 | |
| Monte Carlo | 4.2 | 2.2 | 1.4 | 1.0 | 0.6 | 0.3 |
| Widthscal [deg] | 1.15 | 1.0 | 0.85 | 0.75 | 0.65 |
|---|---|---|---|---|---|
| 0.12160.0074 | 0.13220.0085 | 0.13970.0107 | 0.15380.0145 | 0.15520.0197 | |
| 2.6470.028 | 2.6760.030 | 2.6900.035 | 2.7270.044 | 2.7560.059 |
| Sample | 1 | 2 | 3 | 4 | |
|---|---|---|---|---|---|
| Random | 13.6 h | 12.9 h | 13.6 h | 13.2 h | |
| 2.73 | 2.73 | 2.72 | 2.71 | 0.03 | |
| Periods | March-May | May | May-July | July-August | |
| Observation time | 14.0 h | 13.8 h | 12.5 h | 11.8 h | |
| 2.71 | 2.70 | 2.72 | 2.77 | 0.04 |
REFERENCES
- [1] A. Daum et al., Astroparticle Physics 8, 1 (1997).
- [2] F. Aharonian et al., submitted to Astronomy and Astrophysics, 1998.
- [3] S. Swordy, Proc. of the 23rd ICRC, Calgary, Invited, Rapporteur and Highlight Papers (1993), p. 243.
- [4] T. Shibata, Proc. of the 24th ICRC, Rome, Invited, Rapporteur and Highlight Papers (1995), published in Il Nuovo Cimento, Vol. 19 C, N. 5, p. 713, 1996.
- [5] B. Wiebel-Sooth, P. L. Biermann, H. Meyer, Astronomy and Astrophysics 330, p. 389-398 (1998).
- [6] A. Plyasheshnikov et al., J. Phys. G: Nucl. Part. Phys. 24, 653 (1998).
- [7] M. Hemberger, Ph.D. thesis, 1998, Universitt Heidelberg, available as preprint MPI H – V 19 – 1998, MPI für Kernphysik, Heidelberg.
- [8] A. Lindner (HEGRA-Collaboration), in Proc. 25th ICRC, Durban (1997), Vol. 5, p. 113.
- [9] H. Krawczynski et al. 1996, NIM A 383, 431.
- [10] Karle, A., et al. 1995, Astroparticle Physics 3, 21.
- [11] Cortina, J., et al. 1997, in Proc. 25th ICRC, Durban, South Africa, Vol. 4, p. 69
- [12] Lindner, A. 1998, Astroparticle Physics 8, 235.
- [13] N. Bulian et al., Astroparticle Physics 8, pp. 223–233 (1998).
- [14] A. Fraß et al., Astroparticle Physics 8, pp. 91–99 (1997).
- [15] A. Plyashesnikov, A. Konopelko, preprint Moscow Lebedev Phys. Inst. (1988).
- [16] A. Konopelko, A. Plyasheshnikov, A. Schmidt, preprint Moscow Lebedev Phys. Inst. (1992) (in russian).
- [17] A. Konopelko, A. Plyasheshnikov, in preparation.
- [18] A. M. Hillas, in Proc. 16th ICRC, Kyoto (1979), Vol. 6, p. 13.
- [19] J. N. Capdevielle et al., Technical Report No. KfK 4998, Kernforschungszentrum Karlsruhe, Institut fűr Kernphysik (unpublished).
- [20] D. Heck et al., CORSIKA: A Monte Carlo Code to Simulate Extensive Air Showers, Forschungszentrum Karlsruhe, wissenschaftliche Berichte, FZKA 6019.
- [21] J. N. Capdevielle et. al., in Proc. VIIth ISVHECRI, Ann Arbor (1992).
- [22] B. Wiebel, Wuppertal preprint WUB 94-08 (1994).
- [23] A. M. Hillas, in Proc. 19th ICRC, La Jolla (1985), Vol. 3, p. 445.
- [24] M. Punch et al., Nature 358, 477 (1992).
- [25] P. T. Reynolds et al., Astrophys. J. 404, 206 (1993).
- [26] A. Konopelko, in Proc. Towards a Major Atmos. Cherenkov Detector IV, Padova, edited by M. Cresti (1995), p. 373.
- [27] F. Aharonian et al., submitted to Astroparticle Physics, 1998.
- [28] V. I. Zatsepin et al., in Proc. 23rd ICRC, Calgary (1993), Vol. 2.
- [29] I. P. Ivanenko et al, in Proc. 23rd ICRC, Calgary (1993), Vol. 2.