03(11.16.1; 11.19.2; 11.09.4; 09.04.1)
xilouris@physics.uch.gr
Are spiral galaxies optically thin or thick?
Abstract
The opacity of spiral galaxies is examined by modelling the dust and stellar content of individual galaxies. The three dimensional model that we use assumes exponential distributions for the dust and the stars in the disk, while the law is used to describe the bulge. In this model, both absorption and scattering by the dust are taken into account. The model is applied to five late-type spiral galaxies (NGC 4013, IC 2531, UGC 1082, NGC 5529 and NGC 5907) using their optical (and near infrared for IC 2531) surface photometry. For these galaxies we have determined the scalelengths and scaleheights of the stars and the dust in the disk, the bulge characteristics, the inclination angle and the face-on optical depth. Computation of the dust masses, as well as the extinction as a function of the wavelength, are also reported.
Having analyzed a total of seven galaxies
thus far, the five galaxies mentioned
above plus UGC 2048 and NGC 891 presented in
(Xilouris et al. 1997, 1998),
we are able to draw some general
conclusions, the most significant of which are:
1) The face-on central optical depth is less than one in all optical bands,
indicating that typical spiral galaxies like the ones
that we have modelled would be completely transparent if they were to be seen face-on.
2) The dust scaleheight is about half that of the stars, which means
that the dust is more concentrated near the plane of the disk.
3) The dust scalelength is about 1.4 times larger than that of the stars
and the dust is more radially extended than the stars.
4) The dust mass is found to be about an order of a magnitude
more than previously measured using the IRAS fluxes, indicating the existence
of a cold dust component.
The gas-to-dust mass ratio calculated
is close to the value derived for our Galaxy.
5) The derived extinction law matches quite well the Galactic extinction
law, indicating a universal dust behaviour.
keywords:
galaxies: photometry – galaxies: spiral – galaxies: ISM – ISM: dust, extinction1 Introduction
The amount and the way that dust is distributed within spiral galaxies as well as its extinction effects on the galactic starlight has been a matter of debate over the last few years. Since Disney, Davies and Phillipps (1989) proposed that spiral galaxies may be optically thick, a long series of papers has been published by different authors (see e.g. the introduction of Xilouris et al. 1997) with conclusions that often differ widely. Recent papers tend to support the idea of optically thin/moderately opaque spiral galaxies. This means that galaxies are either optically thin throughout their disks or that they are optically thin in the outer regions and moderately opaque at the center (e.g. Giovanelli et al. 1994, 1995; Kodaira & Yamashita 1996; Rönnback & Shaver 1997; Domingue et al. 1998; Moriondo et al. 1998; Kuchinski et al. 1998; González et al. 1998). On the other hand, recent far infrared/submillimeter observations of spiral galaxies give a direct picture of the dust distribution and a good estimate of the total amount of dust (e.g. Alton et al. 1998a, 1998b; Haas et al. 1998; Bianchi et al. 1998; Krügel et al. 1998). These observations indicate that the cold dust component ( K) that is now detected, boosts the dust masses about an order of magnitude higher than previously estimated by IRAS observations. On the other hand, a more radially extended dust distribution compared to that of the stars is derived.
In our studies we perform detailed modelling of spiral galaxies, aiming at the determination of the parameters that describe the three-dimensional dust distribution in these galaxies. For the three dimensional distribution of stars and dust we use simple and smooth geometries (e.g. axisymmetric exponentials for the stars and the dust in the disk and the law for the bulge). There is no doubt that in reality spiral galaxies are clumpy with small and large scale structure (e.g. spiral arms with the dust trailing the arms in a patchy way). One has to keep in mind those oversimplifications. The edge-on picture though that we use cancels out most of the variation along the line of sight and allows us to use simple mathematical functions in order to get a mean description of the galaxies. We have verified this with detailed computations (Misiriotis et al. in preparation) which take into account the spiral structure.
The two galaxies (UGC 2048 and NGC 891) that we have already modelled (Xilouris et al. 1997; hereafter Paper I and Xilouris et al. 1998; hereafter Paper II) using the radiative transfer model of Kylafis & Bahcall (1987; hereafter KB87), show low values of the optical depth in the face-on orientation, indicating low opacities for these galaxies, while the predicted dust masses and the dust distributions are now supported by the far infrared/submillimeter observations mentioned above. Our aim is to continue this kind of study with as many galaxies as possible in various orientations and thus improve the statistics. In this paper we do the analysis of the edge-on late-type spiral galaxies NGC 4013, IC 2531, UGC 1082, NGC 5529 and NGC 5907 (see Fig. 1).
NGC 4013 is an Sbc Hubble type spiral galaxy at a distance of 11.6 Mpc (Bottema 1995) and a B-band luminosity MB = -18.1 mag. Photometric properties of the 2D stellar distribution of this galaxy can be found in Bottema (1995), where a disk with exponential scalelength of 2.3 kpc and a sech2 scaleheight of 0.7 kpc is reported to fit the F-band data. Barnaby et al. (1993) present bulge and disk decomposition of an H-band image, where an exponential disk with scalelength 2.5 kpc and scaleheight 0.2 kpc and a modified-Hubble type bulge with effective radius 0.24 kpc are fitted. Observations of this galaxy in the 21 cm neutral hydrogen line (Bottema 1995; 1996) show a highly warped gas disk, while the optical image of this galaxy (also presented in Fig. 1) shows that the stellar distribution in the disk is not warped, at least not to the degree that should affect the axisymmetric modelling that we do [see also the optical warp curves presented in Florido et al. (1991)].
| Galaxy | Pixel size | Observing | seeing () | rms∗ (mag) | Total exposure time (min) | ||||
|---|---|---|---|---|---|---|---|---|---|
| (pc) | nights | B | V | I | B | V | I | ||
| NGC 4013 | 0.39 (22) | 20 Jun 95 | 1.3 | 0.04 | 0.02 | 0.02 | |||
| 0.39 (22) | 21 Jun 95 | 1.0 | 0.03 | 0.02 | 0.02 | 140 | 40 | 25 | |
| UGC 1082 | 0.39 (70) | 09 Sep 94 | 1.4 | 0.04 | 0.03 | 0.03 | 60 | 50 | 20 |
| NGC 5529 | 0.39 (56) | 04 Aug 97 | 1.2 | 0.03 | 0.03 | 60 | 40 | ||
| NGC 5907 | 0.75 (40) | 07 May 97 | 1.8 | 0.03 | 0.03 | 0.02 | 30 | 20 | 10 |
∗ rms deviations from the least squares fit between catalogue magnitudes and calibrated magnitudes for the standard stars.
IC 2531 is an Sb Hubble type spiral galaxy at a distance of 22 Mpc (Shaw et al. 1990) and MB = -18.8 mag. Two attempts at modelling IC 2531 have been reported (Wainscoat et al. 1989; Just et al. 1996). The model used was along the lines of KB87, but in a more simplified form, dealing with absorption by dust and neglecting multiple scattering effects. Also, only a local fit was made in several strips parallel to the disk’s minor axis. Furthermore, a bulge component was not included in the model. Our work presents a global fit to the observed data using the full radiative transfer model described in KB87 and more realistic (bulge included) distributions.
UGC 1082 is an Sb Hubble type spiral galaxy with a redshift of 0.009353 0.000017 (Giovanelli & Haynes 1993). Using the formulae given by Zombeck (1990), we derive a distance of 37 Mpc (assuming a value of H0 = 75 km s-1 Mpc-1) for this object. The B luminosity is MB = -18.4 mag. Visual inspection of this galaxy (see Fig. 1) shows an edge-on configuration of a relatively faint galactic disk and a bright bulge with an obvious dust lane passing through the disk.
NGC 5529 is an Sc Hubble type spiral galaxy at a distance of 29.6 Mpc (Shaw et al. 1990) with MB = -19.6 mag. Visual inspection of this system shows a galaxy which is not quite edge-on. Despite this geometry, a dust lane is very well revealed and thus our axisymmetric model, which is able to deal with any inclination angle, can be applied.
NGC 5907 is a well studied Sc galaxy at a distance of 11 Mpc (van der Kruit & Searle 1982). It’s B luminosity is MB = -19.1 mag. Several photometric studies have been reported about this galaxy and the stellar distribution has been obtained in several bands. In van der Kruit & Searle (1982), U, J and F band data were fit to a truncated exponential disk in the R direction and a sech2 type function in the z direction. The inclination angle was reported to be , while the scalelength and scaleheight were found to be 5.7 kpc and 0.43 kpc respectively in the J-band. Barnaby and Thronson (1992) used H-band data to fit the stellar distribution of this galaxy. The disk was fitted with an exponential in the R direction with a scalelength of 4.0 kpc and a sech type function in the z direction with a scaleheight of 0.43 kpc. The bulge was well described by a modified Hubble profile. Morrison et al. (1994) obtained good quality R-band data and fitted the disk with exponential (in both directions) functions with a scalelength of 4.81 kpc and a scaleheight of 0.43 kpc. The inclination angle was reported to be 86.7\degr.
In Sect. 2 we describe the observations and the data reduction, in Sect. 3 we briefly discuss the model and in Sect. 4 we present the model results for the five galaxies. A discussion follows in Sect. 5 with some general conclusions. A quick summary is presented in Sect. 6.
2 Observations and data reduction
Observations of the four galaxies NGC 4013, UGC 1082, NGC 5529 and NGC 5907 were made at Skinakas observatory in Crete, using the 1.3 m telescope. The detector that was used was a Thomson 1024 1024 CCD camera with 19m pixels, installed at the prime focus of the Ritchey-Cretien telescope. This arrangement corresponds to 0.39 arcsec/pixel and a field of view of . For the observations of NGC 5907 we used a focal reducer that is installed on the telescope in order to increase the field of view. This arrangement produced a larger field of view () and a scale of 0.75 arcsec/pixel (using the same camera as above). The chip was run with a gain of 3.33 /ADU and showed a readout noise of . Exposures were made through B, V, I broad band filters. The B and V passbands are comparable to those of Johnson’s photometric system, while the I passband is comparable to that of Cousin’s photometric system. The effective wavelength of the system (filter and camera) in each passband is m, m and m for the B, V and I bands respectively. In order to calibrate the images, we used standard stars and a photometric procedure described in detail in Paper I. In Table 1 we present some data concerning these observations.
| Parameter | Units | I band | V band | B band | |||
|---|---|---|---|---|---|---|---|
| mag/arcsec2 | |||||||
| kpc | 0.20 | 0.22 | 0.19 | ||||
| kpc | 1.76 | 1.94 | 2.55 | ||||
| mag/arcsec2 | |||||||
| kpc | 1.61 | 1.42 | 1.46 | ||||
| – | 0.42 | 0.44 | 0.41 | ||||
| – | 0.48 | 0.67 | 0.89 | ||||
| kpc | 0.11 | 0.13 | 0.13 | ||||
| kpc | 2.60 | 2.45 | 2.62 | ||||
| degrees | 89.6 | 89.7 | 89.9 | ||||
| Parameter | Units | K band | J band | I band | V band | B band | |||||
|---|---|---|---|---|---|---|---|---|---|---|---|
| mag/arcsec2 | |||||||||||
| kpc | 0.45 | 0.44 | 0.43 | 0.40 | 0.43 | ||||||
| kpc | 5.04 | 4.96 | 5.05 | 5.22 | 6.78 | ||||||
| mag/arcsec2 | |||||||||||
| kpc | 2.00 | 1.97 | 1.57 | 1.23 | 1.96 | ||||||
| – | 0.68 | 0.69 | 0.65 | 0.65 | 0.63 | ||||||
| – | 0.02 | 0.06 | 0.22 | 0.30 | 0.40 | ||||||
| kpc | 0.22 | 0.20 | 0.21 | 0.23 | 0.27 | ||||||
| kpc | 8.00 | 8.08 | 8.43 | 8.18 | 8.88 | ||||||
| degrees | 89.6 | 89.7 | 89.6 | 89.6 | 89.6 | ||||||
| Parameter | Units | I band | V band | B band | |||
|---|---|---|---|---|---|---|---|
| mag/arcsec2 | |||||||
| kpc | 0.44 | 0.47 | 0.44 | ||||
| kpc | 4.13 | 4.43 | 4.57 | ||||
| mag/arcsec2 | |||||||
| kpc | 1.34 | 1.30 | 1.44 | ||||
| – | 0.59 | 0.64 | 0.63 | ||||
| – | 0.17 | 0.27 | 0.34 | ||||
| kpc | 0.29 | 0.27 | 0.27 | ||||
| kpc | 5.47 | 5.78 | 5.55 | ||||
| degrees | 89.7 | 89.7 | 89.7 | ||||
| Parameter | Units | I band | V band | ||
|---|---|---|---|---|---|
| mag/arcsec2 | |||||
| kpc | 0.42 | 0.43 | |||
| kpc | 4.30 | 4.59 | |||
| mag/arcsec2 | |||||
| kpc | 1.95 | 1.95 | |||
| – | 0.59 | 0.58 | |||
| – | 0.42 | 0.65 | |||
| kpc | 0.37 | 0.32 | |||
| kpc | 7.70 | 7.10 | |||
| degrees | 87.2 | 87.4 | |||
| Parameter | Units | I band | V band | B band | |||
|---|---|---|---|---|---|---|---|
| mag/arcsec2 | |||||||
| kpc | 0.32 | 0.34 | 0.34 | ||||
| kpc | 3.86 | 4.91 | 5.02 | ||||
| mag/arcsec2 | |||||||
| kpc | 1.02 | 1.01 | 0.93 | ||||
| – | 0.34 | 0.34 | 0.45 | ||||
| – | 0.30 | 0.49 | 0.55 | ||||
| kpc | 0.10 | 0.11 | 0.13 | ||||
| kpc | 5.30 | 5.29 | 5.30 | ||||
| degrees | 87.2 | 87.2 | 87.0 | ||||
| Parameter | Units | K band | J band | I band | V band | B band | |||||
|---|---|---|---|---|---|---|---|---|---|---|---|
| mag/arcsec2 | |||||||||||
| kpc | 0.34 | 0.43 | 0.38 | 0.42 | 0.43 | ||||||
| kpc | 3.87 | 3.86 | 4.93 | 5.48 | 5.67 | ||||||
| mag/arcsec2 | |||||||||||
| kpc | 0.86 | 0.87 | 1.97 | 1.51 | 1.12 | ||||||
| – | 0.76 | 0.71 | 0.54 | 0.54 | 0.60 | ||||||
| – | 0.09 | 0.21 | 0.52 | 0.85 | 1.00 | ||||||
| kpc | 0.25 | 0.25 | 0.24 | 0.29 | 0.31 | ||||||
| kpc | 8.33 | 8.32 | 7.54 | 7.68 | 8.01 | ||||||
| degrees | 89.6 | 89.6 | 89.7 | 89.8 | 89.8 | ||||||
The optical observations of IC 2531 were made in March, 1991 with the 1m Australian National University (ANU) telescope at the Siding Spring Observatory (SSO). The CCD system was equipped with an EEV CCD of giving a pixel size of 0.56 arcsec at the f/8 Cassegrain focus. Graham’s (1982) standard stars were observed for calibration. Observations were made through B, V and I broad band filters with exposure times of 1000, 600, and 500 seconds respectively. The seeing was estimated to be . The near-infrared observations of the same galaxy were made in February, 1995 with the 2.3 m ANU telescope at SSO using CASPIR (Cryogenic Array Spectrometer/Imager). The instrument was installed at the f/18 Cassegrain focus and was equipped with an SBRC InSb detector giving a pixel size of 0.5 arcsec for its fast camera mode. The standard filter and a modified filter (), whose long wavelength edge is tailored to exclude much of the thermal emission, were used for the imaging observations. The observation sequence included as many sky exposures as the galaxy in order to follow the fast changing sky emissions. Several standard stars were observed during the same night.
3 Model
The stellar emissivity (luminosity per unit volume) that we use consists of an exponential (in both radial and vertical directions) disk and a bulge described by the R1/4 law, namely
| (1) |
with and being the scalelength and scaleheight of the disk and
| (2) |
with being the effective radius of the bulge and and the semi-major and semi-minor axis respectively. Here and are the normalization constants for the stellar emissivity of the disk and the bulge respectively. The relations
| (3) |
and
| (4) |
give the central value for the surface brightness of the disk and the bulge respectively, if the model galaxy is seen edge-on and there is no dust.
For the extinction coefficient we use a double exponential law, namely
| (5) |
where is the extinction coefficient at wavelength at the center of the disk and and are the scalelength and scaleheight respectively of the dust. The central optical depth of the model galaxy seen face-on is
| (6) |
For a more detailed description of all the parameters, the reader is referred to Sect. 4 of Paper I.
The radiative transfer model that we have used is that described in KB87 (see also Paper I). For computational reasons, as in Papers I & II, the radiative transfer was performed inside a cylinder with radius and half height of , so that practically all the galactic light as well as the dust are included. A Henyey-Greenstein phase function has been used for the scattering of the dust (Henyey & Greenstein 1941). The values for the anisotropy parameter and the albedo have been taken from Bruzual et al. (1988). Our task has been to find those values of the parameters in Eqs. (1) - (6) which create images of the model galaxies as close as possible to the images of the observed galaxies. For the model fitting techniques that we use, the reader is referred to Papers I and II.
4 Results
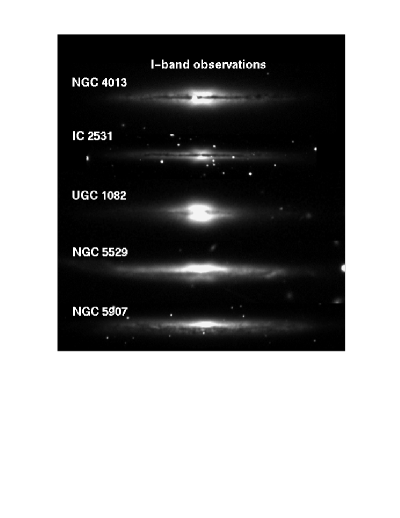
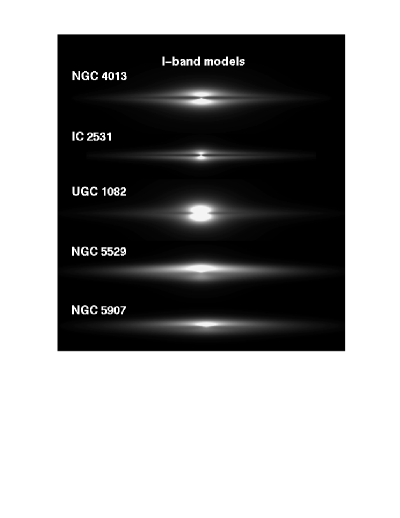
In Tables 2 through 6, we give the parameters of the best fit models to the observed data along with their confidence intervals for NGC 4013, IC 2531, UGC 1082, NGC 5529 and NGC 5907 respectively (for Table 7 describing NGC 891 see Sect. 5). Using the values of the parameters that describe the stellar and dust distributions of the galaxies, given in the above tables, we have created model images and have compared them with the observed images (see Figs. 1 and 2). In Fig. 1 the I-band observations of all five galaxies are presented (NGC 4013, IC 2531, UGC 1082, NGC 5529 and NGC 5907 from top to bottom). In Fig. 2 we show the model images of these galaxies in the I-band with the same scale and sequence as in Fig. 1 so that a direct comparison can be made between the two figures. In Figs. 3-7 we give a more detailed comparison between model and observation for each galaxy and each filter by showing vertical cuts along the minor axis. For this demonstration we use the ‘folded’ (around the minor axis) and photometrically averaged images of the galaxies, which are also the images that were used for the model fit (see Paper I). In each plot, the horizontal axis represents the offset (in kpc) along the vertical direction, with zero lying on the major axis of the disk. The vertical axis gives the surface brightness (in mag/arcsec2). Real data are indicated by stars, while the model is shown as a solid line for each profile. The six profiles in each plot are vertical cuts at six different distances along the major axis. The cuts are at distances and and are plotted from bottom to top, with being the scalelength of the stars as derived from the I-band modelling. The magnitude scale corresponds to the lower profile of each set, the other profiles are shifted upwards (in brightness) by 2, 4, 6, 8 and 10 magnitudes respectively. Profiles between 0 and correspond to brightness averaged over ( for NGC 5907) parallel to the major axis, while profiles at and are averaged over ( for NGC 5907) along the same direction. This was done to reduce as much as possible the local clumpiness that may exist in particular areas of the galaxy. In these plots, only the data above the limiting sigma level ( sigma of the local sky) that were used for the fit are plotted, while the foreground stars have been removed.


One can clearly see a good agreement between model and observation despite the small deviations in some places. It is worth remembering here that a global fit was done to the observed galaxy’s image and the derived set of parameters (Tables 2 - 6) gives the best galaxy image as a whole.
| Galaxy | |||||
|---|---|---|---|---|---|
| NGC 4013 | |||||
| IC 2531 | |||||
| UGC 1082 | |||||
| NGC 5529 | |||||
| NGC 5907 |
Subtracting the model image from the observation we obtain residual maps that give the distribution of the absolute value of the residuals throughout the galaxy’s image (see Papers I & II). From these maps we can derive the percentage coverage of the galaxy’s image with residuals below a certain value. We do so in Table 8, where the percentage coverage of the residuals below and is given for the I-band data. Approximately the same picture holds for the other bands (see Papers I & II). These numbers indicate the ability of our model to describe quite accurately the observed surface brightness of the galaxies that we modelled using relatively simple and smooth three dimensional distributions of stars and dust compared to the real ones with all the small scale clumpiness and spiral structure that they may have.
4.1 Dust mass calculations
Having found the parameters that best describe the dust distribution in each galaxy, we are able to have a good estimate of the total dust mass of each galaxy (see Paper I). In what follows we do these calculations and also compare with the total gas mass reported in the literature as well as with the dust mass calculated using the IRAS fluxes (wherever measurements are available).
For NGC 4013 the mass of the atomic hydrogen is reported to be (Bottema 1995), while the mass of the molecular hydrogen is (Gomez & Garcia 1997), giving a total of for the gas mass. Using the parameters derived from our model, the dust mass was calculated (see Sect. 5.3 of Paper I) to be . This implies a gas-to-dust mass ratio of 490. Using the IRAS and fluxes for this galaxy (Moshir et al. 1990) and Eq. (4) of Devereux & Young (1990), the dust mass is calculated to be , giving a gas-to-dust mass ratio of 1200.
In the case of IC 2531 the 21 cm line flux was measured to be S Jy km s-1 (Huchtmeier & Richter 1989) and thus the atomic hydrogen mass was calculated using Eq. (2) of Devereux & Young (1990) and is found to be . We have not been able to locate a measurement for the 2.6 mm CO line for this galaxy in order to calculate the molecular hydrogen mass , but a crude approximation is to assume the same mass as that of the atomic hydrogen (see Sect. 5.3 of Paper I). Thus, the total gas mass is approximately . The dust mass for this galaxy as calculated from our model parameters is , setting the gas-to-dust mass ratio to 420.
For UGC 1082 the 21 cm line flux has been reported to be S Jy km s-1 (Giovanelli & Haynes 1993). This gives an atomic hydrogen mass of . In absence of a 2.6 mm CO line measurement in order to calculate the molecular hydrogen mass we approximate it to be the same as that of the atomic hydrogen. The total gas mass is then . Using the IRAS and fluxes for this galaxy (Moshir et al. 1990) and Eq. (4) of Devereux & Young (1990), the dust mass is found to be . This implies a gas-to-dust mass ratio of 1900. However, using the parameters derived from our model, we calculate a dust mass of and the gas-to-dust mass ratio then becomes 360.
Adopting a 21 cm line flux of 40.8 Jy km s-1 (Huchtmeier & Richter 1989) for NGC 5529, we derive an atomic hydrogen mass of . Doubling it, in the absence of molecular hydrogen mass information, we get a total gas mass of . The and IRAS fluxes (Moshir et al. 1990) give a dust mass of which implies a gas-to-dust mass ratio of 3000. With our model calculations we find a dust mass of , giving a gas-to-dust mass ratio of 470.
For NGC 5907 exact gas mass calculations are presented in Dumke et al. (1997). The total gas mass is reported to be . The IRAS and fluxes (Moshir et al. 1990) give a dust mass of , while with our model parameters we derive a dust mass of . The gas-to-dust mass ratio then becomes 2200 using the IRAS measurements and 520 using our model’s parameters.
4.2 Relative extinction values
Adopting a mean scaleheight for the dust from all bands (see Sect. 5) and using the values derived for the face-on central optical depth () in each filter, we can derive the extinction coefficient in each band. We have found that and for NGC 4013, , , anad for IC 2531, and for UGC 1082, for NGC 5529 and and for NGC 5907. These ratios are identical to the ratios of the extinction values .


5 Discussion
Having analyzed a total of seven galaxies, we are now able to draw some general conclusions concerning the dust and stellar distribution characteristics of spiral galaxies. In order to have a consistent set of parameters for all the galaxies, we reanalyzed the galaxy NGC 891 (already presented in Paper II), but now using the law for the bulge stellar distribution instead of the modified Hubble profile that was used in Paper II. The values derived from the modelling are presented in Table 7 of the present paper.
We have quantified the opacity of the galaxies in terms of their central face-on optical depth . For all the galaxies we have found central face-on optical depths with values less than one in all the bands that we analyzed, indicating that they would appear to be transparent when seen face-on, despite their obvious dust lane in their almost edge-on orientation seen in the observations. The values of the optical depth in all bands are plotted in Fig. 8 for each galaxy. Different symbols indicate different bands. In particular, open circles correspond to the B-band, open squares to the V-band, open triangles to the I-band, solid squares to the J-band and solid triangles to the K-band.
It is of interest to see how the scaleheight of the stars is related to that of the dust. We show this in Fig. 9, where the parameters and (in kpc) as well as their ratio are plotted for each galaxy. The symbols have the same meaning as in Fig. 8. For the case of UGC 2048 (analyzed in Paper I), we give half of the derived scaleheight values since, as mentioned in Paper I, it’s distance has probably been overestimated by a factor of 2. Doing the statistics in the V-band data we derive a mean ratio of implying that the dust is more concentrated to the plane of the disk with respect to the stars. This was of course, evident from the prominent dust lanes. This mean value of is plotted as a horizontal dashed line. One can also notice that there is not a significant trend of with wavelength. This means that the main body of the disk is dominated by the old stellar population, at least at high distances, giving roughly the same scaleheight in all bands.
Of particular interest is the distribution of dust in the radial direction relative to the stars, as can be seen from the values that were derived for the scalelengths. In order to have a better view of how the scalelengths of the stars and the dust are related we give a plot (Fig. 10) similar to that of the scaleheights described above. The symbols here, have exactly the same meaning as that in Fig. 8. As with the scaleheights of UGC 2048, we adopt half the values of the scalelengths derived from the model. The statistics that were done in the V-band, give a mean ratio of . This value is shown as a dashed horizontal line. In all seven galaxies we have found that the dust is radially more extended than the stars. This result has recently been confirmed for our Galaxy using COBE/DIRBE data (Davies et al. 1997a). Analysis of ISO data for several galaxies (Davies et al. 1997b, Alton et al. 1998a), as well as SCUBA observations of NGC 891 in 450 and 850 (Alton et al. 1998b) also indicate a more extended radial distribution for the dust than for the stars. Another work that also supports this, is that of Lequeux & Guelin (1996) where a systematic reddening of background galaxies is found in the outer regions of the galaxy of Andromeda, suggesting the existence of dust even beyond the optical disk.
It is important to notice at this point the deviations with wavelength shown in Figs. 9 and 10 for the dust parameters. These deviations, which are mainly due to the different appearance of the clumpy nature of the galaxies in different bands, give a better estimate of the real uncertainty which for is kpc and for is kpc.
An interesting result that comes out of our model analysis is the dust mass calculation. For the two galaxies analyzed in the previous papers (UGC 2048; Paper I and NGC 891; Paper II) we find a dust mass which gives a gas-to-dust mass ratio very close to that derived for our Galaxy (the values of the dust mass for NGC 891 using the R1/4 law profile becomes while the gas-to-dust mass ratio is now 150). About the same picture holds for the rest of the galaxies modelled in this paper. A better picture of this is given in Fig. 11, where the gas mass (top graph) and the dust mass (middle graph) are plotted (in units of ) for each galaxy. For the dust mass (middle graph) we give the model calculations (filled circles) as well as the calculations using the IRAS data (open circles). The gas-to-dust mass ratio (using the dust mass derived from the model) is also given for each galaxy (bottom graph). A mean value of this ratio is (close to the value of adopted for our Galaxy, see Spitzer 1978; Sodroski et al. 1994) and is plotted as a horizontal dashed line in the last graph. For all the galaxies we have found a dust mass about an order of a magnitude more than that calculated using the IRAS fluxes, which proves the existence of a cold dust component that has gone undetected by IRAS. This is evident from the middle graph of Fig. 11, where the two dust masses (the one calculated from our model and the other calculated using the IRAS fluxes) are directly compared. Our extinction model though, being independent of the dust temperature (both warm and cold dust contribute to the extinction of light), is able to calculate the whole amount of dust contained within the galaxies. Strong support to this argument (that vast amounts of cold dust exists in spiral galaxies) is now given by recent far infrared observations in longer wavelengths, where the cold dust is now seen in emission (Alton et al. 1998a, 1998b; Bianchi et al. 1998; Haas et al. 1998; Krügel et al. 1998).
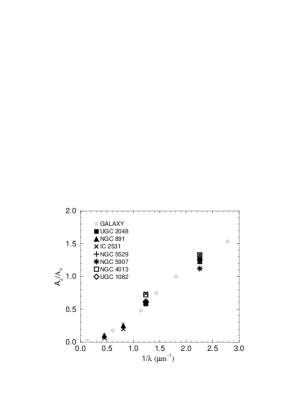
Having calculated the values of (see Sect. 4) for the galaxies modelled in this paper (NGC 891 values are , , and for the case where the R1/4 law is used), we are able to show how the values of the relative extinction in each band is compared with the values derived for our Galaxy (Rieke & Lebofsky 1985). This is done in Fig. 12, where the values of the extinction ratios are plotted as a function of the inverse wavelength (). Each symbol here represents a different galaxy as shown inside the graph. One can see that the extinction law derived for all the galaxies is in very good agreement with that measured for our Galaxy, indicating a universal dust behaviour.
6 Summary
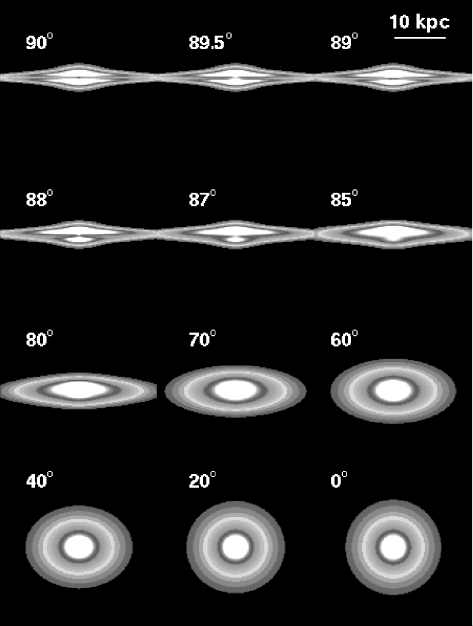
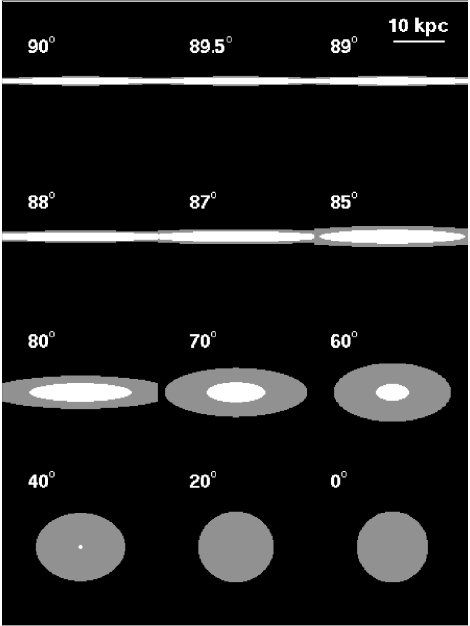
In this paper we have done the modelling of the dust and stellar content of five spiral galaxies (NGC 4013, IC 2531, UGC 1082, NGC 5529 and NGC 5907). With the two galaxies that have already been analyzed in previous work (UGC 2048 and NGC 891), we are able to draw some general conclusions and thus obtain a good picture of how a typical late-type spiral galaxy looks like. Assuming that the dust and the stellar disk follow an exponential 3D distribution and that the bulge is described by an law profile, the typical parameters (derived from the mean values) that describe the galaxy in the B-band are kpc, kpc and mag/arcsec2 for the stellar disk and and for the dust disk. A mean B-band central face-on optical depth is . For the bulge, being more dependent on the morphological type of the galaxy, we consider the values for the ellipticity, kpc for the effective radius and mag/arcsec2 for the central edge-on surface brightness. Such a galaxy is shown in Fig. 13 in various inclination angles, ranging from exactly edge-on (90 ) to face-on (0 ). The faintest surface brightness level is 25 mag/arcsec2. One thing that can clearly be seen is the existence of a dust lane down to almost . The decrease in the optical diameter (going from edge-on to face-on) is also very obvious. This is the effect of integrating along larger paths of light in the edge-on configuration than in the face-on one. In Fig. 14 we show how the “imagei” of the optical depth of such a galaxy varies with inclination angle. In each model-galaxy shown in this figure, the white regions show the parts of the galaxy that are optically thick (with ) and grey regions show the optically thin parts of the galaxy. It is evident that the galaxy is optically thick, at least in the central regions, down to almost inclination angle of , while the galaxy becomes totally transparent when viewed face-on.
Acknowledgements.
We are greatful to P. Alton for calculating the dust masses of the galaxies using the IRAS fluxes. This paper has been benifit a lot by the comments of R. Corradi. We also thank I. Papadakis, G. Paterakis, F. Mavromatakis and A. Misiriotis for stimulating discussions. This research has been supported in part by a Greek-British Joint Research Program and by a P.EN.E.D. Program of the General Secretariat of Research and Technology of Greece. YIB was supported by Creative Research Initiatives Program of the Korean Ministry of Science and Technology and also by Yonsei University Research Grant. Skinakas Observatory is a collaborative project of the University of Crete, the Foundation for Research and Technology-Hellas and the Max-Planck-Institut für Extraterrestrische Physik.References
- [] Alton P.B., Trewhella M., Davies J.I., 1998a, A&A, 335, 807
- [] Alton P.B., Bianchi S., Rand R.J., Xilouris E.M., Davies J.I., Trewhella M., 1998b, ApJ, 507, L125
- [] Barnaby D., Thronson H.A., Estep G.M., 1993, BAAS, 183, #79.02
- [] Barnaby D., Thronson H.A. 1992, AJ, 103, 41
- [] Bianchi S., Alton P.B., Davies J.I., Trewhella M., 1998, MNRAS, 298, 49
- [] Bottema R., 1995, A&A, 295, 605
- [] Bottema R., 1996, A&A, 306, 345
- [] Bruzual G.A., Magris G.C., Calvet N., 1988, ApJ, 333, 673
- [] Davies J.I., Trewhella M., Jones H., et al., 1997a, MNRAS, 288, 679
- [] Davies J.I., Alton P. B., Trewhella M., Bianchi S., 1997b, MNRAS, submitted
- [] Devereux N.A., Young J.S., 1990, ApJ, 359, 42
- [] Disney M.J., Davies J.I., Phillipps S., 1989, MNRAS, 239, 939
- [] Domingue D.L., Keel W.C., White R.E., 1998, ApJ, submitted
- [] Dumke M., Braine J., Krause M., et al., 1997, A&A, 325, 124
- [] Florido E., Prieto M., Mediavilla E., Sanchez-Saavedra M.L., 1991, A&A, 242, 301
- [] Giovanelli R., Haynes M. P., 1993, AJ, 105, 1271
- [] Giovanelli R., Haynes M. P., Salzer J.J., et al., 1994, AJ, 107, 2036
- [] Giovanelli R., Haynes M. P., Salzer J.J., et al., 1995, AJ, 110, 1059
- [] Gomez de Castro A.I., Garcia-Burillo S., 1997, A&A, 322, 381
- [] González R.A., Allen R.J., Dirsch B., at al., 1998 ApJ, 506, 152
- [] Graham J. A., 1982, PASP, 94, 244
- [] Haas M., Lemke D., Stickel M., et al., 1998, A&A, 338, L33
- [] Henyey L.G., Greenstein J.L., 1941, ApJ, 93, 70
- [] Huchtmeier W.K., Richter O.G., 1989, A general catalog of observations of galaxies, New York, Springer-Verlag
- [] Just A., Fuchs B., Wielen R., 1996, A&A, 309, 715
- [] Kodaira K., Yamashita T., 1996, PASJ, 48, 581
- [] Krügel E., Siebenmorgen R., Zota V., Chini R., 1998, A&A, 331, L9
- [] Kuchinski L.E., Terndrup D.M., Gordon K.D., Witt A.N., 1998, AJ, 115, 1438
- [] Kylafis N.D., Bahcall J.N., 1987, ApJ, 317, 637 (KB87)
- [] Lequeux J., Guelin M., 1996, New extragalactic perspectives in the New South Africa, Kluwer Academic Publishers
- [] Misiriotis A., Kylafis N., Papamastorakis J., Xilouris E., 1999, in preparation
- [] Moriondo G., Giovanelli R., Haynes M.P., 1998, A&A, 338, 795
- [] Morrison H.L., Boroson T.A., Harding P., 1994, AJ, 108, 1191
- [] Moshir M., Conrow G., McCallon H., et al., 1990, Infrared astronomical satellite catalogs, the faint source catalog.
- [] Rieke G.H., Lebofsky M.J., 1985, ApJ, 288, 618
- [] Rönnback J., Shaver P.A., 1997, A&A, 322, 38
- [] Shaw M., Dettmar R.-J., Barteldrees A., 1990, A&A, 240, 36
- [] Sodroski T.J., Bennett C., Boggess N., et al., 1994, ApJ, 428, 63
- [] Spitzer L., 1978, Physical Processes in the Interstellar Medium, New York, Wiley-Interscience
- [] van der Kruit P.C., Searle L., 1982, A&A, 110, 61
- [] Wainscoat R.J., Freeman K.C., Hyland A.R., 1989, A&A, 337, 163
- [] Xilouris E.M., Kylafis N.D., Papamastorakis J., Paleologou E.V., Haerendel G., 1997, A&A, 325, 135 (Paper I)
- [] Xilouris E.M., Alton P.B., Davies J.I., et al., 1998, A&A, 331, 894 (Paper II)
- [] Zombeck M.V., 1990, Handbook of space astronomy and astrophysics, Cambridge University Press