The giant X-ray outbursts in NGC 5905 and IC 3599:
Follow-up observations and outburst scenarios
Abstract
Huge amplitude X-ray outbursts in a few galaxies were reported in the last few years. As one of the exciting possibilities to explain these observations, tidal disruption of a star by a central supermassive black hole has been proposed. In the present paper, we perform a detailed discussion of this and other possible scenarios for the X-ray outburst in NGC 5905, and a comparison of NGC 5905 and IC 3599 in outburst as well as in quiescence. To this end we present (i) a thorough analysis of all ROSAT PSPC X-ray observations of NGC 5905 and new HRI data, (ii) optical photometry of NGC 5905 quasi-simultaneous to the X-ray outburst and on longer terms, (iii) the first post-outburst optical spectra of NGC 5905 and high-resolution post-outburst spectra of IC 3599, and (iv) photoionization models for the high-excitation emission lines that were discovered in the optical outburst spectrum of IC 3599. The investigated outburst models include, besides the tidal disruption event, a supernova in dense medium, an accretion-disk instability, an event of extreme gravitational lensing, the X-ray afterglow of a GRB, and the possibility of a warm-absorbed hidden Seyfert nucleus in the center of the galaxy. The successful models, all involving the presence of a central supermassive black hole, are selected and implications are discussed. The optical spectra of both galaxies in quiescence are carefully examined for signs of permanent low-level Seyfert-activity. Whereas IC 3599 shows several signs of activity, none is revealed for NGC 5905. At present, and among the X-ray bursts, this makes NGC 5905 the only safe candidate for a tidal disruption event in an otherwise non-active galaxy. The physical conditions in the HII emission-line gas are also investigated. We briefly comment on a search for further highly variable objects on the basis of ROSAT observations. Several with factors 10-20 are found; all of them are known to harbour warm absorbers.
Key Words.:
Galaxies: active – individual: NGC 5905, IC 3599 – emission lines – Starbursts – X-rays: galaxies1 Introduction
X-ray variability by factors of 2 – 3 is a common property of active galaxies (e.g., Mushotzky et al. 1993). However, X-ray outbursts by factors of order 100 are extremely rare; only very few objects have been reported to show such behaviour. Among these are IC 3599 (Brandt et al. 1995, BPF95 hereafter; Grupe et al. 1995a, G&95 hereafter) and NGC 5905 (Bade et al. 1996, paper I hereafter).
Both galaxies were detected in the X-ray high-state during the ROSAT all-sky survey and then declined in intensity within months–years. The peak luminosities exceeded = 1042 erg/s and the outburst spectra were very soft (photon indices –4). Further, both objects appear rather inactive, as judged from optical spectra (this point will be examined in detail below). Here we focus on NGC 5905, and perform a comparison with IC 3599. For both sources, tidal disruption of a star by a supermassive black hole (SMBH) has been mentioned as possible outburst mechanism (BPF95, G&95, paper I). The observation of a UV flare in the center of the elliptical galaxy NGC 4552 was interpreted in the same sense (Renzini et al. 1995).
The possibility of tidal disruption of a star by a SMBH was originally proposed as a means of fuelling active galaxies (Hills 1975), but was later dismissed. Peterson & Ferland (1986) suggested this mechanism as possible explanation for the transient brightening and large width of the HeII line observed in a Seyfert galaxy. Tidal disruption was invoked by Eracleous et al. (1995) in a model to explain the UV properties of LINERs. Rees (1988, 1990) suggested that the flare of electromagnetic radiation predicted when the stellar debris is swallowed by the black hole could be used as a tracer of SMBHs in nearby non-active galaxies. This question is of particular interest in the context of AGN evolution; i.e., what fraction of galaxies have passed through an active phase, and how many now have non-accreting and hence unseen SMBHs at their centers (e.g., Rees 1989)? Several approaches were followed to study this question. Much effort has been put in deriving central object masses from studies of the dynamics of stars and gas in the nuclei of nearby galaxies. Earlier groundbased evidence for central quiescent dark masses in non-active galaxies (e.g., Tonry 1987, Dressler & Richstone 1988, Kormendy & Richstone 1992) has been strengthened by recent HST results (e.g., van der Marel et al. 1997, Kormendy et al. 1996; see Kormendy & Richstone 1995 for a review). Evidence for a SMBH in our galactic center is strengthening as well (Eckart & Genzel 1996).
X-rays trace the very vicinity of the SMBH and provide an important probe of the AGN’s central regions. Information can be extracted from X-ray variability and continuum shape (e.g., Mushotzky et al. 1993) and strengths and profiles of X-ray emission lines (e.g., Tanaka et al. 1995, Bromley et al. 1998). This X-ray approach was hitherto mainly applied to galaxies that were previously known to be active.111One exception, the presumed HII galaxy IRAS 15564+6359 that showed X-ray variability (Boller et al. 1994) turned out to be active, as judged by optical spectra (Yegiazarian & Khachikian 1988, Halpern et al. 1995).
Presenting new observations and outburst models in the present study we critically assess the possibility of an event of tidal disruption in NGC 5905 (and IC 3599) and contrast this with other possible outburst scenarios, some (but not all) of which involve the presence of a SMBH as well.
The paper is organized as follows: In Sect. 2 we describe the data reduction. Section 3 deals with the X-ray spectral analysis and in Sect. 4 we provide the optical observations of NGC 5905 and IC 3599. Section 5 presents photoionization models for the optical outburst emission-line spectrum of IC 3599. Sections 6–9 are concerned with the discussion of the data. In Sect. 6 we scrutinize scenarios for the X-ray outburst in NGC 5905, Sect. 7 investigates the properties of NGC 5905 in quiescence, in Sect. 8 we perform a comparison with IC 3599, and in Sect. 9 we briefly present results from a search for further X-ray outbursters. Section 10 provides a summary and the conclusions.
Luminosities are given for =50 km/s/Mpc if not stated otherwise.
2 Data reduction
2.1 X-ray data
PSPC.
The ROSAT PSPC (Trümper 1983, 1990; Pfeffermann et al. 1987) data reduction for NGC 5905 was described in paper I. In the same manner, we treated the PSPC all-sky survey data of IC 3599. In brief, photons were extracted in a circular cell around the target source, the background was determined from a source free region along the scanning direction of the telescope and corrected for. The data reduction was performed using the EXSAS software package (Zimmermann et al. 1994a).
HRI.
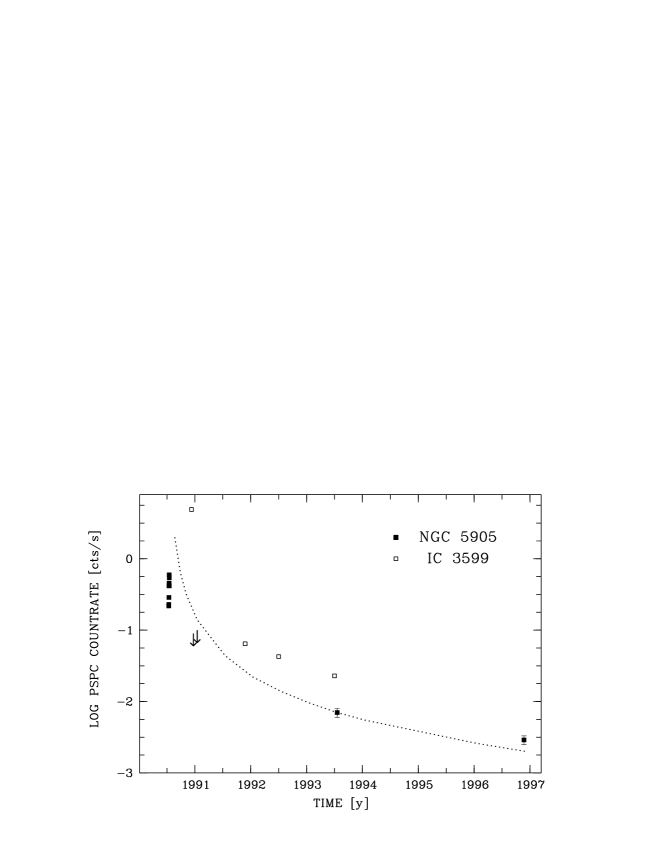
An HRI observation of NGC 5905 was performed from November 18–21, 1996, centered on the target source. The total exposure time is about 76 ksec. X-ray emission from NGC 5905 is detected with a background-corrected countrate of 0.0007 cts/s. This indicates a further drop in brightness by a factor 2 as compared to the 3-yr earlier last PSPC observation. The longterm X-ray lightcurve is displayed in Fig. 9. There, we converted the HRI countrate to PSPC countrate assuming constant spectral shape.
2.2 Optical spectra
In March 1997 we took spectra of NGC 5905 and IC 3599 with the focal reducer MOSCA at the Calar Alto 3.5m telescope in the green () and red () wavelength region. For NGC 5905 the slit width was 1″ which yields a spectral resolution of 3 Å, in the case of IC 3599 the slit width was and the spectral resolution is 4.5 Å. In both cases the slit was oriented in E-W direction. The optical data were reduced within the MIDAS package. The wavelength calibration was performed with Hg-Ar-Ne comparison frames and the velocity zero point was set by the night sky lines on the galaxy frames. Relative intensity calibration was achieved by taking spectra of the spectrophotometric standard star GD71.
3 X-ray spectral analysis
3.1 NGC 5905
3.1.1 Standard models
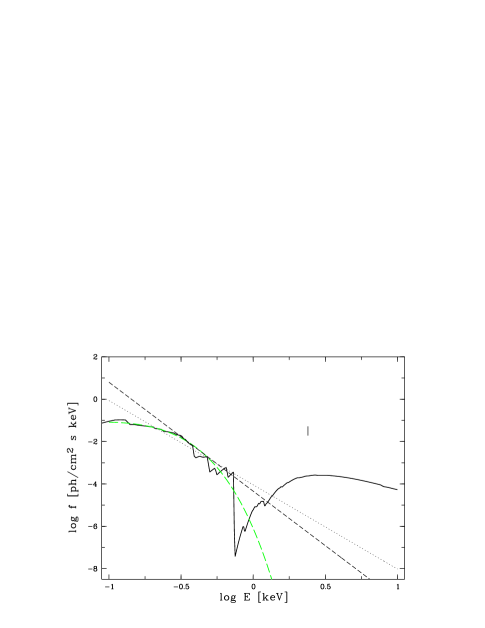
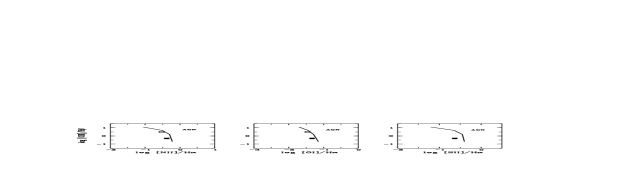
In addition to the analysis in paper I we add several further models, which we later use in discussing possible outburst scenarios. The results for the powerlaw (pl) and pl+blackbody (bb) model fit of paper I are summarized in Tab. 1. In the following, we first fit the high-state data due to better photon statistics, and then comment on the low-state spectrum. If not stated otherwise, was fixed to the Galactic value, cm-2 (Dickey & Lockman 1990). Applying a single bb, we find a temperature = 0.06 keV, an intrinsic (0.1-2.4 keV) luminosity = 2.6 1042 erg/s, and = 1.2. The corresponding values for emission from a Raymond-Smith (rs) plasma are = 0.1 keV, = 2.2 1042 erg/s, and = 1.2. If is treated as free parameter we get = 4.4 1020 cm-2, = 0.06 keV, = 44.5 1042 erg/s, and = 1.1. Fitting the accretion disk model included in EXSAS yields for a BH mass of 104 M⊙ an accretion rate in terms of the Eddington rate of = 0.2, = 2.9 1042 erg/s, and = 1.1. Some models are shown and compared in Fig. 1.
| galaxy | model | pl, free | pl(1) | pl + bb(1) | ref | |||||
| IC 3599 | survey | 5.2 | –4.8 | 1.5 | –3.1 | 6.4 | –2.2 | 91 | 2.2 | BPF95 |
| –3.1 | 3.1 | –2.0(4) | 91 | 1.4 | G&95 | |||||
| pointing II | 2.9 | –4.6 | 0.9 | BPF95 | ||||||
| –3.3 | 1.2 | –2.0(4) | 65 | 1.0 | G&95 | |||||
| NGC 5905 | survey | 2.9 | –5.1 | 1.0 | –4.0 | 1.26 | –1.9(4) | 48 | 0.9 | paper I |
| pointing | 8.2 | –4.5 | 1.0 | –2.4 | 1.2 | |||||
(1) fixed to (= 1.47, 1.3 1020cm-2 for NGC 5905 and IC 3599, respectively), (2)in 1020cm-2, (3)in eV, (4)fixed
3.1.2 Warm absorber models
The presence of a warm absorber could explain the observed variability and softness of the X-ray spectrum of NGC 5905 (Komossa & Fink 1997a). This model is discussed further in Sect. 6.5. To test for the presence of a warm absorber, we have applied our Cloudy-based models (described e.g. in Komossa & Fink 1997b-d; for details on the photoionization code Cloudy see Ferland 1993, 1998). The properties of the ionized material which are derived from X-ray spectral fits are the total hydrogen column density of the warm absorber and the ionization parameter , defined as
| (1) |
where is the flux of the incident continuum, the frequency at the Lyman limit. We used a mean Seyfert spectrum of piecewise powerlaws with =–1.4 in the EUV and = –1.9. Solar abundances (Grevesse & Anders 1989) were adopted if not stated otherwise.
The fit of a warm absorber to the high-state spectrum proves to be successful with an ionization parameter of log 0.0 and a column density log 22.8 ( = 1.0). In a second step, we applied the model of a dusty warm absorber. The presence of dust could obscure the nucleus at optical/UV wavelengths, and explain why the optical spectrum of NGC 5905 looks like that of a non-active galaxy (for details see below).
The dusty models were again calculated with Cloudy. We first assumed a Galactic gas/dust ratio, the dust species graphite and silicate, and depleted gas-phase metal abundances. The photon index of the intrinsic X-ray spectrum was fixed to the canonical Seyfert value of =–1.9. No fit is possible. This can be traced back to the strong ‘flattening effect’ of dust (Komossa & Fink 1997b-d; Komossa & Bade 1998) that is in conflict with the steep observed spectrum. Several models with modified dust properties were explored. If we allow only the silicate species to be present, being depleted by a factor of 20, it becomes possible to fit the high-state spectrum (with log 0.2, log 22.9).
3.1.3 Combined fits
Here we fit the low-state data, fixing some of the parameters to
the values determined for the high-state
observation. This is to test whether the data can be explained by requiring the
change of one parameter only, or as few as possible.
The following descriptions were applied:
(i) Pure absorption variability. Is the decline in luminosity
caused by increased absorption,
e.g., by a cloud blocking the line-of-sight (l.o.s.)
during the low-state or by a transitory
decrease
in absorption during the high-state ?
To test this possibility, the pl index and norm were fixed to the values determined
for the high-state, and the low-state was fit with as free parameter.
The quality of the
fit turns out to be unacceptable (=2.8).
(ii) Changes in warm absorption. Ionized material responds to changes in the impinging
photon flux.
The observed spectrum shows a flattening with increasing time from the outburst.
Whereas a warm absorber is expected to first respond by deeper
absorption (causing a steeper observed spectrum)
to a decline in intrinsic luminosity
it then goes from ‘warm’ to ‘luke-warm’, shifting the edges to more
lowly ionized species,
thereby flattening the observed spectrum.
In any case, one expects lower in the low-state.
Whereas a warm absorber can formally be fit to
the low-state spectrum, we find a higher ionization parameter (log )
as well as higher column density (log ).
(iii) Same bump component, declined in intensity and/or temperature.
Single component fits (like bb or rs) already show that an increase in temperature
(in addition to the decrease in luminosity) is found for all models, if
is left as free parameter. If constant is enforced, i.e. fixed
to the value determined for the
high-state observation, is unacceptably large ().
In the accretion disk description, if the black hole mass
is fixed, = 1 in the low-state, and
the fit is still unacceptable.
(iv) Variable bump component on top of constant underlying pl.
Fixing the norm of the underlying pl to the high-state value (in the pl+bb description)
it is not possible to fit the low-state. Such a two-component description of
the low-state anyway does not lead to an improvement of the fit. If it
is nevertheless applied, a successful fit requires the powerlaw component to decline
by about a factor of 10 in flux, and to decrease to 12 eV
(as compared to 48 eV in the high-state).
Since none of the ‘tight’ descriptions proved to be successful, we conclude that the spectral component seen in the PSPC low-state (with erg/s and ) is not the same as the one in the high-state, and most probably dominated by the emission of the host galaxy, which is typically of the order erg/s in non-active galaxies (e.g., Fabbiano 1989, Vogler 1997).
3.2 IC 3599
Standard fits (pl and bb) are summarized in Tab. 1. Here, we comment on the possible presence of a warm absorber since no such model has been applied previously. Fitting this model to the high-state X-ray spectrum (with =–1.9 fixed) yields log , log and cold absorption consistent with the Galactic value. The fit comes with a rather high = 2.4. However, none of the applied models gives an acceptable fit (cf. Tab. 1) the warm absorber being as successful as the pl + bb description.
4 Optical observations
4.1 Photometry
Depending on the ratio of the variable component, we might expect to see some optical variability as well; a factor 100 in the variable component would correspond to 5m (but ‘smeared’ due to seeing). To search for optical variability, we used the photographic plates available at Sonneberg Observatory. For an overview of the program and plate details see Bräuer & Fuhrmann (1992). We examined all plates taken around the time of the observed X-ray outburst as well as a random sample of plates taken on a longer timescale (between the years 1962 and 1995). We mainly used the blue plates due to their better quality; in the time-interval of the X-ray observation we also checked the red plates.
The brightness of the nucleus of NGC 5905 was measured relative to the nucleus of the similarly bright nearby non-active spiral galaxy NGC 5908.
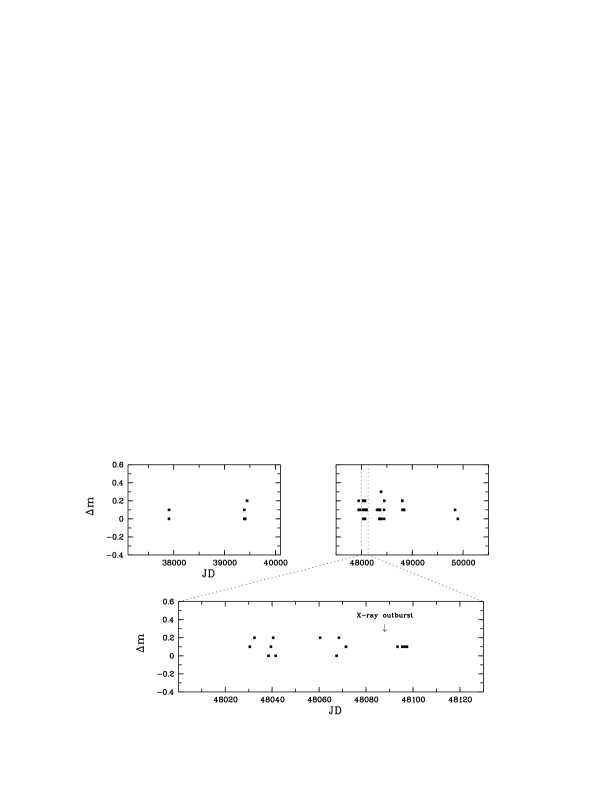
The lightcurve is shown in Fig. 2. Within the error of 0.2m the optical brightness is constant. This holds for the time around the X-ray outburst as well as on long terms, and places tight constraints on the outburst scenarios (Sect. 6).
4.2 Optical post-outburst spectra
4.2.1 NGC 5905
Emission line strengths.
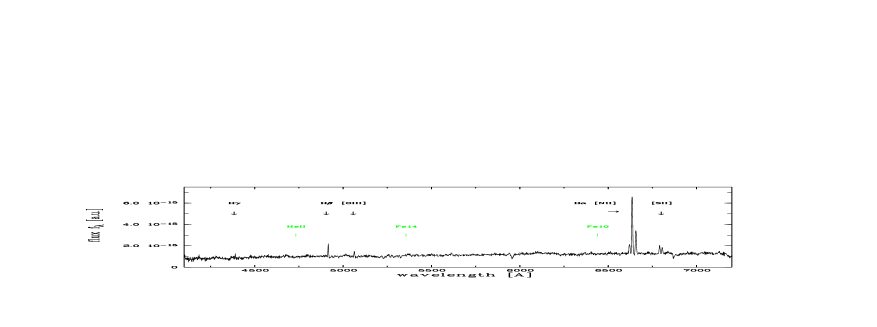
The optical spectrum of NGC 5905 is displayed in Fig. 3. It shows strong emission lines on a continuum with absorption lines produced by the stellar content of the nucleus. The contribution of the stellar content is higher in NGC 5905 than in IC 3599 (judged by the deeper absorption in the former’s spectrum). The Balmer lines are composed of an emission line plus a broader absorption which hints to a large portion of moderately young stars in the nucleus of NGC 5905 (stars of spectral type B, A and F). Further detected emission lines are those of [OI], [OIII], [NII] and [SII] (Tab. 2). In Fig. 5 emission line ratios are plotted in the diagnostic diagrams of Veilleux & Osterbrock (1987). No high-ionization lines like HeII or [FeX] were detected.
| Line | FWHM [km/s] | |||
|---|---|---|---|---|
| NGC 5905 | IC 3599 | NGC 5905 | IC 3599 | |
| H 4340 | 0.20 | 0.26 | ||
| [OIII] 4363 | 0.21 | 0.32 | ||
| HeII 4686 | - | 0.37 | 870 | |
| H 4861 | 1 | 1 | 270 | 480 |
| [OIII] 5007 | 0.49 | 3.2 | 300 | 260 |
| [FeVII] 5721 | - | 0.10 | 440 | |
| [FeVII] 6087 | - | 0.23 | 360 | |
| [OI] 6300 | 0.30 | 0.18 | 430 | |
| H 6563 | 6.4 | 5.2 | 280 | 480 |
| [NII] 6584 | 2.7 | 1.6 | 290 | 430 |
| [SII] 6716 | 0.86 | 0.3 | 280 | 210 |
| [SII] 6731 | 0.66 | ∗ | 280 | |
∗ overlaps with atmospheric O2 6880 absorption.
Line profiles.
The emission line widths were determined by fitting Gaussians to the lines. The instrumental width was derived from night-sky lines which yielded 2.9Å. The lines are very narrow, of order 270–300 km/s FWHM (Tab. 2; not corrected for instrumental resolution). In particular, we find no hints for an underlying broad emission component that would indicate permanent low-level Seyfert activity. All properties of the emission line spectrum are fully compatible with spectra observed in HII galaxies.
We find clear signs of a rotation curve in the spectra of NGC 5905. The real (un-broadened) width of the lines is therefore even smaller than given above. To derive the rotation curve, we extracted one dimensional spectra of NGC 5905. The center shows a decreased H emission line strength which can be interpreted with absorbing gas along the line of sight. The E-W orientation of the slit is approximately perpendicular to the orientation of the bar. To extract line of sight velocities along the slit we measured the position of the emission lines for each CCD row near the galaxy center. A Gaussian was fitted to each emission line to determine its wavelength. The distance between the rows () is clearly smaller than the seeing of . Therefore fine structure and a higher gradient in the rotation curve is expected for spectra with better spatial resolution. The highest rotation velocity is reached 2″ outside the center which corresponds to 0.72 kpc. The velocity curve is shown in Fig. 4 and further discussed in Sect. 7.3.

4.2.2 IC 3599
Emission line strengths.
The optical spectrum of IC 3599 differs from that of NGC 5905 in several respects (Figs. 7, 7). It shows stronger [OIII] emission and some high-ionization lines, like HeII4686 and [FeVII]6078. These have not changed in strength in comparison to the 1995 post-outburst spectrum in G&95, indicating these lines may be permanent. We do not find signs for emission from FeII.
Line profiles.
The instrumental width was determined to be 4.5Å. Line widths given below and in Tab. 2 are corrected for this value (4.5Å). The Balmer lines have larger widths than the forbidden lines of [OIII] and [SII], but the differences in line widths and the width of H (480 km/s) would still be consistent with a Seyfert 2. However, the complex of H and the two [NII] lines is significantly better described if we assume two Gaussian components for H with FWHMs of and , both of similar intensity.222Fitting Gaussians to emission lines to assess the presence of a broad component is standard practice which also we followed; ‘real’ line profiles may be of more complex shape, though.
These spectral results obtained by our new spectra with higher spectral resolution suggest an intermediate-type Seyfert classification for IC 3599, namely a Seyfert 1.9 in the scheme of Osterbrock (1981).


5 Photoionization models for the optical outburst spectrum of IC 3599
5.1 Model assumptions
In order to model the high-ionization emission line component in the optical outburst spectrum of IC 3599 (taken 0.5 yr after the observed X-ray outburst; BPF95), thereby deriving the physical properties of the illuminated gas, we have calculated a sequence of photoionization models, again using the code Cloudy. We assume constant density gas ionized by a pointlike central continuum source and employ the mean Seyfert spectrum described in Sect. 3.1.2 except for modifications in the EUV and X-ray range to account for the observed X-ray spectral and variability properties.
Emission line ratios were extracted from the spectrum of BPF95. A large grid of models was calculated, varying all relevant unknown parameters (i.e., the EUV–X continuum shape, the density , the column density , and the distance from the nucleus ; abundances were fixed to the solar value) with the aim of matching the observed line-ratios during outburst within a factor of 2 (note, e.g., uncertainties in collisional strengths of coronal lines). We also carefully checked (and it turned out to be important) that no other, non-detected, lines were overpredicted by the models (like [OIII], [OI])333The high-density gas discussed below could contribute to [OIII], but clearly not to [SII] (much lower critical density). Therefore, we have checked that the observed ratio of [OIII]/[SII] is constant from outburst to quiescence, i.e. there is no strong contribution to [OIII] in outburst..
5.2 Results
We find that the high observed X-ray flux in form of a strong ‘hot’ soft excess and a large gas column density are required to produce the observed wide range in ionization states (like O0 and Fe13+). For the emission in the Fe lines there are always two solutions, one with low density, the other with high density. The high density solution is needed to successfully account for the strength of OI 8446 (which is underpredicted otherwise) and to avoid the overprediction of other low-ionization forbidden lines.
The best match is obtained for clouds of column density cm-2, a gas density cm-3, and a cloud distance from the nucleus of pc. Observed and modeled emission lines are compared in Tab. 3. The derived parameters are typical for BLR or CLR clouds444for some recent BLR models for Seyfert galaxies see, e.g., Radovich & Rafanelli (1994), Baldwin et al. (1995); for coronal line region (CLR) models, e.g., Ferguson et al. (1997), Binette et al. (1997). suggesting that IC 3599 permanently harbours a BLR that is usually too weak to be easily detected (or is mainly hidden) but was illuminated by the X-ray outburst.
| Line | observed | modeled |
|---|---|---|
| HeII 4686 | 0.36 | 0.38 |
| H 4861 | 1.0 | 1.0 |
| HeI 5876 | 0.14 | 0.12 |
| [OIII] 5007 | 0.2 | 0.02 |
| [FeX] 6375 | 0.37 | 0.45 |
| [FeXI] 7892 | 0.23 | 0.36 |
| [FeXIV] 5303 | 0.17 | 0.11 |
| OI 8446 | 0.23 | 0.10 |
In traveling through the inner regions of the galaxy, the outburst emission acts as a probe of this region. It will be interesting to see when the emission reaches the distance, where in active galaxies the bulk of the NLR is located.
6 Discussion: NGC 5905 outburst scenarios
The X-ray emission of normal spirals is too low to account for the maximum X-ray luminosity observed and drastic variability is not expected (see also paper I). Below, we scrutinize scenarios that may explain the observations.
6.1 Supernova
X-rays are first emitted during the SN outburst itself. Although energetically feasible, the timescale is too short (seconds to hours, instead of days) to account for the observed X-ray outburst in NGC 5905. On a longer time-scale, further radiation originates in a shock produced by expansion of the SN ejecta into the nearby circumstellar medium. The X-ray luminosity of the few detected SNe is much weaker and the spectra are harder than that of NGC 5905, though.555 Only a few SNe (nearly all of type II) have been observed in X-rays so far (reviewed by Schlegel 1995). The maximal observed luminosities reached in the soft X-ray band are (Schlegel 1995, assuming = 75) 2.7 1039 erg/s (SN 1980K), 3.2 1040 erg/s (SN 1986J), 9.5 1039 erg/s (SN 1978K), 2.8 1040 erg/s (SN 1993J, 5 d after explosion), 1041 erg/s (SN 1988Z; Fabian & Terlevich 1996), and 1 1039 erg/s (SN 1979C; Immler et al. 1998). The temperatures assuming a thermal spectrum range from 0.5 keV to 7 keV (Canizares et al. 1992, Bregman & Pildis 1992, Schlegel 1995, Zimmermann et al. 1994b).
6.2 SN in dense medium
The possibility and consequences of the existence of SNe in dense molecular gas was studied by Shull (1980) and Wheeler et al. (1980). The idea was revived by Terlevich (1992) in the context of a starburst interpretation of AGN.
The basic scenario is the following: The matter ejected by the SN explosion expands into a region of high interstellar gas density. The interaction causes a shocked region of hot gas enclosed by two shock waves, on the outside of the outgoing shock, and on the inside of the inward reverse shock. The outward shock encounters dense circumstellar material. After sweeping up a small amount of gas these remnants become strongly radiative () and deposit most of their kinetic energy in very short time-scales, thus reaching very high luminosities. Because of the large shock velocities most of the energy is radiated in the EUV and X-ray region. For expansion into dense material, all evolutionary phases are substantially speeded up as compared to the ‘standard’ case of cm-3.
Since in this scenario high luminosities can be reached, and the evolutionary time is considerably shortened (only of the order of years to few tens of years), a SN in dense medium may be an explanation for the observed X-ray outburst in NGC 5905. In the following we first give some estimates using the analytical treatment presented in Shull (1980) and Wheeler et al. (1980).
Assume SN ejecta of initial total energy erg, expanding into a medium of density cm-3. Most of the energy is emitted during/shortly after the onset of the radiative phase, which starts after a time
| (2) |
The evolution of temperature, radius and luminosity of the shock is then given by
| (3) |
| (4) |
| (5) |
assuming line cooling to dominate with a cooling function of , as expected from the X-ray fit.
Since it is unclear in which evolutionary state NGC 5905 has been observed
we make the following assumptions:
(1) We assume the observed luminosity to be the peak luminosity
(and = ), dominantly emitted
in the X-ray regime. These assumptions go in the direction of requiring
less extreme conditions.
We then check, if, and under which conditions, the observed high
luminosity, and the quick decline in
can be reproduced within this scenario.
An energy of erg is typically deposited by the explosion.
At , and for a measured erg/s,
the above equations can be solved for the density, yielding
.
A decrease in luminosity
within 5 months
(1.45 yr)
of a factor of (20) is then predicted, which compares to the observed drop
of a factor of 5 (100).
Whereas these timescales roughly agree,
the expected temperature is K, suggesting a much harder
X-ray spectrum than is observed.
(2) In a second step, we drop the assumption that was observed at its peak value,
and use the temperature derived from the X-ray Raymond-Smith (rs) fit as an estimate
of , with K, K for
the rs model with free or fixed , respectively.
In both cases the estimated densities
are unrealistically large, cm-3.
In conclusion, extreme conditions would be required and the predicted disagree. Additionally, fine-tuning in the column density of the surrounding medium would be needed in order to prevent the SNR from being completely self-absorbed. Thus, we consider this scenario very unlikely.
6.3 Accretion disk instabilities
If a massive BH exists in NGC 5905, it usually has to accrete with a very low accretion rate or radiate with a low efficiency, or be completely dormant. One solution in the framework of accretion disks that has recently received a lot of attention, are advection dominated disks in which most energy is advected with the accretion flow instead of radiated away (e.g., Abramowicz et al. 1988, Narayan & Yi 1994; review by Narayan et al. 1998). This may be the dominant accretion mode in low-luminosity objects (like in NGC 5905 in ‘quiescence’).
An instability in the accretion disk may then provide an explanation for the observed X-ray outburst. Thermally unstable slim accretion disks were studied by, e.g., Honma et al. (1991), who find the disk to exhibit burst-like oscillations for the case of the standard viscosity description and for certain values of accretion rate. The high-luminosity state is characterized by a high mass accretion rate in the inner disk region, lasting for a time of
| (6) |
where = 0.1 is the standard viscosity parameter (e.g., Frank et al. 1985) and is the mass of the central black hole. (For assumptions of this analytic result see Honma et al. 1991; for numerical results for a wider range of parameters cf. their Fig. 11). If the duration of the outburst is less than 5 months (i.e. the survey variability is taken as a real rise in ), the mass of the central black hole in NGC 5905 should be less than .
These burst-like oscillations are found by Honma et al. only for certain values of the initial accretion rate. A detailed quantitative comparison with the observed outburst in NGC 5905 is difficult, since the behaviour of the disk is quite model dependent, and further detailed modelling would be needed.
6.4 Warm absorber
In this scenario, NGC 5905 would host an active nucleus that is usually hidden by a large column density of cold absorbing gas. The Seyfert nucleus is intrinsically variable, and becomes visible (in X-rays) during its flux high-states by ionizing the ambient medium that becomes a warm absorber and transparent to soft X-rays. This could naturally explain the observed variability as well as the steepness of the outburst spectrum.
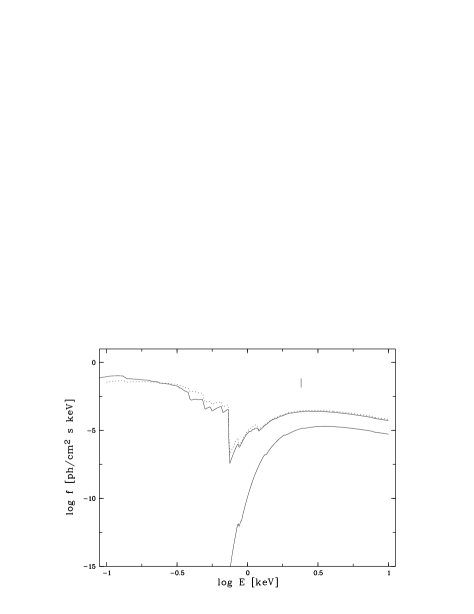
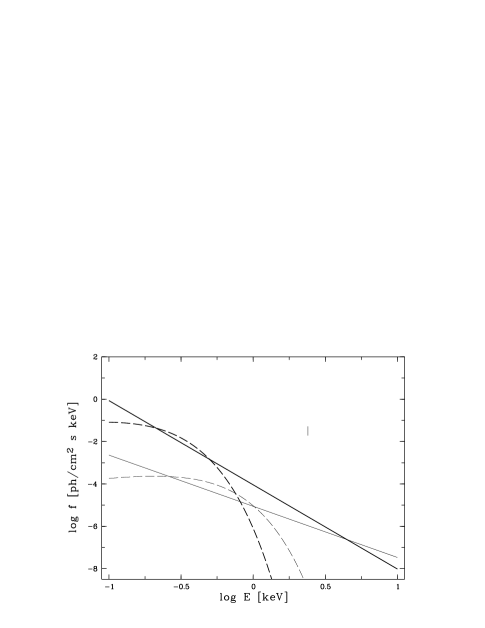
We found that the high-state spectrum can be well described by a (dust-free) warm absorber. A source-intrinsic change in luminosity by a factor of less than 10 is needed to change the absorption to complete within the ROSAT band (Fig. 8), veiling the view of the nucleus in soft X-rays. Variability of such order is not unusual in low-luminosity AGN.
Since there is no evidence for Seyfert activity in the optical spectrum, the nucleus must be hidden in this spectral region. Assuming dust to be mixed with the total column density of the warm absorber would result in an optical extinction of (for a Galactic gas/dust ratio) and would hide the Seyfert nucleus completely. However, this dust strongly modifies the X-ray spectrum and such a model does no longer fit the X-ray observation. As we saw in Sect. 3.1.2, only fine-tuning in the dust properties enabled a successful spectral fit in terms of a dusty warm absorber. Alternatively, a steep underlying intrinsic spectrum could be assumed to compensate for the flattening effect of dust. This is not an elegant solution, though, since part of the original aim was to explain the steep observed spectrum.
To summarize, a warm absorbed hidden Seyfert nucleus only explains the observation when strongly fine-tuning the dust-properties.
6.5 Tidal disruption of star
Depending on its trajectory, a star gets tidally disrupted after passing a certain distance to the black hole, the tidal radius, and the debris is accreted by the hole. This produces a flare of electromagnetic radiation. The peak luminosity should be a substantial fraction of the Eddington luminosity. The timescale after which the bulk of the material is swallowed is estimated to be of the order of months, after that, the luminosity declines as (Rees 1990). Detailed numerical simulations of the disruption process (e.g., Laguna et al. 1993, Diener et al. 1997) and consequences for the surroundings (e.g., Rauch & Ingalls 1998) have been carried out in the last few years. Explicit predictions of the emitted spectrum and luminosity are still rare. In particular, it is uncertain whether the emission peaks in the UV spectral region (e.g., Loeb & Ulmer 1997, Ulmer et al. 1998) or in the EUV – soft X-rays (e.g., Rees 1988, Sembay & West 1993).
If the X-ray outburst of NGC 5905 is interpreted as a tidal disruption event, the black hole mass can be roughly estimated via the Eddington luminosity which is given by
| (7) |
In case of NGC 5905, a BH mass of M⊙ would be sufficient to produce the observed (assuming = and to be observed near maximum; this provides a lower limit on the BH mass). In order to reach this luminosity, , a mass supply of about 1/2000 M⊙/year is necessary, assuming =0.1. Rees predicts the event to last of the order of several months, consistent with the observations of NGC 5905 (cf. Fig. 9).
Again, a more detailed analysis has to await availability of more sophisticated models. In particular, the flares cannot be standardised. Observations would depend on many parameters, like the type of disrupted star, the impact parameter, the spin of the black hole, effects of relativistic precession, and the radiative transfer is complicated by effects of viscosity and shocks (e.g., Rees 1994).
6.6 Further possibilities
Gravitational lensing event. High magnification factors can be achieved by lensing if the lense lies nearly exactly on the line between observer and source (see Schneider, Ehlers & Falco 1992).666 Ostriker & Vietri (e.g., 1985) and others discussed the possibility to explain the strong and rapid variability of BL Lac objects via gravitational lensing. As a good candidate for lensing, Nottale (1986) presented the BL Lac object 0846+51W1 and successfully modeled the optical lightcurve which varied by about 4m within one month. If the X-ray variability of NGC 5905 was caused by gravitational lensing one would expect the same magnification factor in the optical as in X-rays (assuming emission regions of similar size); and the spectral component observed in the X-ray low-state has to be of different origin then, since the spectral shape changed. This contradicts the optical observations. Gravitational lensing therefore seems to be very unlikely.
X-ray afterglow of a GRB. For completeness, we finally note that within the time interval of the observed X-ray outburst no gamma-ray burst (GRB) has been reported777The possible connection of GRBs with nearby galaxies was discussed by, e.g., Larson et al. (1996), but see Schaefer et al. (1997). Recently, evidence has accumulated that GRBs are extragalactic and may originate in starburst regions of galaxies (e.g., Halpern et al. 1998). For the suggestion that GRBs may be extreme tidal disruption events, see Carter (1992). (the 2 detected GRBs of July 8, 1990, have different positions; Castro-Tirado 1994 on the basis of Granat/WATCH data). We made the same check for IC 3599. No simultaneous GRB is reported. The one nearest the time of the X-ray outburst (Dec. 9, 1990) of Dec. 19, 1990, has a different position.
6.7 Summary of ‘successful’ outburst scenarios
All those models that fullfil the available observational constraints plus the order-of-magnitude estimates presented above involve the presence of a SMBH in the center of the galaxy. A particularly tight constraint is the huge observed outburst luminosity of at least several 1042 erg/s. The actual peak luminosity may even be much higher since (i) we may not have observed exactly at maximum light, (ii) the X-ray spectrum may extent into the EUV, and (iii) there may be excess absorption (we usually assumed ). We favour the scenario of tidal disruption of a star because it can account for the high outburst luminosity, seems to require least fine-tuning, and the long-term X-ray lightcurve shows a continuous fading of the source over the whole measured time interval (Fig. 9). We re-caution, though, that many details of the actual process of tidal disruption of a star and the emitted spectrum are still rather unclear.
7 Discussion: Properties of NGC 5905 in quiescence
7.1 Classification
Since the optical spectra obtained in 1997 (6.7 yr after the X-ray outburst) do not show evidence for an high-excitation emission line component we assume these spectra to represent the properties of NGC 5905 in quiescence. We have carefully searched for signs of permanent low-level Seyfert activity. This question is important in the context of AGN formation and evolution (e.g., Rees 1989), i.e., have we found evidence (via the X-ray outburst) for a SMBH in a galaxy that otherwise appears perfectly non-active to an observer ?888Evidence for a population of non-active galaxies of unusually high X-ray luminosity has occasionally been reported. However, optical follow-up observations revealed signs of Seyfert activity in each spectrum (e.g., Moran et al. 1994, 1996, Wisotzki & Bade 1997).
We find the emission lines to be very narrow, and lowly excited, as typical for HII-type galaxies; we do not detect high-ionization lines like [FeVII], and we do not find any signs for the presence of a broad component in the Balmer lines. (Such a statement, of course, always reflects the current instrumental sensitivity limits.) The same results hold for a pre-outburst optical spectrum given in Ho et al. (1995).
7.2 HII properties
Second, we determine some of the properties of the low-ionization (HII-like) emission line component.
Extinction from Balmer lines. The observed Balmer decrement is above its recombination value, indicative of reddening by dust intrinsic to the emission line gas or within the host galaxy along the l.o.s. Assuming all dust to be located in a screen outside the emission line gas and an intrinsic H/H ratio of 2.7 (Brocklehurst 1971) yields an extinction of = 0.75m for a Galactic extinction law as in Osterbrock (1989).
Density via sulphur ratio. The observed intensity ratio [SII]6716/6731 implies a density of the emission-line gas of cm-3 (Osterbrock 1989), a value typical for HII regions.
Temperature via oxygen ratio. The oxygen intensity ratio [OIII]5007/4363 is unusually high. Taken at face value, it implies a temperature of K; but see Storchi-Bergmann et al. (1996) who find that the strength of [OIII]4363 tends to be overestimated due to a contribution from the galactic stellar spectrum.
7.3 Rotation curve
The velocity curve we obtained (Fig. 4) allows a first rough estimate of the mass enclosed within the central region. The inclination angle of the galaxy is only known with a large uncertainty because NGC 5905 appears nearly face-on. We assume and apply the formula given in Rubin et al. (1997),
| (8) |
with in km/s and R in kpc. These values lead to within 0.7 kpc. HST spectra would allow to improve this limit and thus the constraints on a central dark mass.
8 Discussion: Comparison with IC 3599
Some confusion exists in the literature about the classification of IC 3599 on the basis of optical spectra. The optical (post-outburst) spectrum was classified as Seyfert 2 by G&95, as starburst by Bade et al. (1995) and Grupe (1996), whereas BPF95 classified the (outburst) spectrum as NLSy1-like. We originally selected IC 3599 as a second candidate for a non-active galaxy that showed an X-ray outburst. Below, we comment on the classification on the basis of emission line strengths and profiles derived from our high-resolution spectra.
The emission-line ratios fall on the dividing line between Seyfert and HII galaxies in the diagnostic diagrams of Veilleux & Osterbrock (1987; Fig. 5). However, [OII] is weaker than [OIII] (cf. Fig. 8 of Bade et al. 1995), as typical for Seyferts, whereas HII galaxies (and also LINERs) usually show [OII]/[OIII] 1. HeII is observed in some LINERs (even HII galaxies; e.g. Osterbrock 1989), but the value observed in IC 3599 is very high even for Seyfert 2s (cf. the [OIII]-HeII correlation in Komossa & Schulz 1997). In outburst, the spectrum may share some similarities with a NLSy1 (BPF95), but we note that the small width of the Balmer lines would lead to the expectation of strong Fe II emission (given the general trends seen in NLSy1s), which is not observed.
Concerning line profiles, in our new spectra with higher resolution than previously obtained we find a second broad component in H that argues for a Seyfert 1.9 classification of IC 3599 (at the epoch of observation, and within the ‘standard’ classification schemes). We also note that there is similarity to the ‘composite’ classification of several objects in Moran et al. (1996).
Alternatively, the high-ionization lines as well as broad H may be relics from the outburst. However, the high-ionization lines have not changed in strength as compared to the post-outburst optical spectra of G&95 which may indicate they are permanent. Further monitoring of these emission lines may be worthwhile. But even neglecting line profiles and the high-ionization component, the low-ionization component (particular the weakness of [OII]) still suggests a Seyfert classification.
Our photoionization models for the optical outburst emission lines further corroborate evidence that IC 3599 permanently possesses a BLR or CLR.
In X-rays, the lightcurves of both galaxies are strikingly similar (Fig. 9). A potential problem for the tidal disruption scenario for IC 3599 may be the following, though. If IC 3599 is active and permanently possesses an accretion disk, the disk’s presence may hinder the disruption process.
9 Discussion: Search for, and comparison with, other strongly variable objects
Besides NGC 5905 and IC 3599, non-recurrent X-ray outbursts999 we use the term ‘outburst’ to indicate variability stronger than a factor 50 have been reported for E1615+061 (Piro et al. 1988) and WPVS007 (Grupe et al. 1995b) and repeated variability of large amplitude was found in IRAS 13224 (Otani et al. 1996, Boller et al. 1997). All these latter galaxies are Seyfert galaxies as shown by their optical emission line spectra. Different mechanisms to account for the X-ray variability have been favoured for the active galaxies: A variable soft excess for E1615+061 (Piro et al. 1988, see also Piro et al. 1997) and WPVS007 (Grupe et al. 1995b), relativistic effects in the accretion disk for IRAS 13224 (Brandt et al. 1997, Boller et al. 1997).
It is also interesting to point out the following: high-amplitude variability seems to go hand in hand with the presence of a warm absorber. We performed a search for further cases of strong X-ray variability (Komossa 1997) using the sample of nearby galaxies of Ho et al. (1995) and ROSAT survey and archived pointed observations. We do not find another object with a factor 100 amplitude, but several sources are discovered to be strongly variable (with maximal factors ranging between 10 and 20 in the mean countrates); NGC 3227 (Komossa & Fink 1997c), NGC 4051 (Komossa & Fink 1995) and NGC 3516. All of them are known to harbour warm absorbers (NGC 4051, e.g., Mihara et al. 1994, Komossa & Fink 1997b; NGC 3227, Ptak et al. 1994, Komossa & Fink 1997c; NGC 3516, Mathur et al. 1997). Two further examples are NGC 3786 (Komossa & Fink 1997d) and NGC 3628 (Dahlem et al. 1995; who detect a drop of a factor 20 in ROSAT flux and suggest several different explanations including the possibility of a warm absorber in this object). All of these are known to be Sy galaxies (except NGC 3628) and it is unclear at present, whether there is a direct link between the presence of a warm absorber and strong variability; we do not favour the warm absorber interpretation for the outburst of NGC 5905.
In any case, it is important to note that large-amplitude variability seems to appear in all types of AGN, not only in NLSy1s.
10 Summary and conclusions
We have presented follow-up optical and X-ray observations of NGC 5905 and IC 3599 and discussed outburst scenarios.
Our high-resolution optical spectra do not reveal any signs of Seyfert activity in NGC 5905 and classify the galaxy as HII type, as judged by emission line widths and strengths. In contrast, IC 3599 shows some high-ionization emission lines and evidence for a broad component in H, suggesting a Sy 1.9 classification (at the epoch of observation), although at present we cannot exclude that the broad component is still a relic from the outburst. The optical spectrum of NGC 5905 shows the pattern of a rotation curve, which allowed a first estimate of the mass enclosed within 0.7 kpc: M⊙.
Photoionization modelling of the optical outburst spectrum of IC 3599 implies a gas density of cm-3 and a distance from the nucleus 0.1 pc of the emission line gas illuminated during the outburst and thus corroborates evidence that the galaxy permanently possesses a BLR or CLR.
Optical photometry of NGC 5905 quasi-simultaneous to the X-ray outburst and on longer terms does not reveal optical variability. Constraints on the long-term development of optical brightness after the X-ray outburst could be improved by using the excellent spatial resolution of the HST.
New HRI observations of NGC 5905, performed 6.3 yrs after the outburst, indicate a further drop in X-ray flux by a factor 2 as compared to the last PSPC observation.
Several outburst scenarios have been examined. Tight observational constraints are the giant amplitude of variability, at least a factor 100, and the huge outburst luminosity of at least several 1042 erg/s. All successful models involve the presence of a SMBH. The most likely scenario to explain the X-ray outburst in NGC 5905 seems to be tidal disruption of a star by a central SMBH; a scenario proposed by Rees (1988) as a tracer of SMBHs in nearby galaxies. We caution, though, that many theoretical details of this process are still rather unclear.
Given the absence of any optical signs of Seyfert activity, at present this makes NGC 5905 the only non-active galaxy among the X-ray outbursting ones.
The X-ray outburst in this HII galaxy then lends further support to the scenario that all galaxies passed through an active phase (instead of just a few), leaving dormant SMBHs in their centers.
Acknowledgements.
St.K. acknowledges support from the Verbundforschung under grant No. 50 OR 93065. It is a pleasure to thank C. LaDous and G. Richter at Sternwarte Sonneberg for their kind hospitality and G. Richter for valuable help in the assessment of the photographic plates. We thank Gary Ferland for providing Cloudy; Jochen Greiner, Niel Brandt and Andrew Ulmer for discussions and comments; and Niel Brandt for providing an enlargened copy of Fig. 4 of BPF95. The ROSAT project is supported by the German Bundesministerium für Bildung und Wissenschaft (BMBW/DLR) and the Max-Planck-Society.References
- (1) Abramowicz M.A., Czerny B., Lasota J.-P., Szuszkiewicz E., 1988, ApJ 332, 646
- (2) Bade N., Fink H.H., Engels D., et al., 1995, A&AS 110, 469
- (3) Bade N., Komossa S., Dahlem M., 1996, A&A 309, L35 (paper I)
- (4) Baldwin J., Ferland G., Korista K., Verner D., 1995, ApJ 455, L119
- (5) Binette L, Wilson A.S., Raga A., Storchi-Bergmann T., 1997, A&A 327, 909
- (6) Boller T., Fink H.H., Schaeidt S., 1994, A&A 291, 403
- (7) Boller T., Brandt W.N., Fabian A.C., Fink H.H., 1997, MNRAS 289, 393
- (8) Bräuer H.-J., Fuhrmann B., 1992, ESO Messenger 68, 24
- (9) Brandt W.N., Pounds K.A., Fink H.H., 1995, MNRAS 273, L47 (BPF95)
- (10) Brandt W.N., Mathur S., Elvis M., Boller T., 1997, BAAS 190, 51.02
- (11) Bregman J.N., Pildis R.A., 1992, ApJ 398, L107
- (12) Brocklehurst M., 1971, MNRAS 153, 471
- (13) Bromley B.C., Miller W.A., Pariev V.I., 1998, Nat 391, 54
- (14) Canizares C., Kriss G.A., Feigelson E.D., 1982, ApJ 253, L17
- (15) Carter B., 1992, ApJ 391, L67
- (16) Castro-Tirado A., 1994, Thesis, Copenhagen Univ.
- (17) Dahlem M., Heckman T.M., Fabbiano G., 1995, ApJ 442, L49
- (18) Diener P., Frolov V.P., Khokhlov A.M., Novikov I.D., Pethick C.J., 1997, ApJ 479, 164
- (19) Dickey J.M., Lockman F.J., 1990, ARA&A, 28, 215
- (20) Dressler A., Richstone D.O., 1988, ApJ 324, 701
- (21) Eckart A., Genzel R., 1996, Nat 383, 415
- (22) Eracleous M., Livio M., Binette L., 1995, ApJ 445, L1
- (23) Fabbiano G., 1989, ARA&A 27, 87
- (24) Fabian A.C., Terlevich R., 1996, MNRAS 280, L5
- (25) Ferguson J.W., Korista K.T., Ferland G.J., 1997, ApJS 110, 287
- (26) Ferland G.J., 1993, University of Kentucky, Physics Department, Internal Report
- (27) Ferland G.J., Korista K.T., Verner D.A., et al., 1998, PASP 110, 761
- (28) Frank J., King A.R., Raine D.J., 1985, Accretion power in astrophysics, Cambridge University Press, Cambridge
- (29) Grevesse N., Anders E., 1989, in Cosmic Abundances of Matter, AIP 183, C.J. Waddington (ed.), New York: AIP, 1
- (30) Grupe D., Beuermann K., Mannheim K., et al., 1995a, A&A 299, L5 (G&95)
- (31) Grupe D., Beuermann K., Mannheim K., et al., 1995b, A&A 300, L21
- (32) Halpern J.P., Helfand D.J., Moran E.C., 1995, ApJ 453, 611
- (33) Halpern J.P., Thorstensen J.R., Helfand D.J., Costa E., 1998, Nat 393, 41
- (34) Hills J.G., 1975, Nat 254, 295
- (35) Ho L.C., Filippenko A.V., Sargent W.L.W., 1995, ApJS 98, 477
- (36) Honma F., Matsumoto R., Kato S., 1991, PASJ 43, 147
- (37) Immler S., Pietsch W., Aschenbach B., 1998, A&A 331, 601
- (38) Komossa S., 1997, PhD Thesis, Ludwig-Maximilians-Univ. Munich
- (39) Komossa S., Fink H., 1995, AG Abs. Ser. 12, 227
- (40) Komossa S., Fink H., 1997a, in Accretion Disks – New Aspects, E. Meyer-Hofmeister, H. Spruit (eds.), Lecture Notes in Physics 487, 250
- (41) Komossa S., Fink H., 1997b, A&A 322, 719
- (42) Komossa S., Fink H., 1997c, A&A 327, 483
- (43) Komossa S., Fink H., 1997d, A&A 327, 555
- (44) Komossa S., Schulz H., 1997, A&A 323, 31
- (45) Komossa S., Bade N., 1998, A&A 331, L49
- (46) Kormendy J., Richstone D.O., 1992, ApJ 393, 559
- (47) Kormendy J., Richstone D.O., 1995, ARA&A 33, 581
- (48) Kormendy J., Bender R., Richstone D.O., et al., 1996, ApJ 459, L57
- (49) Laguna P., Miller W.A., Zurek W.H., Davies M.B., 1993, ApJ 410, L83
- (50) Larson S.B., McLean I.S., Becklin E.E., 1996, ApJ 460, L95
- (51) Loeb A., Ulmer A., 1997, astro-ph/9703079, to appear in ApJ
- (52) Mathur S., Wilkes B.J., Aldcroft T., 1997, ApJ 478, 182
- (53) Mihara T., Matsuoka M., Mushotzky R., et al., 1994, PASJ 46, L137
- (54) Moran E.C., Halpern J.P., Helfand D.J., 1994, ApJ 433, L65
- (55) Moran E.C., Halpern J.P., Helfand D.J., 1996, ApJS 106, 341
- (56) Mushotzky R.F., Done Ch., Pounds K.A., 1993, ARA&A 31, 717
- (57) Narayan R., Yi I., 1994, ApJ 428, L13
- (58) Narayan R., Mahadevan R., Quataert E., 1998, astro-ph/9803141, to appear in The Theory of Black Hole Accretion Discs, M. A. Abramowicz, G. Bjornsson, J. E. Pringle (eds.)
- (59) Nottale L., 1986, A&A 157, 383
- (60) Osterbrock D.E., 1981, ApJ 249, 462
- (61) Osterbrock D.E., 1989, Astrophysics of Gaseous Nebulae and Active Galactic Nuclei, Univ. Sci. Books: Mill Valley
- (62) Ostriker J.P., Vietri M., 1985, Nat 318, 446
- (63) Otani C., Kii T., Miya K., 1996, in MPE Report 263, H.U. Zimmermann, J. Trümper, H. Yorke (eds), 491
- (64) Peterson B., Ferland G.J., 1986, Nat 324, 345
- (65) Pfeffermann E., Briel U.G., Hippmann H., et al., 1987, SPIE 733, 519
- (66) Piro L., Massaro E., Perola G.C., Molteni D., 1988, ApJ 325, L25
- (67) Piro L., Balucinska-Church M., Fink H., et al., 1997, A&A 319, 74
- (68) Ptak A., Yaqoob T., Serlemitsos P.J., Mushotzky R., Otani C., 1994, ApJ 436, L31
- (69) Radovich M., Rafanelli P., 1994, Astron. Nachr. 315, 265
- (70) Rauch K.P., Ingalls B., 1998, MNRAS 299, 1231
- (71) Rees M.J., 1988, Nat 333, 523
- (72) Rees M.J., 1989, Rev. mod. Astr. 2, 1
- (73) Rees M.J., 1990, Science 247, 817
- (74) Rees M.J., 1994, in Nuclei of normal galaxies, R. Genzel & A.L. Harris (eds), Kluwer, 453
- (75) Renzini A., Greggio L., Di Serego Alighieri S., et al., 1995, Nat 378, 39
- (76) Rubin V.C., Kenney J.D.P., Young S.Y., 1997, AJ 113, 1250
- (77) Schaefer B., Cline T., Hurley K., Laros J., 1997, to appear in ApJ, astro-ph/9704278
- (78) Schlegel E.M., 1995, Rep. Prog. Phys. 58, 1375
- (79) Schneider P., Ehlers J., Falco E., 1992, Gravitational Lenses, Springer-Verlag: Berlin
- (80) Sembay S., West R.G., 1993, MNRAS 262, 141
- (81) Shull J.M., 1980, ApJ 237, 769
- (82) Storchi-Bergmann T., Wilson A.S., Mulchaey J.S., Binette L., 1996, A&A 312, 357
- (83) Tanaka Y., Nandra K., Fabian A.C., et al., 1995, Nat 375, 659
- (84) Tonry J.L., 1987, ApJ 322, 632
- (85) Terlevich R., Tenorio-Tagle G., Franco J., Melnick J., 1992, MNRAS 255, 713
- (86) Trümper J., 1983, Adv. Space Res. 2, 241
- (87) Trümper J., 1990, Phys. Bl. 46, 137
- (88) Ulmer A., Paczynski B., Goodman J., 1998, A&A 333, 379
- (89) van der Marel R.P., de Zeeuw P.T., Rix H.-W., Quinlan G.D., 1997, Nat 385, 610
- (90) Veilleux S., Osterbrock D.E., 1987, ApJS 63, 295
- (91) Vogler A., 1997, PhD Thesis, TU Munich
- (92) Wheeler J.C., Mazurek T.J., Sivaramakrishnan A., 1980, ApJ 237, 781
- (93) Wisotzki L., Bade N., 1997, A&A 320, 395
- (94) Yegiazarian, Khachikian, 1988, Soob. Byurakan, Spets. Astrofiz. Obs. 60, 3
- (95) Zimmermann H.U., Becker W., Belloni T., et al., 1994a MPE Report 257
- (96) Zimmermann H.U., Lewin W., Predehl P., et al., 1994b, Nat 367, 621