The N V/C IV ratio in high redshift radio galaxies
Abstract
Deep Keck spectropolarimetry has been obtained of a sample of powerful radio galaxies with . In addition to a clear 2200Å dust scattering/extinction signature and an inverse correlation between the degree of continuum polarization and the Lyman- emission line strength (relative to C IV), we find an intriguing positive correlation between the N V/C IV ratio and the polarization. The line ratio, which varies by almost a dex amongst objects having a very similar ionization state, is most likely to indicate an abundance ratio. We speculate that the correlation with polarization represents a connection between nitrogen enhancement and dust production following a major starburst event connected with the birth of the quasar.
1 Introduction
Our current belief is that the hosts of powerful radio sources in the distant Universe are destined to become the giant ellipticals of today: the most massive galactic systems we know. While some may have commenced their formation at very high redshift, it is clear that the process of assembly is very active at . This corresponds to the epoch when quasars appear to have had their maximum space density (Dunlop 1994). Indeed, a major goal of our programme is to understand the causal relationship between the formation of the massive black hole and that of the galaxy within which it resides. Our approach has been to identify, catalogue and measure the components which contribute to the observed spectral energy distribution of active galaxies at different redshifts. The realisation that reprocessed AGN radiation makes a very significant contribution to the blue and ultraviolet spectrum indicated how difficult it is to measure the stellar population in the galaxy using these regions of the restframe spectrum. The energetic radiation, and perhaps mechanical energy, from the hidden quasar does however illuminate and excite the host’s ISM and — provided we understand the physics of the ionization processes — gives us a unique opportunity to analyse this important constituent of the galaxy.
Our approach of observing radio galaxies rather than the hosts of objects classified as quasars relies on the now well-justified assumption that these are similar objects viewed from different directions. The presence of very opaque material in the nuclear regions of the galaxy results in a ‘natural coronograph’ which greatly facilitates the study of the underlying stellar galaxy and its ISM. The use of spectropolarimetry to study the scattered radiation from the hidden quasar in radio galaxies has shown that the reprocessed AGN light is a major contributor to the ‘alignment effect’ (eg. Tadhunter et al. 1988; Cimatti et al. 1993; di Serego Alighieri et al. 1993, 1994; Jannuzi et al. 1995). The combination of spectroscopic and polarimetric measurements is a powerful discriminant between such reflected AGN radiation and stellar and nebular continua arising on a galactic scale.
2 The sample
We have selected powerful RG with which allow us to study in visible light the strong UV emission lines from Ly- to CIII], the UV continuum, the resonance absorption lines from the ISM and from OB stars and the 2200Å dust feature and also to straddle the 4000Å break in the 1–2m band.
| OBJECT | REDSHIFT |
|---|---|
| 4C+03.24 | 3.570 |
| MRC 0943-242 | 2.9 |
| USS 0828+193 | 2.572 |
| 4C+23.56a | 2.482 |
| B3 0731+438 | 2.429 |
| 4C-00.54 | 2.366 |
| 4C+48.48 | 2.343 |
| TXS 0211-122 | 2.338 |
| 4C+40.36 | 2.265 |
| 4C+41.17 | 3.798 |
| FSC10214+4724 | 2.282 |
| MRC 2025-218 | 2.63 |
| 3C 256 | 1.824 |
Our principal sample constists of nine objects with and this is suplemented by four sources from the literature having similar quality data but extending the redshift range to . More data are currently being obtained on sources with .
3 Observations
The Keck spectropolarimetric observations for the first two sources in the programme are described in Cimatti et al. (1998). The observational procedure for the remaining sources was similar and resulted in total exposure times ranging from 4–8 hr per source.
The HST WFPC 2 and NICMOS images, where available, were taken from the public archive at the ST-ECF and from the McCarthy et al. program (ID 7498). These are being compared with the one dimensional line and continuum extensions measured from the spectra.
4 Results
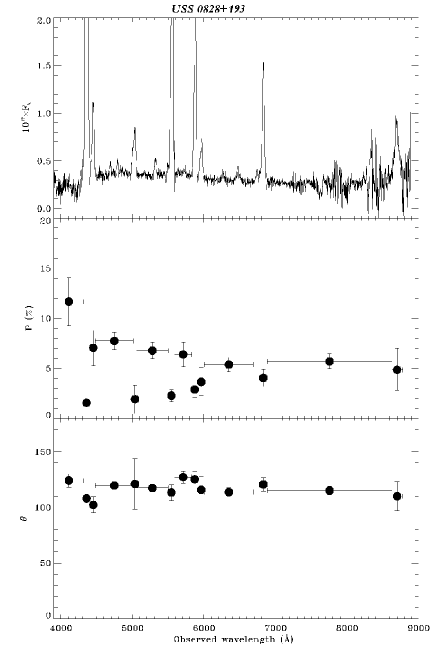
The spectropolarimetry gives us line and continuum polarization measurements with good s/n, ranging up to 20 or so in the continuum longward of Ly- for the highly polarized sources. The measured fractional polarizations range from % to nearly 20%. A source with an intermediate polarization in our sample, USS 0828+193, is illustrated in Figure 1. The narrow emission lines have lower polarization than the continuum. In the average spectrum of our sources, the broad lines can be seen clearly in the polarized flux with equivalent widths similar to those seen in quasars. The position angle of the electric vector is perpendicular to the UV extensions in the images which usually, but not invariably, corresponds to the radio axis. The continuum polarizations generally increase slightly to shorter wavelengths.
The first new result concerns the continuum spectrum of the objects. In the restframe, the spectra have a rather uniform and characteristic shape with a peak (in ) just longward of Ly- and a shallow minimum near 2200Å. This is discussed further in the contribution by Vernet et al. (1999) in these proceedings and can be explained, with remarkable precision, by reflecting an average quasar spectrum in a scattering ‘atmosphere’ containing standard Galactic dust. The dust grains scatter and absorb in such a way that the reflected light is maximised when . Such a process results in approximately ‘grey’ scattering but the difference between and results in the imposition a 2200Å signature onto the spectrum. This is clearly distinct from the Fe II emission feature just longward of this wavelength which is a characteristic of quasar spectra. The precision of the fit of this simple one parameter model (the fraction of the quasar light which is scattered) to the observed spectra leaves little room for other sources of continuum such as a young stellar population which Vernet et al. (1999 and in prep.) show must be less than about 20% of the reflected light.
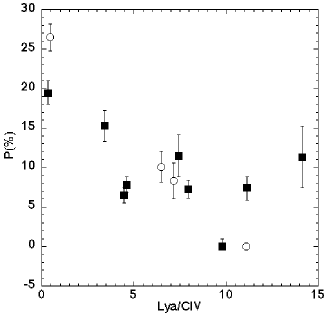
The second result is a clear anticorrelation between the strength of the Ly- emission line (relative to C IV) and the continuum polarization, illustrated in Figure 2. While it is likely that this is a consequence of the resonant destruction of Ly- photons by the dust grains which scatter the polarized light we observe, the detailed explanation will involve an understanding of the geometric details and will not be discussed further here.
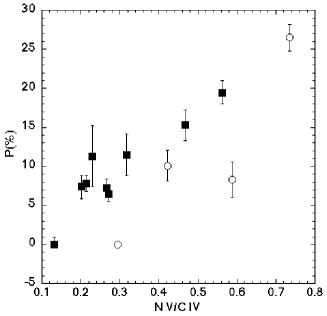
The third result, and the principal subject of this talk, concerns the behaviour of the N V resonance line at 1240Å. While both the continuum colours and the relative strengths of the strong emission lines of C IV, He II and C III] show very little variation amongst the objects in our sample, there is — in addition to the Ly- effect discussed above — a large variation in the ratio of N V to C IV. This variation is correlated with the continuum polarization in the sense that the strongly polarized sources have a large N V/C IV ratio as shown in Figure 3. Such a large range in this ratio, in objects with such constant C III], C IV and He II lines, cannot readily be explained as an ionization effect and must indicate a genuine abundance effect.
5 Discussion
Although the continuum and emission line regions in the radio galaxies are well resolved (several arcseconds 10’s of kpc), this behaviour of N V/C IV is reminiscent of the behaviour in high redshift QSO broad line regions discussed by Hamman & Ferland (1993). Indeed, our radio galaxies form a parallel sequence to the QSOs in their N V/C IV – N V/He II diagram. They explain the distribution of BLR ratios in this diagram as variations in the metallicity of the gas resulting from rapid chemical evolution in the massive host galaxies involving an IMF biassed to more massive stars than characteristic of our Galactic disk. Our result shows that the abundance variations in these massive systems are not restricted to the small amount of gas associated with the AGN BLR but pervade a significant fraction of the ionized ISM.
If the correlation of N V/C IV with continuum polarization cannot be explained as a subtle effect of orientation or geometrical configuration, then we may be witnessing a direct relationship between dust and primary nitrogen production in a population of massive stars. Such evolution would occur on the very rapid timescale of tens of millions of years and the variations we see in our sample may represent this ‘micro-evolution’. It is the stage at which the process is illuminated by the AGN — presumably fed by the same event that triggers the star formation — which determines the global state of the ISM as we observe it. Thus, rather than observing directly the light from a young stellar population which is hidden by the glare of the quasar, we can observe the chemical effects of the starburst through the properties of the ISM. The ability to measure emission lines in the resframe optical spectrum with the new large telescope infrared spectrographs will be crucial in this analysis.
Acknowledgments We thank Francesca Matteucci, Jay Gallagher and Alvio Renzini for discussions. RAEF is affiliated to the Astrophysics Division of the Space Science Department, European Space Agency.
References
- [1] Cimatti, A., di Serego Alighieri, S., Fosbury R.A.E., Salvati, M., & Taylor, D., 1993, MNRAS 264, 421
- [2] Cimatti, A., di Serego Alighieri, S. Vernet, J., Cohen, M.H., & Fosbury R.A.E., 1998, ApJ, 499, L21
- [3] di Serego Alighieri, S., Cimatti, A., & Fosbury R.A.E., 1993, ApJ 404, 584
- [4] —, 1994, ApJ, 431, 123
- [5] Dunlop, J.S., 1994, in Frontiers of Space and Ground-Based Astronomy, Wamsteker et al. (eds), p. 395, Kluwer
- [6] Hamman, F. & Ferland, G., 1993, ApJ, 418,11
- [7] Jannuzi, B.T., Elston, R., Schmidt, D.T., Smith, P.S. & Stockman, H.S., 1995, ApJ, 454, L111
- [8] Tadhunter, C.N., Fosbury R.A.E., & di Serego Alighieri, S., 1988, in proc. Como Conference: BL Lac objects, 10 years after, L. Maraschi et al. (eds.), Springer, p79
- [9] Vernet et al., 1999, these proceedings