Low-mass binaries in the young cluster IC 348: implications for binary formation and evolution††thanks: Based on observations made with the Canada-France-Hawaii Telescope, operated by the National Research Council of Canada, the Centre National de la Recherche Scientifique de France and the University of Hawaii
Abstract
We report on a near-infrared adaptive optics survey of a sample of 66 low-mass members of the pre-main sequence stellar cluster IC 348. We find 12 binary systems in the separation range –8′′, excluding 3 probable background projected companions. An estimate of the number of faint undetected companions is derived, before we evaluate the binary frequency in this cluster. In the range 5.0–7.9 days, the binary fraction in IC 348 is %. This is similar to the values corresponding to G- and M-dwarfs in the solar neighbourhood population ( % and %, respectively). Furthermore, the distribution of orbital periods of IC 348 binaries in this range is consistent with that of field binaries. We conclude that there is no binary excess in IC 348.
Substellar companions are found to be rare, or even missing, as companions of low-mass stars in the separation range we surveyed. Also, the mass ratio distribution is not peaked at in IC 348, and it is unlikely that an observational bias can account for that.
We do not find any evidence for an evolution of the binary frequency with age within the age spread of the cluster of about 10 Myr. Comparing the binary frequency in IC 348 with that of other star forming regions (SFRs) and young open clusters, we conclude that there is no significant temporal evolution of the binary fraction between a few Myrs after the formation process and the zero-age main sequence (ZAMS) and field populations. We find instead a trend for the binary fraction to be inversely correlated with stellar density, with dense clusters having a binary fraction similar to that of field dwarfs and loose associations exhibiting an excess of binaries. Two scenarios can be suggested to explain these differences: either all SFRs, clusters and associations alike, initially host a large number of binaries, which is subsequently reduced only in dense clusters on a timescale of less than 1 Myr due to numerous gravitational encounters, or specific initial conditions in the parental molecular clouds impact on the fragmentation process leading to intrinsically different binary fractions from one SFR to the other.
Key Words.:
binaries: visual – stars: pre-main sequence – stars: imaging – stars: late-type – stars: formation1 Introduction
Several studies in the early 90s have shown that binarity is a very common property of low-mass main sequence stars: about 53% of G-type stars, 45% of K-dwarfs and 42% of M-dwarfs are in fact multiple in the solar neighbourhood (Duquennoy & Mayor duq_may:1991 (1991), hereafter DM91; Mayor et al. mayor:1992 (1992); Fischer & Marcy fischer_marcy:1992 (1992)). An important issue for current star formation models is to account for the high number of binaries, and to predict their physical properties.
The relative number of binary systems may be even larger among much younger stellar populations. One of the best studied low-mass SFRs, the Taurus-Auriga dark cloud, hosts almost twice as many binaries as the solar neighbourhood in the separation range 2–2000 AU (Leinert et al. leinert:1993 (1993); Ghez et al. ghez:1993 (1993); Simon et al. simon:1995 (1995)). Yet, subsequent surveys of a number of other SFRs have led to somewhat conflicting results: while some exhibit binary excesses comparable to that of the Taurus cloud (Padgett et al. padgett:1997 (1997); Ghez et al. ghez:1997 (1997)), others appear to have similar binary fractions as field dwarfs (Brandner et al. brandner:1996 (1996). For instance, the Orion Trapezium shows a binary fraction in good agreement with that on the MS (Petr et al. petr:1998 (1998); Prosser et al. prosser:1994 (1994)). Duchêne (duchene:1998bin (1998)) recently reanalysed in a consistent way these various studies and confirmed that the binary fraction appears to vary from one SFR to the other, with the main exception of all Orion clusters whose binary fraction is similar to that of the field.
Several proposals have been made to account for these results. It has been suggested that the fragmentation process during the protostellar collapse yields a high fraction of multiple systems which, however, steadily declines over time as multiple systems are disrupted during their subsequent evolution (Ghez et al. ghez:1993 (1993)). Then, the binary fraction would depend on the age of the stars and would vary over a timescale of several 100 Myr (Patience et al. patience:1998 (1998)). Alternatively, it is conceivable that the binary fraction of a cloud is established at the very beginning of the cluster history. Kroupa (1995a ; 1995b ) has recently shown from -body simulations that in regions as dense as the Trapezium cluster the binary fraction could decrease from 100% to about 50% in less than 1 Myr due to gravitational encounters. Still another possibility is that the binary frequency is sensitive to environmental conditions in the parental molecular cloud. In a qualitative study, Durisen & Sterzick (durisen_sterzik:1994 (1994)) found that both the current fragmentation models and disk instabilities are compatible with a lower binary fraction in clouds with higher temperatures.
In order to distinguish between these alternatives, we started a long-term project aimed at studying binaries in clusters at different evolutionary stages, from the birthline to the MS. In Bouvier et al. (bouvier:1997 (1997)), we already found that the binary frequency in the 100 Myr old Pleiades cluster is similar to that of the MS. We report here the results obtained in the pre-main sequence (PMS) cluster IC 348. This cluster was selected on the basis of its age being similar to that of the Taurus cloud (about 2 Myr), but its stellar density being much larger (about 500 stars pc-3 compared to a few stars pc-3 for Taurus).
IC 348 is a young cluster located in the Perseus molecular cloud, at a distance of about 320 pc (Herbig herbig:1998 (1998), hereafter H98). It hosts a B5 V star (BD+31∘643), about 100 optical sources (Trullols & Jordi trullols_jordi:1997 (1997)), as well as a few hundred infrared sources, which are probably embedded young stars (Lada & Lada lada_lada:1995 (1995)). The age of this cluster has been estimated by several methods: Lada & Lada, by fitting the IMF, estimate that star formation is still going on after a burst 5–7 Myr ago; Luhman et al. (luhman:1998 (1998)), hereafter L98, found that a major burst occured Myr ago, but that stars as old as 10 Myr also lie in the cluster. Similarly, from a dereddened colour-magnitude diagram, H98 estimates ages ranging from less than 1 Myr and up to about 10 Myr for about 100 members, with a median age of Myr. From a deep near-infrared survey, Lada & Lada estimated a stellar density of about 500 stars pc-3 or 220 pc-3 (within the half-mass radius of 0.47 pc), and a projected surface density of about 1000 stars pc-2 in the central 0.1 pc, similar to the NGC 2024 cluster in Orion. H98 also evaluated masses for the members, and found that the median mass is about 0.5, in agreement with the IMF estimated for this cluster (which is very similar to the IMF from Scalo scalo:1986 (1986)). Furthermore, H98 conducted an H survey, and discovered over 110 emission-line stars in a area centred on the cluster; all of these stars are very likely to be young, active cluster members; about 70 of them have independently been confirmed as members on the basis of colour-magnitude diagrams. Preibisch et al. (preibisch:1996 (1996)) performed a systematic X-ray survey of the area, detecting over 110 sources within a 1∘-radius circle.
We report on our adaptive optics observations of IC 348 in Sect. 2, and estimate the binary fraction in the cluster in Sect. 3. In Sect. 4 we discuss various other binary properties (especially the scarcity of brown dwarf companions in our survey), and Sect. 5 presents a discussion on the link between the binary fraction and environmental conditions in SFRs. Sect. 6 summarizes our conclusions.
2 Observations
Our sample was selected from H98’s list: all stars brighter than were observed, with a 75% completeness level at ; overall, the survey is two-third complete at the limit. Mosaicing with small offsets from the brightest stars, about 25 additional fainter stars were surveyed. In total, we observed 70 of H98’s members (within 66 independent systems); we also observed 24 stars for which H98 could not assess membership. Ten of these stars are considered as members by L98, on the basis of the detection of the Li Å absorption line and of spectral classification (for late M stars).
The observations were obtained during four nights in December 1997 at the Canada-France-Hawaii Telescope on Mauna Kea. We performed near-infrared (), high angular resolution imaging using the Adaptive Optics Bonnette and the new infrared camera KIR, a HAWAII detector. The pixel scale is /pix, yielding a total field-of-view of . Most of the images are diffraction-limited in and , but the images of the faintest stars or those observed at large offsets from the wavefront star (), have FWHM as large as ; Fig. 1 illustrates the image quality in our survey. We surveyed each target in , and all resolved systems were also observed in and (with the exception of pairs formed by two stars already known as members). A typical observing sequence consists of 16 images, at 4 positions, with individual exposure times ranging from 2 to 30 seconds to avoid saturation of the sources. On the first night, the observing procedure was different, since we produced mosaics centred on the brightest stars close to the cluster centre. In these images, the exposure time was such that no star was saturated; the 5 detection limit in these images is about . For all but two H98 members (IfA 134 and 163), this leads to a detection limit of at least mag for separations larger than .


UKIRT photometric standards were observed every night for the flux calibration. Data reduction was performed with IRAF packages. Astrometry and relative photometry of binaries were obtained by PSF fitting and then combined with large-aperture photometry to get the absolute photometry of each component. In two cases (IfA 100, 102) deconvolution had to be applied to obtain the relative photometry; we used the Iterative Deconvolution Analysis in C (IDAC) routine (Jefferies & Christou jefferies_christou:1993 (1993)), and cross-checked with the Lucy algorithm. In the case of IfA 184, deconvolution was unsuccessful in the band, and we consider here the results from PSF fitting, although we think that this method leads to an underestimate of the flux ratio in this specific case. Estimates of the uncertainties are 0.05 mag and 0.02 mag for absolute and relative photometry, for the separation and for the position angle. The errors are slightly larger when deconvolution was applied; when the adaptive optics system was locked on a binary system (e.g., IfA 139–140), the PSF was substantially deformed, leading to increased uncertainties on the centroid locations.
3 Binary fraction in IC 348
Our binary candidates are listed in Table 1, together with their astrometric and photometric measurements. To accept two stars as a binary candidate, we have set an upper limit for the separation of 8′′, corresponding to 2500 AU. This limit should avoid confusion between real companions and background stars (see discussion below). A case-by-case study has been done, however, for each binary candidate. All the stars that appeared as singles are listed in Table 2. The astrometry for the binaries detected by H98 in the band agrees with ours to within and 2∘, even for the closest pairs (IfA 136 and 211). We failed to detect the faint companion away from IfA 159, because the latter is a faint star (, ), which was observed in a mosaic on the first night, with a more limited dynamic range compared to that usually achieved on other stars. At the 5 level, the companion is fainter than and mag or, equivalently, the binary flux ratio is larger than 2.9 mag in both bands.
| IfA | P.A. (∘) | |||||||||
| Probable member binaries | ||||||||||
| 48–49 | 12.41 | 0.99 | 1.343 | 112.4 | 0.2 | 0.50 | ||||
| 85–82 | 11.70 | 1.89 | 3.086 | 289.2 | 0.4 | 0.26 | ||||
| 1021 | 12.29 | 11.25 | 11.10 | 0.690.05 | 0.670.05 | 0.620.05 | 0.260.01 | 357.00.5 | 0.4 | 0.62 |
| 119 | 12.16 | 11.30 | 11.00 | 0.63 | 0.67 | 0.65 | 0.249 | 254.0 | 0.3 | 0.62 |
| 1362 | 13.43 | 12.63 | 12.33 | 0.740.04 | 0.750.04 | 0.710.04 | 0.700.03 | 2141 | 0.2 | 0.59 |
| 139–140†2 | 9.17 | 0.260.04 | 1.230.03 | 861 | 1.4 | 0.83 | ||||
| 144–143 | 9.99 | 9.21 | 1.01 | 0.73 | 5.371 | 338.3 | 1.4 | 0.60 | ||
| 157–158 | 10.32 | 9.52 | 9.01 | 0.95 | 0.72 | 0.46 | 4.321 | 101.0 | 0.5 | 0.60 |
| 166† | 9.09 | 8.33 | 8.11 | 2.04 | 1.49 | 1.24 | 0.559 | 151.3 | 0.35 | |
| 1843 | 9.95 | 9.07 | 8.70 | 2.55 | 1.84 | 2.08 | 0.409 | 349.7 | 0.4 | 0.27 |
| 1921 | 12.97 | 12.41 | 1.350.05 | 0.870.05 | 0.130.01 | 186.60.5 | 0.2 | 0.38 | ||
| 211 | 12.23 | 10.84 | 10.46 | 1.52 | 1.48 | 1.40 | 1.028 | 155.6 | 0.7 | 0.35 |
| 261–104 | 8.63 | 1.46 | 6.529 | 312.6 | 1.9 | 0.36 | ||||
| TJ 81†2 | 6.76 | 6.53 | 6.51 | 0.200.04 | 0.140.04 | 0.140.04 | 0.610.03 | 161 | 0.91 | |
| Probable background companions and non-member primaries | ||||||||||
| 20–21 | 9.63 | 1.88 | 2.129 | 112.4 | ||||||
| 1001 | 14.63 | 13.71 | 13.49 | – | – | 0.620.05 | 0.130.01 | 100.70.5 | ||
| 1244 | 10.92 | 5.380.07 | 2.536 | 103.2 | ||||||
| 1374 | 10.63 | 9.86 | 5.860.09 | 5.030.08 | 6.734 | 314.5 | ||||
| LkH864 | 11.03 | 7.440.09 | 2.588 | 339.2 | ||||||
1 deconvolved images – 2 AO locked on a binary system – 3 poor PSF fitting in – 4 background companion – † stars identified as members by L98.
| IfA numbers of single stars | ||||||||||||||||
| 14 | 41 | 43 | 57 | 61 | 67 | 70 | 78 | 80 | 83 | 89 | 93 | 94 | 103 | 106 | 107 | 114 |
| 116 | 118 | 121 | 126† | 127† | 128† | 131 | 134 | 142 | 145 | 146 | 147 | 148 | 152 | 154 | 155 | 156† |
| 159 | 160 | 163 | 165 | 167 | 169 | 170 | 171 | 173 | 178 | 179 | 181 | 182 | 183 | 185 | 186† | 187 |
| 190 | 191† | 193 | 197 | 205 | 206 | 210 | 220† | 252 | 253 | 254 | 255 | LkH96 | LkH97 | |||
| LkH98 | LkH100 | TJ 89† | ||||||||||||||
† stars identified as members by L98.
Fig. 2 shows the magnitude difference in the band as a function of separation for detected binaries. The solid and dotted lines show the detection limit of our survey, estimated in two different ways: the solid histogram was established by adding faint stars around single targets and visually inspecting the images. Since it corresponds roughly to a 5 peak detection, it lies 0.5 to 1 mag above the dotted line, which represents the 3 noise level as measured on the PSFs of single stars in our images. At large distances from the primaries (), companions can be detected down to mag fainter than the primaries. In some cases, even somewhat fainter stars can be detected. The fainter stars observed in the mosaics on the first night were observed with smaller signal-to-noise ratios. The detection limit at large separations is thus poorer for these stars than in Fig. 2; close to the primaries, however, the detection limit remains roughly unchanged, since the limitation comes primarily from photon noise.
Despite a large dynamic range in our images, we found only 3 secondaries with , with in fact . The location of the widest of these companions (marked ”back.” in Fig. 2) in a – diagram indicates that it is a background star, lying well away from all known cluster members. The two other very faint companions (marked ”back.?”) are also likely background stars, although we lack multicolour photometry to prove it. For the binary IfA 139–IfA 140, we only have photometry available; we believe it is a physical binary, however, because of its close separation. The membership of IfA 140 could not be determined by H98 since no band photometry was obtained for this star; L98 classify it as a member. Similarly, IfA 82 lacks measurement in H98’s study, so that its membership is not decided. We consider, however, the pair IfA 85–IfA 82 as a physical binary, because of the late spectral type of IfA 82 (M4, H98). For all other systems, the location of the companions in a – diagram suggests membership and thus physical association with the primary.
| sep. range (′′) | 0.1–0.2 | 0.2–0.3 | 0.3–0.5 | 0.5–0.75 | 0.75–1.0 | 1.0–2.0 | 2.0–8.0 | 0.1–8.0 |
|---|---|---|---|---|---|---|---|---|
| orbital period (log(d)) | 5.0–5.4 | 5.4–5.7 | 5.7–6.0 | 6.0–6.3 | 6.3–6.5 | 6.5–6.9 | 6.9–7.8 | 5.0–7.8 |
| (mag) | 2.0 | 2.5 | 3.0 | 4.0 | 5.0 | 6.0 | 6.5 | |
| 0.24 | 0.17 | 0.12 | ||||||
| fraction missed | 22% | 9% | 3% | – | – | – | – | 4% |
| detected companions | 1 | 2 | 1 | 1 | 0 | 3 | 4 | 12 |
| corrected companions | 1.3 | 2.2 | 1.0 | 1 | 0 | 3 | 4 | 12.5 |
| IC 348 binary fraction (%) | 6.83.4 | 6.13.0 | 6.13.0 | 18.95.3 | ||||
| G-dwarf fraction (%) | 10.61.2 | 7.40.8 | 5.20.6 | 23.12.6 | ||||
Close to the primaries, it is difficult to detect very faint companions, because of the wings of the PSF: below , only binaries with flux ratios can be resolved. To calculate the actual binary fraction in IC 348, we need to estimate the number of fainter, undetected secondaries at these separations. The method we use, fully described in Bouvier et al. (bouvier:1997 (1997)) for their survey of the Pleiades, consists in estimating the detection limit in several separation bins (chosen such that it is roughly constant within each bin); this flux ratio limit is then converted into a limiting mass ratio using the mass-luminosity relationship for 2 Myr-old stars from Baraffe et al. (baraffe:1998 (1998)). Finally, it is assumed that the mass ratio distribution observed by DM91 in the solar neighbourhood for G-dwarf binaries applies to IC 348 binaries. Then, the limiting mass ratio can be transformed into a fraction of missed companions. Because of the young age of the cluster: a mass ratio of , which is the limit of the DM91 survey, corresponds to mag at 2 Myr. It can be seen, from Fig. 2, that we reached this flux ratio over almost the entire range of separation considered. For the innermost , where the limiting flux ratio of our observations is slightly smaller, companions close to the limit remain undetected. Therefore, the overall correction is small, with only about 4% of the companions missed. We estimate the number of such companions per bin of separation in Table 3. The mass ratio distribution of M-dwarfs may be flatter than that of G-dwarfs (Fischer & Marcy fischer_marcy:1992 (1992); Reid & Gizis 1997a ), leading to a different estimation of the completeness correction. However, a flatter distribution implies that we have missed even less companions (the number of binaries with small is smaller), so that our estimate of the number of missed companions can be considered as a conservative upper value.
In Table 3, we also estimate the MS binary fraction (”G-dwarf fraction”) in different separation ranges by integrating the binary distribution from DM91. This is the number of binaries as a function of the orbital period. For IC 348 binaries, we only have the angular separation between both components. Therefore, we need to convert these separations into orbital periods. We use the distance to the cluster and a statistical correction for the projection of the semi-major axis on the sky (, where is the actual semi-major axis and is the apparent separation, Reipurth & Zinnecker reipurth_zinnecker:1993 (1993)). We also assume that the average total mass of a system is 1 (mean value for the observed binaries); a typical mass of 5 was assumed for BD+31∘643. Small changes in the assumptions about the distance to the cluster, the projection correction, and the stellar masses do not change the results significantly, since the MS orbital period distribution is very broad: a small shift in the integration boundaries does not significantly modify the binary fraction in this range.
The overall binary fraction (number of companions per observed target) in IC 348 is % in the separation range 40–3200 AU; here, linear separations have been corrected to account for projection effects. It is not modified if L98’s members are included. From DM91, we evaluate that the MS G-dwarf binary fraction over the same range is %. M-dwarfs have a binary fraction of about 18% over the same separation range (Fishcer & Marcy fischer_marcy:1992 (1992)), again very similar to IC 348. We checked that the presence of a few stars with early spectral type (earlier than K0) in our sample does not bias our results: the binary fraction in the subsample of stars with spectral type later than K0 is %, indistinguishable of that of the whole sample.
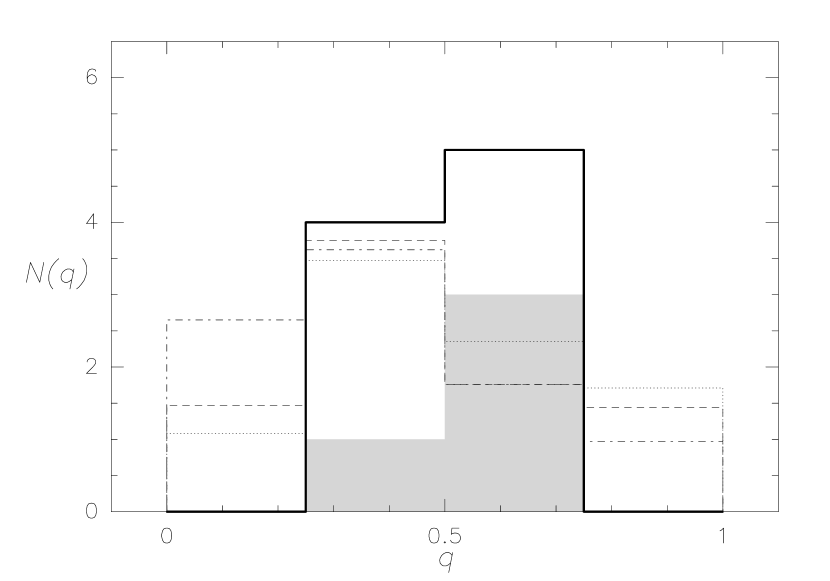
The orbital period distribution of IC 348 binaries is shown in Fig. 3. The comparison with the MS for each bin of the histogram is also given in Table 3. Both the plot in Fig. 3 and the similar values for the binary fraction in the three separation ranges in Table 3 demonstrate that the observed distribution is rather flat and, within the errors, not different from the MS distribution. It is again noticeable that the results are not strongly modified if we include or exclude higher mass stars or L98’s members. We will now only consider H98 members, for which masses and ages have been determined.

To evaluate the impact of possible background stars, we estimated the binary fraction over a smaller separation range, with an upper limit set at 2′′ (640 AU). In this case, the binary fraction for IC 348 and the MS are respectively % and %, i.e. similar values, possibly with a small deficiency in IC 348. This suggests that the number of false detections is small in the separation range we selected. On the other hand, in the range 8–16′′, we find 6 “companions”, that is a binary fraction of %, while the MS value is %. Furthermore, the only companion in this separation range for which we have two-colour photometry appears to be a background star. This supports our choice for the upper limit: larger values would imply a non-negligible background star contamination (unless the period distribution were different from that in the MS, with a peak at much larger separations). Using the stellar density in the off-field image from Lada & Lada (lada_lada:1995 (1995)) without any correction for extinction (i.e., overestimating the number of background companions), we expect about 4 false detections, similar to our findings. On the other hand, one has to determine the occurence of projection pairing of two members. The projected stellar density of the cluster can be crudely estimated from Lada & Lada (lada_lada:1995 (1995))’s survey. Once field star contamination is substracted, they are left with an average density of stars/′′2, implying a total of about 3 members chance projection in the range –8′′. The pair IfA 261–IfA 104 is a good candidate for such a projection effect, since two other members (IfA 106 and 107) lie within 15′′ away from IfA 261. We do not try to correct for this effect since we lack a local estimate of the stellar density around each binary candidate.
4 Binary properties in IC 348
Various properties of stars, especially of PMS objects, depend on the stellar environment. The presence of a companion in the vicinity of a star modifies this environment in a non-negligible way. Potentially, this can affect the physical properties of the stars in multiple systems. In Sect. 4.1 we first consider the fact that we have not found any triple or higher order multiple system. Then, the activity properties of binaries are compared to those of single stars (Sect. 4.2). Finally, our non-detection of very small mass ratios () is discussed in Sect. 4.3, as well as the absence of candidate brown dwarfs.
4.1 High order multiple systems
In our survey, we have found 12 binaries, but no triple or quadruple systems. Does this mean that there is a deficiency of higher order multiple systems in IC 348?
In the solar neighbourhood, G-dwarfs host roughly 10 binaries for 1 triple system, and 4 triple systems for each quadruple system (DM91). Systems with more than two stars are thus quite rare. For Taurus PMS stars, Leinert et al. (leinert:1993 (1993)) find a ratio of binaries to higher order multiples of about 8:1, showing that the number of triples and quadruples does not seem to evolve significantly from PMS to MS stages. If we assume that this ratio of 10 to 1 is also relevant for IC 348, then we would have expected to find one triple system, which is not statistically different from our findings, given the small numbers involved.
There may be a second reason why we failed to detect triple systems. These systems are usually hierarchical (in both MS and PMS populations), with a close system surrounded by the orbit of a third star lying further away. Usually, the ratio of the two semi-major axes in triple systems is at least 5 (Tokovinin tokovinin:1997 (1997)). Given the distance to IC 348, the peak of the orbital period distribution corresponds roughly to the smallest separation we can resolve (see Fig. 3), and most of the triple systems that have been detected in other SFRs have their orbits on both sides of this peak. Therefore, in IC 348, triples may just appear as wide binaries, with the close binary system remaining undetected.
The absence of any triple system from our sample most likely is not an indication for a different binary-to-triple ratio between IC 348 and the MS; it is probably due to the distance to the cluster and to statistical uncertainties.
4.2 Stellar activity in binary systems
Several indicators of T Tauri star activity have been identified so far. X-ray and Balmer line (e.g., H) emission are some of these indicators. We have searched in our sample for a possible impact of binarity upon this activity (see Table 4). Although the samples are rather small, it appears that binaries and single stars have roughly the same fraction of emitting stars.
It seems, from our survey, that the magnetic activity of PMS stars is not dependent on the presence of a companion. Binary surveys in X-ray selected samples had to face the bias induced in their target selection by the fact that both stars can be emitters. Various estimates of this bias were obtained by Brandner et al. (brandner:1996 (1996)) and Köhler & Leinert (kohler_leinert:1998 (1998)), but it appeared that it is not an important effect. This is confirmed by the absence of a significant difference in the binary fraction of -detected and undetected stars in a single cluster (Leinert et al. leinert:1993 (1993); Köhler & Leinert kohler_leinert:1998 (1998)). Similarly, in IC 348, the X-ray source sample does not show a higher binary frequency than the whole sample.
| observed | binaries | ||
|---|---|---|---|
| sources | 30 | 6 | |
| undetected | 36 | 6 | |
| H | emission | 31 | 6 |
| unknown or abs. | 35 | 6 |
Because H emission is likely linked to the accretion phenomenon on T Tauri stars (e.g., Edwards et al. edwards:1994 (1994)), it also appears that binary members in IC 348 are surrounded by accretion disks in the same proportion as single stars, i.e., that binaries do not disrupt disks more rapidly than singles. Indeed, if two stars are separated by a few tens of AU, inner disks can remain unaffected around these stars. This is enough to support accretion onto the stars and to emit Balmer lines. Similarly, Prato & Simon (prato_simon:1997 (1997)) showed that the near-infrared emission of accretion disks is the same in multiple systems and in single T Tauri stars in the Taurus-Auriga SFR, provided the companions are separated by 40 AU or more.
4.3 Binary mass ratios and very low-mass companions
An estimate of the mass ratio for each binary candidate is given in Table 1; it has been obtained from the band relative photometry, using the 2 Myr mass-luminosity relationship from Baraffe et al. (baraffe:1998 (1998)), which can be approximated by for low-mass stars (), and assuming that both stars are coeval and equally extincted. Because of the time dependency of the mass-luminosity relationship, these estimates are somewhat uncertain. We used the median age determined by H98 as a typical value for the whole cluster. Also, the extinction along the line of sight of the primary and the secondary are unknown and might be different (this effect should be rather small at 1.65 m, however), and infrared excesses can represent a significant part of the flux at this wavelength. In two cases (IfA 144 and 157), the mass ratio estimated from is significantly smaller than from , indicating that at least one component shows a significant excess (IfA 143 and 158 secondaries actually show larger excesses than their primaries by about 0.2 mag); in the other cases, both values are similar. Also, the band relative photometry for IfA 184 is somewhat uncertain. However, we assume that these mass ratios are not systematically biased towards low or high values.
We did not find any companion fainter than mag, although it would have been easily detected, provided that the separation of the system is larger than (see Fig. 2). This flux ratio corresponds to a mass ratio of at 2 Myr. For an average primary mass of 0.5, this could point to the absence of very low-mass stars and brown dwarfs as secondaries. Alternatively, a statistical fluctuation cannot be excluded given the small number of detected binaries.
In order to test the significance of this result, we performed Monte-Carlo simulations to compare the observed mass ratio distribution in IC 348 with that obtained assuming that each companion has a mass (lower than its primary) taken at random from a given initial mass function (IMF). Each simulated histogram is the average of 1000 simulations, so that statistical uncertainties can be neglected; the exclusion of binaries with does not modify the histograms by more than a few hundredths in each bin. First, we used the Kroupa et al. (kroupa:1993 (1993)) IMF, with and stellar masses in the range 0.08–1. The number of predicted binaries in the range –0.25 is about one. We also used the Reid & Gizis (1997a ) IMF within the 5.2 pc solar neighbourhood, with and without brown dwarfs (i.e., with a minimum mass of 0.05 and 0.075 respectively). In the first case, the mass function was chosed flat in the brown dwarf domain (), following Reid & Gizis (1997b ); we checked that the slope of the mass funtion does not modify significantly the results. Without brown dwarf companions, we again predict about one companion in the first bin of Fig. 4, while this number is increased to almost three if we include substellar objects. In all three cases, the number of detected companions in the range –0.75 is about twice as large as that predicted by our simulations. In Fig. 4, only binaries with are plotted, because Reid & Gizis’s IMF is only defined below 1. It should be noted that the random pairing assumption together with the latter IMF leads to a mass-ratio distribution significantly different than that observed by Reid & Gizis (1997b ).
Despite of the small size of our small binary sample, the observations indicate that binaries in IC 348 are not preferentially equal mass systems, since no binary appears in the bin –1. According to DM91, the mass ratio distribution for solar-type field stars peaks near –0.3. On the other hand, in their studies of low-mass stars in the solar neighbourhood and the Hyades cluster, Reid & Gizis (1997a ; 1997b ) concluded that M-dwarf binaries have a mass ratio distribution peaking at , which contrasts with our findings fot IC 348. It is unlikely that our observations have missed some equal mass systems; unless infrared excesses introduce a systematic bias against equal flux binaries, this deficit is real.
The absence of small mass ratios () in our observations is only marginally significant, given the sample size. It is however more consistent with the models without brown dwarf companions. Reid & Gizis (1997b ) concluded from their Hyades study that the mass function is flattening, maybe even decreasing, in the substellar domain. However even a flat mass function probably predicts too much companions with in IC 348. It rather seems that no brown dwarfs are companions of low-mass stars. This absence of brown dwarfs is also found in Table 1, where all companions have stellar masses, with the possible exception of the companion of IfA 192 (). We caution again that these estimates are somewhat uncertain, due to age effects, infrared excesses and, in some cases, unknown extinctions; spectra of the candidates should be obtained to determine their stellar/substellar status (IfA 49, 82, and 184B have masses below 0.15 from our results).
If this absence of brown dwarfs is not due to statistical fluctuations or to systematic errors in the estimate of the mass ratio, this suggests that brown dwarfs cannot form in IC 348 at separations larger than AU from stars. The results of Reid & Gizis (1997b ) indicate that this limit is smaller than 5 AU in the Hyades. This apparent lack of very low-mass companions may result from dynamical biasing during the early evolution of small subclusters: -body simulations of Sterzik & Durisen (sterzik_durisen:1998 (1998)) show that, in most cases ( %), the dynamical evolution of small- systems result in the association of the two more massive stars in a binary system and to the ejection of the lower mass components. However, in the solar neighbourhood, very low-mass secondaries () can be found, at separations varying from 4 to 1800 AU (Reid & Gizis) 1997a ).
5 Environmental conditions and binary formation
In order to investigate evolutionary effects, we first compare the binary fraction we have determined in Sect. 3 with that of other SFRs (Sect. 5.1). The possible temporal evolution of the binary fraction is discussed in Sect. 5.2, before we argue that environmental conditions and binary frequency may be tightly linked.
5.1 Comparison of binarity in IC 348 with other SFRs
Given that the stars in IC 348 have a median age of 2 Myr, we can compare them directly with other SFRs like the Taurus-Auriga complex and the Orion Trapezium cluster, without introducing an evolutionary bias in terms of age. The binary excess observed in Taurus, Chamæleon and Ophiuchus is of the order of a factor of 1.6 (Duchêne duchene:1998bin (1998)). A similar excess, if existing in IC 348, would yield a binary fraction of % in our surveyed separation range. This is different from our observed binary fraction at a 2.5 level, and can be excluded with a high confidence level (98 likely harbor different binary fractions. From this we conclude that not all SFRs have a unique binary fraction, several of them exhibiting excesses (Taurus, Ophiuchus, Chamæleon) and others showing binary fractions similar to that of the MS (the Trapezium cluster, IC 348, as well as other clusters in Orion: NGC 2024, 2068 and 2071, Ghez et al. ghez:1997 (1997)). Consequently, we are led to the conjecture that the age, which is the same on average for the above-mentioned SFRs, is not the only parameter governing the binary fraction in a young cluster or a T-association.
The stars we observed in IC 348 represent a rather large age spread, from a few to about years. This allows a comparison of the binary fraction with stellar age, which is shown in Table 5. We selected all stars in our samples with known age, which excludes the stars only detected in the H survey, as well as two other members which lack photometry in H98’s study (IfA 83 and 89). It appears that all three subsamples have similar binary fractions, although we are limited by the small sample sizes; a rank order test does not indicate any difference between the single and binary stars age distributions. This indicates that the binary fraction does not evolve significantly with time, at least on a timescale of a few Myrs. We also verified that the binaries in the three subsamples defined in Table 5 are roughly equally represented at all separations. This means that we do not see any indication for an evolution of the binary separations over the timescale of the age range covered by these stars.
| observed | 20 | 22 | 16 |
|---|---|---|---|
| binaries | 5 | 3 | 4 |
As an alternative to an evolutionary process, it has been proposed that the binary excess observed in various SFRs was the result of an observational bias: since the mass-luminosity relationship is shallower for younger stars, it is easier to detect companions around PMS stars than in the MS population (Zinnecker, priv. com.). The fact that we know several SFRs, now including IC 348, with no binary excess indicates that this bias is not responsible for the observed overabundance of PMS binaries in some regions.
The binary fraction that seems to differ between SFRs relates to binaries which cover only a limited separation range. If the separation distribution was different from one SFR to another, the overall binary fractions could still be the same for all of them: an excess observed in a given separation range could be balanced by a deficiency of binaries with shorter or longer periods. There is currently no such evidence, except perhaps for the study of the population in Upper Scorpius by Brandner & Köhler (brandner_kohler:1998 (1998)). Several arguments indicate that the orbital period distribution does not vary significantly between PMS and MS binaries: the number of spectroscopic binaries in Taurus is at least as large as that of the MS (Mathieu mathieu:1994 (1994)), lunar occultation surveys in this SFR have shown that the binary excess was present down to 1 AU (Richichi et al. richichi:1994 (1994); Simon et al. simon:1995 (1995), and Pleiades binaries have a similar period distribution as dwarfs (Mermilliod et al. mermilliod:1992 (1992); Bouvier et al. bouvier:1997 (1997)).
5.2 Binary fraction and environmental conditions
Considering IC 348, the Trapezium (Prosser et al. prosser:1994 (1994); Petre et al. petr:1998 (1998)) and Pleiades (Bouvier et al. bouvier:1997 (1997)) clusters, and the solar neighbourhood stars (DM91), we have four samples with no binary excess at different evolutionary stages (PMS, ZAMS and MS). We thus conclude that the binary fraction does not evolve with time between these stages. Any evolution of the binary frequency would have to occur within the first Myr after the formation process. Furthermore, the differing binary fractions between the various SFRs of the same age have to be explained, and a global time effect cannot be responsible for this. One common property of all the clusters without binary excess is that they are all rather dense: IC 348 has about 500 stars pc-3, and the Trapezium is about 10 times denser. The older Pleiades cluster, which is still dense nowadays, was probably even denser when younger, perhaps similar to the Trapezium. On the other hand, the SFRs with high binary fractions (Taurus, Ophiuchus, Chamæleon) are rather loose, with no more than a few stars pc-3 in the Taurus aggregates. This seems to indicate that a link exists between the binary fraction and the cluster density.
Several physical processes could be the reason behind such a link. The impact of the average cluster density on the binary fraction could be direct; for instance, in dense clusters, the number of gravitational encounters is high and the binaries could be massively disrupted in such clusters over short timescales. From -body simulations, Kroupa (1995a ; 1995b ) has shown that in clusters as dense as the Trapezium cluster the binary fraction could decrease from 100% to about 50% in less than 1 Myr. Then, a model where all SFRs form with a high binary fraction (i.e., close to 100%), and where gravitational interactions between multiple systems are responsible for the decrease of the number of binaries, would be in qualitative agreement with the observational results: in all dense clusters, the binary fraction would have already decreased down to the MS level even for the youngest clusters in which binary fractions have been measured so far, while it would have remained high in loose PMS associations.
Alternatively, it is possible that the density is not the main parameter governing the binary fraction, but that another physical parameter, during or even before the star formation process, drives the subsequent evolution of the cluster, including its stellar density and binary fraction simultaneously. Durisen & Sterzik (durisen_sterzik:1994 (1994)) have shown that the current models of fragmentation and disk instability may imply higher binary fractions when the initial cloud temperature is lower. In general, cold giant molecular clouds may not be very efficient in forming stars, if the output of their fragmentation is small aggregates, with low densities (like Taurus). Regions creating high-mass stars, on the other hand, have rather high cloud temperatures; they usually from dense clusters, such as the Trapezium cluster. The link we find between binary frequency and cluster density could then be an intrinsic output of the fragmentation process. Other characteristics of the cloud before star formation occurs could as well be responsible for the observed linked between density and binary fraction. For instance, the nature of the pre-collapse equilibrium in the parent cloud may influence the mass, size and angular momentum of the fragmented cores, leading to differing binary fraction and cluster density.
Environmental conditions at the time of star formation thus could have an impact on the resulting binary population (i.e., the total number of multiple systems). At the present time, it is not possible to distinguish between a very rapid temporal evolution of the binary fraction, during the first Myr, or an intrinsic dependence of the binary fraction on these conditions. Observations of even younger populations in embedded clusters, as well as determination of accurate orbital period and mass ratio distributions are needed to go further into the history of binary formation and evolution.
6 Conclusions
From a high-angular resolution study of IC 348 low-mass members we find that the binary frequency in this very young cluster ( Myr) is similar to that of the Pleiades ( Myr) and of low-mass field dwarfs ( Gyr). We therefore conclude that the binary frequency does not significantly evolve over time on a timescale of several 100 Myr. Instead, it appears that the binary frequency among low-mass stars is already established at very young ages, i.e., within 1 Myr after the formation process.
In particular, a long-term evolutionary effect cannot be responsible for the differing binary fractions found in different SFRs: on the one hand, Taurus and Ophiuchus exhibit binary excesses, on the other, the Trapezium and IC 348 clusters don’t. Yet, all these regions have similar ages of 1–2 Myr. Furthermore, in the IC 348 sample, we do not find evidence for an evolution of the binary fraction or the orbital period distribution within the age spread of the cluster of about 10 Myr. A time evolution of the binary frequency, if any, is thus constrained to occur within the first 1 Myr of stellar evolution. After this time, intrinsic differences exist between SFRs regarding their binary content.
In spite of the large dynamic range of our images, no brown dwarf companion is found in IC 348 binaries (to the possible exception of IfA 192B). The mass ratio distribution we find is consistent with the absence of brown dwarf companions to low-mass members of this cluster; a similar conclusion was drawn for the Hyades cluster. Also, the mass-ratio distribution is not peaked towards , in possible contradiction with what has been proposed for the solar neighbourhood M-dwarfs population. Further studies with larger telescopes will allow a better determination of this distribution.
Comparing the results obtained on IC 348 to similar studies in other clusters, it appears that the binary fraction may be inversely correlated with the average cluster density, with dense clusters showing low binary fractions (similar to field dwarfs), as opposed to the loose T-associations like the Taurus-Auriga and Chamæleon complexes where the binary fraction is larger. On the basis of this qualitative trend, at least two scenarios may explain the observed differences in binary fractions: either the formation mechanism always leads to an initially high binary fraction (of the order of 100%) and frequent gravitational encounters in dense clusters disrupt binaries on a timescale of 1 Myr or less, or specific initial conditions in the parent molecular cloud, such as the gas temperature, metallicity, angular momentum , etc…, lead to different output of the star formation process and govern simultaneously the binary frequency and the cluster density. High resolution studies of embedded clusters even younger than those investigated so far are still needed to settle these issues.
Acknowledgements.
Numerous comments by J. Eislöffel have significantly improved this paper. We also thank G. Herbig for reading an early version of this work and for providing us with his members list prior to publication and mass estimates, as well as I. Baraffe for making her evolutionary models available. Observing support from CFHT is also gratefully acknowledged, especially J.-L. Beuzit, M.-C. Hainaut and D. Woodworth.References
- (1) Baraffe I., Chabrier G., Allard F. & Hauschildt, P., 1998, A&A, 337, 403
- (2) Bouvier J., Rigaut F. & Nadeau D., 1997, A&A, 323, 139
- (3) Brandner W., Alcalá J., Kunkel M., Moneti A. & Zinnecker H., 1996, A&A, 307, 121
- (4) Brandner W., Köhler R., 1998, ApJ, 499, L79
- (5) Duchêne G., 1998, A&A, in press
- (6) Duquennoy A. & Mayor M., 1991, A&A, 248, 485 (DM91)
- (7) Durisen R. & Sterzik M., 1994, A&A, 286, 84
- (8) Edwards S., Hartigan P., Ghandour L. & Andrulis C., AJ, 108, 1056
- (9) Fischer D. & Marcy G., 1992, ApJ, 396, 178
- (10) Ghez A., Neugebauer G. & Matthews K., 1993, AJ, 106, 2005
- (11) Ghez A., McCarthy D., Patience J. & Beck T., 1997, ApJ, 481, 378
- (12) Herbig G., 1998, ApJ, 497, 376 (H98)
- (13) Jefferies S. & Christou J., 1993, ApJ, 415, 862
- (14) Köhler R. & Leinert Ch., 1998, A&A, 331, 977
- (15) Kroupa P., 1995a, MNRAS, 277, 1491
- (16) Kroupa P., 1995b, MNRAS, 277, 1522
- (17) Kroupa P., Tout C. & Gilmore G., 1993, MNRAS, 262, 545
- (18) Lada E. & Lada C., 1995, AJ, 109, 1682
- (19) Leinert Ch., Zinnecker H., Weitzel N., Christou J., Ridgway S., Jameson R., Haas M. & Lenzen R., 1993, A&A, 278, 129
- (20) Luhman K., Rieke G., Lada C. & Lada E., 1998, ApJ, 508, 347 (L98)
- (21) Mathieu R., 1994, ARA&A, 32, 465
- (22) Mayor M., Duquennoy A., Halbwachs J.-L. & Mermilliod J.-C., 1992, In: McAllister & Hartkopf (eds.) Complementary approach to double and multiple stars research, ASP conf. series, vol. 32, 73
- (23) Mermilliod J.-C., Rosvick J., Duquennoy A. & Mayor M., 1992, A&A, 265, 513
- (24) Padgett D., Strom S. & Ghez A., 1997, ApJ, 477, 705
- (25) Patience J., Ghez A., Reid I., Weinberger A. & Matthews K., 1998, AJ, 115, 1972
- (26) Petr M., Coudé du Foresto V., Beckwith S., Richichi A. & McCaughrean M., 1998, ApJ, 500, 825
- (27) Prato L. & Simon M., 1997, ApJ, 474, 455
- (28) Preibisch T., Zinnecker H & Herbig G., 1996, A&A, 310, 456
- (29) Prosser C., Stauffer J., Hartmann L., Soderblom D., Jones B., Werner M. & McCaughrean M., 1994, ApJ, 421, 517
- (30) Reid I. & Gizis J., 1997a, AJ, 113, 2246
- (31) Reid I & Gizis J., 1997b, AJ, 114, 1992
- (32) Reipurth B. & Zinnecker H., 1993, A&A, 278, 81
- (33) Richichi A., Leinert Ch., Jamesonm R. & Zinnecker H., 1994, A&A, 287, 145
- (34) Scalo J., 1986, Fund. Cosm. Phys., 11, 1
- (35) Simon M., Ghez A., Leinert Ch., cassar L., Chen W., Howell R., Jameson R., Matthews K., Neugebauer G & Richichi A., 1995, ApJ, 443, 625
- (36) Sterzik M. & Durisen R., 1998, A&A, 339, 95
- (37) Tokovinin A., 1997, A&AS, 124, 75
- (38) Trullols E & Jordi C., 1997, A&A, 324, 549