On the Robustness of the Cepheids’ P-L relation
Alfred Gautschy, Astronomisches Institut der Universität Basel
Venusstrasse 7, 4102 Binningen, Switzerland
Based on a talk delivered at the Minisymposium “Recent Results on H0” during the 19th Texas Symposium on Relativistic Astrophysics, Paris.
1 Introduction
The Cepheids’ period – luminosity (P-L) relation got itself talked about again in the recent past due to claims of observed metallicity dependences of at least its zero point (Gould 1994, Sasselov et al. 1997, Sekiguchi & Fukugita 1998, Kennicutt et al. 1998). The divergences of the observational results obtained by the different authors are large, however. Therefore, to date the situation concerning the magnitude and the reliability of the effect is rather uncertain on the observational side. Along the theoretical avenue, some progress towards more realistic and in particular more consistent Cepheid modeling has been achieved recently. Upper limits on the reaction of the P-L relation on assumptions in evolution computations, pulsation stability analyses, and mappings onto photometric passbands can be estimated now quite reliably.
This informal review discusses some of the progress (relying mostly on an extensive comparison by Sandage et al. 1998) and it emphasizes modeling problems which still have to be overcome to finalize the theoretical foundation of the Cepheids’ P-L relation.
2 Stellar Evolution
In absence of proper models for stellar hydrodynamics in the framework of stellar evolution, astronomers are urged to parameterize processes such as convective overshooting and semiconvection at various levels of accuracy. Numerous free parameters always go along with such modelling attempts. As different schools tend to favor different choices of such model parameters, we encounter frequently hard to follow controversies and dichotomies in the literature. For a nonspecialist it becomes then essentially impossible to select a particular simulation result for his purpose based on rational reasoning alone. As recipe-driven modeling continues, this unfortunate situation will hardly disappear in the near future.
Semiconvection and convective overshooting are emphasized above because they are the hydrodynamical key-phenomena whose effects cause major uncertainties in the stellar evolution of intermediate-mass and massive stars. Evidently, any other modification of the stellar microphysics shifts and twists the star’s track on the Hertzsprung-Russell (HR) plane too. In contrast to hydrodynamical processes, however, broad acceptance of say opacity tables and nuclear-reaction rates is found in the community.
Numerical observations reveal that overshooting shifts the evolutionary track of a given stellar mass mainly to higher luminosity during the main sequence phase. During the core helium burning the size of the blueward loops is modified when overshooting is incorporated in the numerical scheme (e.g. Matraka et al. 1982, Stothers & Chin 1992, Alongi et al. 1993). In contrast to overshooting, the effect of semiconvection appears to be more dramatic, at least during the core-helium burning phase. Even the very existence of blue loops can depend on incorporating semiconvection (e.g. Langer et al. 1985, Langer 1991).
Even if the physical processes and the micro-physical data are the same in different evolution codes, the resulting tracks can differ significantly. A comparison of Baraffe et al.’s (1998) Fig. 1 with Saio & Gautschy’s (1998) (SG98) Fig. 1 exposes that in the first case an additional smaller loop occurs superposed on the the larger (main) blue loop during the core helium burning. Hence, where SG98 find only three crossings of the Cepheids instability domain, Baraffe et al. (1998) can accommodate up to five.
The argument that the second crossing of the instability region only is relevant for the Cepheid phenomenon is perpetuated even in the most recent literature. A closer look at stellar evolution data shows that only spend by far the longest time in the instability domain during the second crossing (say the ratio of the residence time therein exceeds 10 compared with the other crossings). Towards higher masses, the ratios of 2nd to 3rd and 2nd to 1st crossing times drops markedly and therefore the probability to encounter 1st and 3rd time crossing stars increases to a non-negligible level.
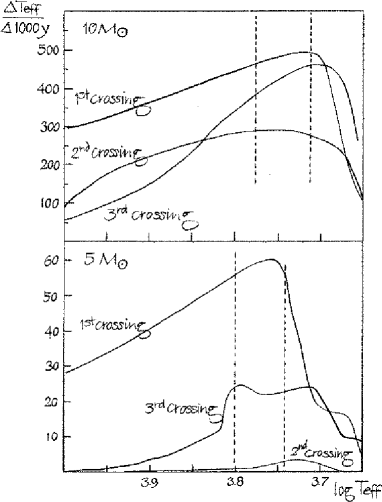
For a star, the ratio of 2nd to 1st crossing time reduces to about 3 and to 1.6 for 3rd/2nd crossing. The numbers further decrease as the stellar mass increases. Detailed numbers depend sensitively on the choice of the abundances. Saio (1998) presented a figure showing that for his computations of sequences the 3rd crossing constitutes the slowest passage through the strip for stellar masses above .
All the uncertainties and the resulting discrepancies in the evolutionary tracks as well as, of course, any changes of the star’s chemical composition modify the mass – luminosity (M-L) and the mass – radius (M-R) relation at the the position of say the fundamental blue edge (FBE) of the instability strip. How this translates into and influences the P-L relation will be addressed in the next section.
3 Stellar Pulsation Theory
The basic physical mechanism underlying the pulsations of Cepheids is well understood. This success story started in early sixties (cf. Baker & Kippenhahn 1965 and Cox 1980 for further references). This does not mean, however, that all theoretical problems have been resolved in full detail. The qualitative era has passed and increasingly more accurate observational data need to be explained with a theoretical framework in which stellar evolution and also micro-physics is known and understood at a high level.
To motivate the existence of a P-L relation for Cepheids we start with the pulsation equation: , with being the theoretical period (in contrast to the observed one ). Under favorable circumstances, i.e. under appropriate relations between stellar mass, , its luminosity, , and the effective temperature, , a simple relation between period and luminosity emerges. Note that the pulsation constant, , is constant only for homologous models. Theoretically, the formulation of the P-L relation at the position of the blue edge (in the case of Cepheids at the fundamental blue edge:FBE) is the least cumbersome one and therefore it is chosen in the following. Observers, on the other hand, prefer something like the ridge line, which is a mean line through the observational data on the P-L plane. A ridge line is statistically much easier to compute than defining an accurate envelope on top of sparse data. If theorists would comply with the observers’ choice they would have to have a clear idea about the width of the instability strip, which is, however, hard to come by computationally. The position of the red edge of the strip is defined by the efficiency of the convective leakage of the flux in the superficial stellar layers – an extremely cumbersome task to model! We return to the role of convection further below.
After some easy manipulations we can write the pulsation equation as
| (1) |
In the first term of the rhs we can assume a M-L relation at the position of the FBE, i.e. . Notice that this relation depends on all those assumptions (indicated by the ’s) which influence the loci of the tracks around the instability strip. These quantities are, however, often buried deep in the formulation of the modeling of stellar evolution and therefore they are difficult to quantify. Furthermore, the M-L relation depends on the evolutionary phase, or in other words, in depends on the number of crossing of the instability strip.
The third term on the rhs of eq. (1) can be eliminated via a parameterization of the position of the FBE, i.e. which depends implicitly again on various quantities (which might be different from the ones influencing the M-L relation).
Essentially, the quarreling about the robustness of the P-L relation, i.e. the uniqueness of its slope and zero-point, after are introduced into eq. (1), boils down to quantifying the effect of the on the P-L relation. From first principles, little is to be learned on these matters. Therefore, numerical calculations have to be performed and conclusions (even if not so conclusive) have to be derived from such “numerical observations”.
Coarsely speaking, the M-L relation, the parameterization of the FBE, and the M-R relation of supergiants in the Cepheid stage all show significant dependences on and abundances, on the number of the crossing (i.e. the evolutionary stage) of the instability region (cf. SBT98), and on all the stellar hydrodynamical uncertainties (e.g. mixing length, overshooting length-scale, semi-convective efficiency). Most surprisingly, however, the combined effect of the various dependencies leads eventually to a nearly , and crossing-number independent P-L relation.
As an example consider the following: The FBE (at any luminosity) depends on and roughly as
| (2) |
(SG98). More extensive (and therefore probably more reliable) studies of the Y dependence show a larger coefficient associated with : +0.14 in Chiosi et al. (1993), and +0.11 in Iben & Tuggle (1972). The important thing to notice is the counteracting influence of and . It reduces the shift of the FBE when Z is modified with the frequently encountered cosmogonical constraint of .
Furthermore, despite the varying M-L relation for different heavy element abundances and different hydrodynamical assumptions concerning convection, the M-R relation adapts such that finally the slope of the emerging P-L relation changes by less than about 10 %. The same applies for the different crossing numbers across the instability region: The M-L relation is a different one for each crossing, so is the M-R relation. In combination they result in a zero point shift of less than for any choice of chemical abundances. The slope remains unchanged to a high degree.
Summa summarum: The combination of stellar evolution and linear stability analyses on these models directly leads to a P-L relation at the FBE (at least) which is not noticeably dependent neither on chemical abundances nor on hydrodynamical treatment or evolutionary stage. The average scatter of the P-L relation at the FBE is about 0.047 in . The ad hoc defined fundamental red line (FRL) of (SG98) – postulating the fundamental red edge (FRE) to be parallel-shifted in by 0.06 indicates a P-L relation for the FRL running also parallel to the one of the FBE; this result is not a priori trivial as the stars evolve non-homologously across the instability strip and as the efficiency of convective leakage might be a strong function of .
Most of all, however, one of the major unsettled issues in stellar pulsation theory – the influence of convection – is important also for Cepheids. Modeling of convection in pulsating stars has been attempted with mixed success for many years (e.g. Unno 1967, Baker & Gough 1979, Stellingwerf 1982, Xiong et al. 1998, Yecko et al. 1998). Usually it is multiply parameterized and therefore it is not satisfactorily understood. Model computations clearly demonstrate that convective leakage is the dominating process to cause a red edge and therefore it is an indispensable ingredient of the theory. A proper treatment of convection might also be necessary to pin down the blue edge with high accuracy. The sensitivity of blue edge on convection depends on the stellar mass, however. As the instability strip is tilted to lower effective temperatures for higher luminosities, higher-mass stars will be influenced stronger by convection than low-mass stars (cf. Fig. 2).
At high luminosities, radiation pressure tends to destabilize stellar envelopes (i.e. tends to shift the FBE to the blue) whereas convective leakage in the superficial layers induces a redshift of the FBE. The competition between these two effects will determine the final outcome. Taking the observational P-L data at face value, it appears as if convection is the dominating effect, i.e. the shift of the FBE to the red induces a reduction of the slope of the P-L relation at its upper end (cf. SBT98). The deviation from simple linearity of the P-L relation appears to set in above about 60 days period. This is relevant for stellar masses above 10 .

The lowest panel of Fig. 2 shows that for the 5 and the 10 stars convective transport is the dominating energy transport mechanism within the partial H/HeI ionization zone: locally more than 90 % of the flux is transported by material motion. The integral work, which is shown in the top panel, is not significantly overlapping with the convection-dominated region in the 5 model. Most of the driving happens deeper inside the envelope, in the HeII partial ionization zone around . The situation changes, however, at 10 : More than 50 % of the driving occurs there already in the H/HeII region which overlaps with about half of the convective flux dominated region of the envelope. For the latter model, a neglect of the convective flux perturbation in the stability analysis will most probably affect the eigenanalysis markedly. In other words, a simple analysis, suppressing convective leakage even at the blue edge will produce too blue a FBE compared with a realistic treatment. Therefore, over the whole period range, say up to 100 days, a simplistic computation will produce a P-L relation with a slope which is larger than what nature realizes. When constraining a P-L parameterization to low luminosities (i.e. shorter periods), the effect of a even a suppressed pulsation-convection coupling might lead to a slight zero-point shift in the P-L relation. Only a slope shift is not so likely. The magnitude of such a shift is hard to predict. A comparison relies on how realistically convection penetrating optically thin regions can be described. Presently, we are far from a physically realistic treatment of this domain.
In contrast to repeated mis-citations (e.g. Bono et al. 1998) SG98 did not use “radiative” models in their linear, nonadiabatic stability analyses. The used evolutionary stellar models which are convective wherever stellar thermodynamics requires it. What is not included, however, is the perturbation of the convective flux due to some convection-pulsation interaction prescription. This clarification seems important as the correct (radiative/convective) structure of the equilibrium model is relevant for the nonadiabatic period derived from a linear analysis – even if the perturbation of the convective flux turns out to be irrelevant for the onset of pulsational instability for the short-period Cepheids. Of course, the same aspect pops up again when comparing linear models with convective non-linear ones (e.g. BMS 1999).
The lowest panel of Fig. 2 shows in grey the weight functions of the fundamental modes for the and the models. The magnitude of the arbitrarily normalized weight function measures the local importance of the stellar properties to determine the period the pulsation mode under consideration. Obviously, the convection zone in the H/HeI partial ionization region has marginal influence on the weight function for both stellar masses. It is clearly seen that the two sets of curves live in essentially disjoint regions of the star. However, it is important to note for comparisons it is relevant to compute stellar structures with resulting from the same physical input: If the convection zones are suppressed to compute radiative models (e.g. BMS 1999) then the compressibility structure () differs from the one in a radiatively/convectively layered models. Very naturally, two such sets of such unlike models will have different distributions of weight functions and therefore different periods. The more extended the convection zones become, the more the periods diverge between the two approaches: This is just what is seen in Fig. 53 of BMS99.
Modern nonlinear modeling which includes diffusion-type convection treatment coupled with the star’s envelope pulsation do exist (cf. BMS99). The convection formulated therein is a refined version of Stellingwerf’s (1982) approach. The BMS99 nonlinear FBE is at all luminosities below about 200 K hotter than e.g. SG98 FBE without pulsation-convection coupling. Naïvely, we would have expected the opposite behaviour. Above the BMS99 FBE shifts coolward rather abruptly, suggesting a FBE at 5500 K at where the extrapolation of the SG98 data leads to 5700 K. This drop in temperature of the FBE is the reason of the quadratic term introduced into the P-L parameterization by Bono & Marconi (1998). Observations from LMC and SMC do not, in our opinion, support such an efficient convective leakage at long periods (high luminosities).
Considerable complications enter the treatment of convection in Cepheids since the superficial convection zone associated with the H/HeI partial ionization reached into optically thin regions. Hence, radiative losses become important in the energy balance of the convective elements. This is very difficult to model; to date a reliable quantitative description is not available. For the finite amplitude behaviour, i.e. for the lightcurve, the details of the treatment of convection at the outer boundary was shown to be important already in RR Lyrae stars (Feuchtinger 1998) which are hotter than the Cepheids.
It is unlikely that the final effect of convection on the P-L relation will introduce a metallicity dependence which we are missing currently. The driving in the outermost regions is H-ionization dominated, and this is very robust against envisaged small changes in the chemical composition.
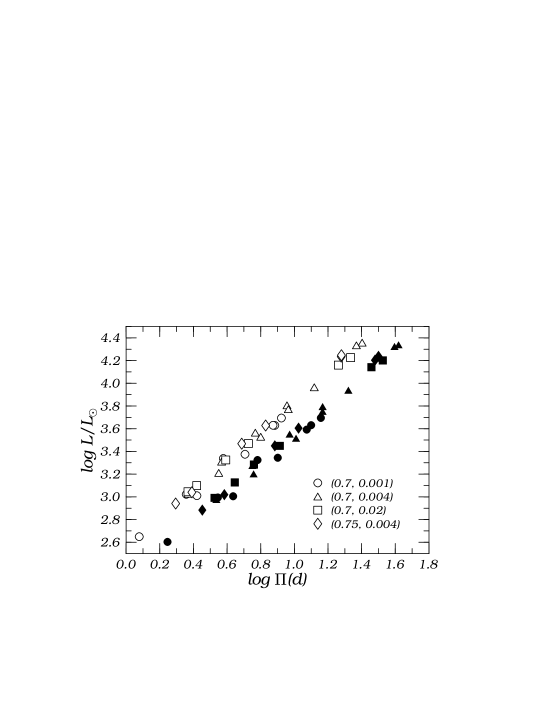
To complete this section, we write the P-L relation as shown in Fig. 3, as . A comparison of several theoretical studies by SBT98 demonstrated that at 10 days period, the zero point of th P-L relation agrees to within for the different authors (and therefore different approaches in terms of stellar evolution and stellar stability computations). With the SG98 data we arrive at (at [Fe/H] = 0) or at after bolometric correction according to SBT98. The zero-point remains stable at a level of about +/- 0.05 mag when [Fe/H] varies between +0.4 and -1.7 and when Y changes (independently) between 0.25 and 0.30. The agreement is somewhat degraded at since the slopes derived from the different sources vary at the level of about 10 %. In the study of SG98 the value of was found to increase by about 9 % upon reducing [Fe/H] from zero by one dex. This all shows nevertheless the rather remarkable stability of the P-L relation against changes in physical assumptions, numerical realizations, and last but not least against abundance variations.
4 Stellar Atmospheres
Even if we should have gained some confidence in the computations of stellar evolution and then in stellar stability properties, there is another hurdle to clear: the transfer of the modulated energy flux through the stellar atmosphere.
As we have seen in the previous sections, the theoretical Cepheid P-L relation appears not to be very sensitive (compared with the level of accuracy of presently obtained observations) on metallicity and assumptions on the microphysics or on hydrodynamical processes. Even if that should prove correct in the future, the transformation into observationally relevant filter passbands can potentially destroy this simplicity due to differential blanketing effects in the stellar atmosphere.
Several recent studies of the P-L relation performed a mapping of bolometric magnitudes into various photometric passbands (Baraffe et al. 1998, Bono et al. 1998, SBT98). Only the SBT98 study uses stellar atmospheres which are constructed for the particular needs of Cepheids. In the other studies, the available range of the atmosphere models is too narrow for Cepheids so that extrapolations are necessary for colors and bolometric corrections.
SBT98 find a strong dependence of color indices (in particular at short-wavelength) and bolometric correction on metallicity and gravity. The superposition of these dependencies, when computing the the P-Mx relations (where stands for some filter passband), conspires again to result in a remarkable smallness of the effect when metallicity is varied by a factor of about 50. Table 1 quantifies the metallicity dependence as deduced by SBT98.
| Filter | 10d | 31.6d |
|---|---|---|
| B | +0.02 | +0.08 |
| V | -0.08 | -0.08 |
| I | -0.10 | -0.10 |
The typical scatter in the data amounts to about 0.02 mag. The variations of the absolute magnitudes at different periods is close to the noise in the theoretical models, but also in the range of the uncertainty of observational data. In any case, the above numbers are more than a factor three smaller than some observational results published recently (e.g. Gould 1994, Sasselov et al. 1997, Sekiguchi & Fukugita 1998, Kennicutt et al. 1998).
Applying the above results to distance moduli obtained in different passbands for LMC and SMC very good internal agreement is found, usually on the level of +/- 0.02 mag when using either the SBT98 or the DiBenedetto (1997) data. Additionally, SBT98 demonstrated that distance moduli to the Clouds derived with RR Lyr stars and Cepheids agree well even when not correcting the Cepheids’ moduli for metallicity. This latter result already hints at only a weak dependence of the P-L zero points on abundance.
5 Final comments
Based on the mapping of bolometric relations onto selected filter passbands with appropriate stellar (static, plane-parallel) atmosphere models, SBT98 found that a weak metallicity-dependent zero point shift in the P-L relation exists. Its magnitude is below 0.1 mag/dex of [Fe/H] in the passbands of B,V, and I. An more exact number could not be deduced to date as the results scrape close to the scatter brought about by the models themselves and the different modeling assumptions. It appears, however, that the theoretically deduced variation with metallicity lies in the range of the claimed observational errors. Therefore, from the theoretical side, no significant zero point variation is expected to be found in the observations presented to date. Applying to the distance moduli corrections to the absolute magnitudes assuming the upper limits of their [Fe/H] dependence leads to the distance moduli with a remarkable internal agreement in B,V, and I for both LMC and SMC (cf. SBT98). The obviously much stronger [Fe/H] dependences claimed in the observational literature is not supported by theory and the discrepancy has clearly to be resolved in the near future as it poisons the use of pulsators to accurately calibrate the distance scale in the neighboring universe.
One of the important questions at the interface of observations and theory is that of proper averaging observational data. Theory always discusses equilibrium quantities and observations provide at best some mean values. How well do these mean values represent equilibrium quantities? The transformations of observational data averaged over a cycle, such as e.g. , to obtain quantities predicted by theory (such as or ) are unfortunately not unique. For a brightness to luminosity transformation, a cycle average of the intensity is expected to be the best as it can be physically motivated. Surprisingly enough, Karp (1975) shows for his model that a magnitude mean approximates the equilibrium value best. For colors the situation becomes even more inscrutable as the quality of a particular choice of averaging is furthermore considerably passband dependent. Also Bono et al. (1998) point out these differences without suggesting, however, a approximation strategy for observers yet.
Another aspect which might lead to unexpected divergences when defining some sort of a ridge line is the uneven population of the instability strip. Taking Fernie’s (1990) or SBT98’s results at face value one observes that the Cepheids tend to crowd the blue side and avoid the red part of the instability strip altogether at short periods. From the view-point of stellar evolution theory this is not understandable. The stars should enter the instability strip from the red and therefore populate the strip from cool to blue upon increasing the luminosity. Seemingly the opposite is observed! Furthermore, our Fig. 1 shows that the evolutionary timescales are not even across the strip. Almost generically, the evolution is slower close to the blue edge than around the red one. This seems to be true independently of the crossing number. It is the second crossing of the 10 star only which suggests an even speed and therefore an even population of variables across the instability region. Not accounting for the above mentioned population-density differences of pulsators across the strip, not to mention yet observational biases due to an amplitude – effective temperature – period dependence, distorts the slope of the ridge line. For example, computing a ridge line assuming a uniform population of the strip and neglecting the short-period blue clumping discussed by Fernie (1990) leads to a shallower P-L relation than what one obtains from a FBE relation.
On theoretical grounds, using a FBE relation would be the most favorable choice. This, however, is hard if not impossible at all to realize considering the small number of stars usually accessible. When using all the Cepheids in the strip to establish a slope of the P-L relation a possible uneven population of the instability strip should be accounted for. A quantification of the effect should be feasible for stellar evolution simulators as they have the necessary data at hand.
Acknowledgements: The Swiss National Science Foundation supported this study through a PROFIL2 fellowship. I am indebted to H. Harzenmoser for inquisitive discourses during a Meringues-meeting at Chemmeribode Bad.
References
Alongi M., Bertelli G., Bressan A., Chiosi C., Fagotto F., et al. 1993, A&AS 97, 851
Baker N.H., Gough D.O. 1979, ApJ 234, 232
Baker N.H., Kippenhahn R. 1965, ApJ 142, 868
Baraffe I., Alibert Y., Méra D., Chabrier G., Beaulieu J.-P. 1998 ApJ 499, L205
Bono G., Marconi M. 1998, in IAU Symp. 190, New Views of the Magellanic Clouds, eds. Y.-H. Chu, J. Hesser & N. Suntzeff, ASP Press
Bono G., Marconi M., Stellingwerf R.F. 1999, to appear in ApJS (BMS99)
Bono G., Caputo F., Castellani V., Marconi M. 1998, astro-ph/9809127
Chiosi C., Wood P.R., Capitanio, N. 1993, ApJS 86, 541
Cox J.P. 1980, Stellar Pulsation, Princeton:Princeton University Press
DiBenedetto G.P. 1997, ApJ 486, 60
Fernie J.D. 1990, ApJ 354, 295
Feuchtinger M. 1998, A&A 337, L29
Gould A. 1994, ApJ 426, 542
Iben I., Jr., Tuggle R.S. 1972, ApJ 178, 445
Karp A.H. 1975, ApJ 200, 354
Kennicutt R.C., et al. 1998, ApJ 498, 181
Kochaneck C.S. 1997, ApJ 491, 13
Langer N. 1991, A&A 252, 669
Langer N., El Eid M.F., Fricke K.J. 1985, A&A 145, 179
Matraka B., Wassermann C., Weigert A. 1982, A&A 107, 283
Saio H. 1998, in Pulsating Stars, eds. M. Takeuti and D.D. Sasselov, Tokyo:Universal Academy Press
Saio H., Gautschy A. 1998, ApJ 498, 360 (SG98)
Sandage A., Bell R.A., Tripicco M.J. 1998, preprint
Sasselov D.D., et al. 1997, A&A 324, 471
Sekiguchi M., Fukugita M. 1998, Observatory 118, 73
Stothers R.B., Chin C-W. 1992, ApJ 390, 136
Stellingwerf R.F. 1982, ApJ 262, 330
Unno W. 1967, PASJ 19,140
Xiong D.R., Cheng Q.L., Deng L. 1998, ApJ 500, 449
Yecko P.A., Kolláth Z., Buchler J.R. 1998, A&A 336, 553