A Large-Scale Bulk Flow of Galaxy Clusters
Abstract
We report first results from the “Streaming Motions of Abell Clusters” (SMAC) project, an all-sky Fundamental Plane survey of 699 early-type galaxies in 56 clusters between and . For this sample, with a median distance of , we find a bulk flow of amplitude , towards , , with respect to the Cosmic Microwave Background. The flow is robust against the effects of individual clusters and data subsets, the choice of Galactic extinction maps, Malmquist bias and stellar population effects. The direction of the SMAC flow is 90∘ away from the flow found by Lauer & Postman, but is in good agreement with the gravity dipole predicted from the distribution of X-ray-luminous clusters. Our detection of a high-amplitude coherent flow on such a large scale argues for excess mass density fluctuation power at wavelengths Mpc, relative to the predictions of currently-popular cosmological models.
Subject headings:
galaxies: distances and redshifts — galaxies: elliptical and lenticular, cD — galaxies: clusters: general — cosmology: observations — large-scale structure of Universe1. Introduction
The dipole anisotropy of the Cosmic Microwave Background (CMB) radiation is generally interpreted as a Doppler effect due to the motion of the Sun with respect to the CMB rest-frame. The velocity of the Local Group (LG), 62722 km s-1 towards , , is now well determined from COBE (Kogut et al. 1993). Less well known, however, is the depth and degree to which nearby galaxies share in this motion and, by implication, the scales and amplitudes of the mass fluctuations responsible for the flow.
To a depth of km s-1, a rough consensus has emerged from recent peculiar velocity surveys of galaxies. For instance, Giovanelli et al. (1998) find a flow (in the CMB frame) of km s-1 towards , , from an I-band Tully–Fisher survey, while the Mark III velocity compilation yields km s-1 towards , (Dekel et al. 1998, in prep.). Beyond this depth, however, the situation is much less clear. Lauer & Postman (1994, hereafter LP), using a photometric distance indicator for brightest cluster galaxies, found a bulk motion (towards , ) for an all-sky sample of 119 Abell/ACO clusters to 15000 km s-1 depth. Currently-popular cosmological models have too little large-scale power to generate coherent flows on such large scales (Feldman & Watkins 1994; Strauss et al. 1995; Jaffe & Kaiser 1995). The LP result has been challenged by subsequent peculiar velocity surveys (Riess et al. 1995; Giovanelli et al. 1996; Hudson et al. 1997, hereafter H97; Giovanelli et al. 1997; Müller et al. 1998; Dale et al. 1998). However, with the exception of Dale et al. (1998), none of these studies approach the depth and sky coverage of the LP survey.
In this Letter, we report the detection of a significant coherent flow from the SMAC survey of cluster peculiar motions. The survey comprises 699 early-type galaxies in 56 clusters mainly within 12000 km s-1. A more detailed description and analysis of the survey will be presented in a forthcoming series of papers.
2. Data & Method
The distance indicator used in this study is the Fundamental Plane (FP) of early-type galaxies (Davis & Djorgovski 1987; Dressler et al. 1987). The FP relates the effective (half-light) radius, (the distance-dependent quantity), the mean surface brightness within this radius, , and the central velocity dispersion, .
The SMAC cluster sample consists of new data for 40 clusters (to be reported in future papers), supplemented with data from the literature for 16 clusters previously studied in H97. All but 8 of these are Abell/ACO clusters, and all but 5 have . The median distance of the SMAC sample is . The number of early-type galaxies observed, per cluster, is in the range 4 – 56, with a median of 8.
New velocity dispersions and Mg2 linestrengths were obtained from the Isaac Newton 2.5m and Anglo-Australian 3.9m telescopes. We followed the homogenization procedure of Smith et al. (1997) to bring new spectroscopic data and existing data from the literature onto a common system. Corrections of up to 0.03 dex in are derived for each system, but typical uncertainties in these corrections are only 0.005–0.008 dex, corresponding to 1.6–2.6% systematic uncertainty in distance, per observing run. Of the 699 galaxies in the final SMAC sample, velocity dispersion data is drawn wholly from new observations for 41% of the sample. For 21% of the sample, the final derives from both new data and published measurements. For the remaining 38%, the dispersions are derived from previously published data.
New R-band photometric data were obtained from the Jacobus Kapetyn 1.0m and Cerro Tololo Inter-American Observatory 0.9m telescopes. Effective radii and surface brightnesses were determined by fitting a one-dimensional -law profile to the circular aperture photometry, with corrections for seeing, cosmological effects and Galactic extinction (using the maps of Schlegel, Finkbeiner and Davis 1998; hereafter SFD). Additional photometric data has been drawn from the literature and carefully combined with newly obtained parameters. Our new photometry provides data for roughly half of the 699 galaxies in the final SMAC sample.
Our method for determining cluster distances and bulk flows follows H97. We summarize the important points here. To obtain cluster distances, we use the inverse form of the FP, i.e. we regress on the distance-independent quantity . This regression is insensitive to photometric selection effects (e.g. selection on magnitude or diameter; see H97, Strauss & Willick 1995). The FP slopes and scatter for the SMAC sample are consistent with previous results for the inverse FP (H97). The resulting distance error is 21% per galaxy, and 3% – 11% per cluster, with a median of 7%. We make a correction for Malmquist bias under the assumption that clusters are drawn from a homogeneous underlying density field. Due to the large number of objects per cluster, the Malmquist bias corrections are small (typically ) for this sample. Finally, we adjust the FP zero-point so that the cluster peculiar velocities have no net radial inflow or outflow with respect to the CMB frame.
A bulk flow model provides the simplest parameterization of the peculiar velocity field. We minimize
| (1) |
where is the CMB frame peculiar velocity of cluster with direction vector , and is the bulk flow. The total error, , is the quadrature sum of the cluster distance error (in the range 100–1200 km s-1), the error in the mean cluster (typically 150 km s-1) and a “thermal component” (set to 250 km s-1) which allows for small scale fluctuations around the mean bulk flow. Given the error-weighting in equation (1), the weighted mean depth of the sample is .
We have tested the bulk flow recovery with Monte Carlo simulations in which galaxies are assigned peculiar velocities consistent with an input bulk flow plus random errors. Because our survey has good sky-coverage, we find that our bulk flow fit is not affected by “geometry bias”, i.e. there is little covariance between the monopole and dipole (bulk flow) terms.
3. Results
The principal result of this Letter is that the SMAC sample exhibits a CMB-frame bulk flow of (error-bias corrected, see LP), towards , . The peculiar velocities of the sample clusters are shown, as a function of angle from the apex direction, in Fig. 3. The linear trend seen here is a clear signature of a bulk streaming motion.
The random error in the bulk flow due to distance and velocity errors is 180 km s-1. A further uncertainty in the bulk flow arises from uncertainties in the corrections to for different runs. We estimate this uncertainty by generating bootstrap realizations of the corrections and analyzing the bootstrap-corrected datasets in the same way as the real data. Through this procedure, we find that this source of systematic error contributes an uncertainty of 90 km s-1 to the measured bulk flow.
The total velocity error in the direction of the flow is 200 km s-1. The error ellipsoid is triaxial: the direction of smallest error () is along , , and the direction of largest error () is along , , which is within 24∘ of our bulk flow. Allowing for the three degrees of freedom in the bulk flow vector we find that our sample is inconsistent with being at rest in the CMB frame at the 99.9 confidence level. A 95 lower limit on the bulk motion is 400 km s-1. If we divide the sample by distance into two parts with equal errors, the outer shell of the SMAC sample gives a larger amplitude flow (by 240360 km s-1) but is consistent, within the errors, with that found from the inner sphere. Both inner and outer samples independently yield a bulk flow with a significance .
![[Uncaptioned image]](/html/astro-ph/9901001/assets/x1.png)
Peculiar velocities as a function of angle from the apex of the bulk flow. Symbol sizes are inversely proportional to errors. The solid line is the best-fitting bulk flow model, and clusters which deviate from this flow at the level are indicated, with error bars.
We have explored a wide range of potential systematic effects. By excluding each cluster from the sample in turn, we find that no individual cluster is responsible for more than 50 km s-1 of the total bulk motion. No single supercluster structure dominates the flow. We find a similar result excluding individual spectroscopic runs. Furthermore, because of the balanced sky coverage, the bulk flow is insensitive to the adopted zero-point of the FP relation. A 1% change in the zero-point (corresponding to its uncertainty) alters the bulk flow by only . If, instead of SFD extinction corrections, we use those of Burstein & Heiles (1982), the recovered bulk flow drops by 100 km s-1. In order to assess the effect of Malmquist bias and redshift cuts, we have performed a simultaneous FP and bulk flow fit (“Method II” in the terminology of Strauss & Willick 1995); we recover a bulk flow which is identical within the errors ( 40 km s-1 change). The effect of a possible FP dependence on morphological type is negligible: E and S0 subsamples of the data give consistent results (they differ by km s-1). Finally, we have examined the possible effect of cluster-to-cluster stellar population differences, using the Mg2 index as an age/metallicity indicator. We find that our clusters are consistent with following a universal Mg2– relation. Furthermore, we find no correlation between peculiar velocity and the (non-significant) offsets of clusters from the Mg2– relation.
![[Uncaptioned image]](/html/astro-ph/9901001/assets/x2.png)
Peculiar velocities projected onto a plane between SGX=0 and SGZ=0. The negative half of the horizontal axis points towards , , which is only from the direction of the SMAC bulk flow. We plot only the 43 clusters within 45∘ of the plane. The shaded region indicates the Zone of Avoidance (). The distance to each cluster is indicated by the circle and the CMB frame redshift is indicated by the tip of the vector. Outflowing clusters have filled circles and solid lines; inflowing ones have open circles and dotted lines. Circle size is inversely proportional to the error in the peculiar velocity. Important locations are indicated: the Local Group (LG); the Great Attractor (GA); the Shapley Concentration (SC) and the Horologium-Reticulum (HR) supercluster.
4. Discussion
The motion of the Local Group (LG) and the bulk motion of the SMAC sample both lie in the plane which is at a 45∘angle from the SGX=0 and SGZ=0 Supergalactic planes. The CMB-frame peculiar velocities of SMAC clusters within of this plane are shown in Fig. 3. This figure shows the continued outflow beyond the Great Attractor (“GA”, Lynden-Bell et al. 1988) both above and below the Galactic Plane, indicating that the local motions are not generated wholly by the GA. On the opposite side of the sky the data, though sparser, exhibit an inflow of similar magnitude, suggesting a bulk flow with very large coherence length.
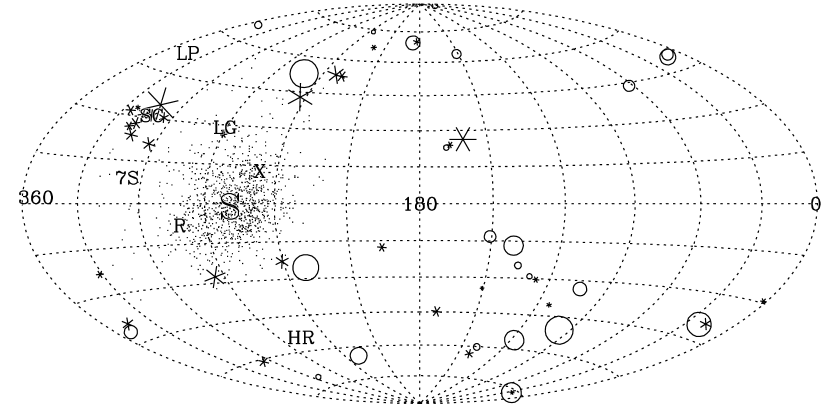
The direction of the SMAC bulk flow in Galactic coordinates is shown in Fig. 3. Also shown are the positions of two most prominent concentrations of clusters within 300 Mpc (Tully et al. 1992), namely the Shapley Concentration (Scaramella et al. 1989; Raychaudhury 1989) and the Horologium-Reticulum supercluster (Lucey et al. 1983). The direction of the SMAC bulk motion is roughly between these two concentrations. Indeed, there is some evidence in our sample of inflow towards the Shapley Concentration. The data are too sparse in the foreground of Horologium-Reticulum to measure any infall. The direction of our flow agrees very well (∘) with the direction of LG motion predicted from the density field of X-ray/Abell clusters (Plionis & Kolokotronis 1998). The IRAS PSCz galaxy redshift survey is of sufficient depth to yield accurate predicted peculiar velocities (Branchini et al. 1998) for our clusters. A preliminary comparison indicates excellent directional agreement between the PSCz-predicted and the observed bulk flow of SMAC clusters.
How does our bulk flow compare to results from other surveys? One might naively estimate the level of agreement between two surveys from a statistic derived from the difference between the two bulk flow vectors and the sum of their observational-error covariance matrices. This procedure is incorrect, however, because it does not allow for the fact that different surveys probe different volumes and regions on the sky. As stressed by Watkins & Feldman (1995), the incomplete cancelation of small-scale flows internal to a volume can have a significant effect on the total measured bulk flow. The significance of disagreements between flow vectors is always overestimated if these effects are neglected.
For example, according to the naive comparison described above, our result is in conflict with the bulk flow vector of LP and of Dale et al. (1998). Our flow is of similar amplitude to that found by LP, but the direction is from the apex of the LP dipole, so at face value the agreement is poor. Dale et al. find a bulk flow of for their deep Tully–Fisher cluster sample, in contrast to our result111It is worth noting, however, that our error-weighted bulk flow is within the error ellipse of Dale et al.’s volume-weighted solution, although not of their error-weighted solution.. A detailed analysis, allowing for the effects of survey geometries and internal flows, is required in order to determine whether the apparent disagreements with LP and Dale et al. are in fact significant. Such an analysis is in progress.
In contrast to the two surveys just discussed, our flow agrees very well in amplitude and direction with that of the similarly deep (9000 – 13000 km s-1) Tully–Fisher sample of Willick (1998, also private communication). The SMAC bulk flow is not inconsistent with preliminary results from the EFAR project (Saglia et al. 1998). Finally, we have performed a bulk flow fit to the SNIa velocity data of Riess et al. (1997), which yields a flow of km s-1 (error-bias corrected) directed towards , . This direction is only from the SMAC flow apex.
Our result can be compared to expectations based on popular families of cosmological models. The bulk flow amplitude measured by a typical (i.e. randomly-placed) observer depends on the power spectrum of mass density fluctuations and the geometry of the survey. Following Kaiser (1988), we have calculated the -space window function for the bulk flow given the SMAC survey geometry. We find that the SMAC bulk flow probes the mass power spectrum on scales larger than . If we fix the power spectrum on the largest scales using COBE, then the high amplitude of the SMAC bulk flow implies substantial power on intermediate scales. For variants of the cold dark matter (CDM) cosmology with either a cosmological constant, neutrinos, or a tilt () in the initial primordial spectrum, the choice of free parameters fixes the power spectrum on sub-COBE scales. For the three COBE-normalized CDM variants, we require choices of the parameters such that the rms fluctuation in mass density contrast in an 8 Mpc sphere is , 0.80 or 0.85, respectively, at the 90% confidence level. This is in conflict with the value inferred from the abundance of rich clusters (Vianna & Liddle 1996; Eke et al. 1996; Pen 1998), but is in better agreement with the value inferred from other peculiar velocity surveys (Kolatt & Dekel 1997; Zaroubi et al. 1997). Alternatively, if the power spectrum is to fit both the abundance of rich clusters and the COBE fluctuations, then it must be considerably more “peaked” between these scales, relative to the CDM variants.
5. Summary
We have recently completed a FP survey of 699 early-type galaxies in 56 clusters within . For this sample, we find a large-scale bulk flow of amplitude towards , . Our result is robust against the effects of individual clusters and data subsets, the choice of Galactic extinction maps, Malmquist bias and stellar population effects.
This result suggests that the mass fluctuation power spectrum has a high amplitude on scales . This regime, near the peak of the power spectrum, is at present poorly constrained by other methods. On these scales, CMB anisotropies are dominated by acoustic oscillations and depend mainly on the baryon content, whereas current galaxy redshift surveys are insufficiently deep, and are subject to the (unknown) relationship of galaxies to the underlying mass density fluctuations.
Further analyses, currently underway, will (i) determine the consistency of our results with those of other surveys, allowing for the different sample geometries; (ii) compare measured velocities with predictions of the IRAS PSCz redshift survey; and (iii) constrain directly the mass power spectrum, by means of the dipole and higher moments of the velocity field.
References
- (1)
- (2) Branchini, E., et al. 1998, preprint (astro-ph/9810106)
- (3)
- (4) Burstein, D. & Heiles, C. 1982, AJ, 87, 1165
- (5)
- (6) Dale, D. A., Giovanelli, R., Haynes, M. P., Campusano, L. E., Hardy, E. & Borgani, S., 1998, ApJ, in press (astro-ph/9810467)
- (7)
- (8) Djorgovski, S. & Davis, M. 1987, ApJ, 313, 59
- (9)
- (10) Dressler, A., Lynden-Bell, D., Burstein, D., Davies, R. L., Faber, S. M., Terlevich, R. J., Wegner, G., 1987, ApJ, 313, 42
- (11)
- (12) Eke, V. R., Cole, S., & Frenk, C. S. 1996, MNRAS, 282, 263
- (13)
- (14) Feldman, H. A. & Watkins, R. 1994, ApJ, 430, L17
- (15)
- (16) Giovanelli, R., Haynes, M. P., Wegner, G., Da Costa, L. N., Freudling, W., & Salzer, J. J. 1996, ApJ, 464, L99
- (17)
- (18) Giovanelli, R., Haynes, M. P., Herter, T., Vogt, N. P., Wegner, G., Salzer, J. J., Da Costa, L. N., & Freudling, W. 1997, AJ, 113, 22
- (19)
- (20) Giovanelli, R,. Haynes, M. P., Freudling, W., da Costa, L. N., Saltzer, J. J., & Wegner, G. 1998, ApJ, 505, L91
- (21)
- (22) Hudson, M. J., Lucey, J. R., Smith, R. J., & Steel, J. 1997, MNRAS, 291, 488 (H97)
- (23)
- (24) Jaffe, A. H. & Kaiser, N. 1995, ApJ, 455, 26
- (25)
- (26) Kaiser, N. 1988, MNRAS, 231, 149
- (27)
- (28) Kogut A., et al. 1993, ApJ, 419 1
- (29)
- (30) Kolatt, T. & Dekel, A. 1997, ApJ, 479, 592
- (31)
- (32) Lauer, T. R. & Postman, M. 1994, ApJ, 425, 418 (LP)
- (33)
- (34) Lucey, J. R., Dickens, R. J., Mitchell, R. J., & Dawe, J. A. 1983, MNRAS, 203, 545
- (35)
- (36) Lynden-Bell, D., Faber, S. M., Burstein, D., Davies, R. L., Dressler, A., Terlevich, R. J., & Wegner G., 1988, ApJ, 326, 19
- (37)
- (38) Müller, K. R., Freudling, W., Watkins, R. & Wegner, G. 1998, preprint (astro-ph/9809199)
- (39)
- (40) Pen, U.-L. 1998, ApJ, 498, 60
- (41)
- (42) Plionis, M. & Kolokotronis, V. 1998, ApJ, 500, 1
- (43)
- (44) Raychaudhury, S. 1989, Nature, 342, 251
- (45)
- (46) Riess, A. G., Press, W. H., & Kirshner, R. P. 1995, ApJ, 445, L91
- (47)
- (48) Riess, A. G., Davis, M., Baker, J., & Kirshner, R. P., 1997, ApJ, 488, L1
- (49)
- (50) Saglia, R. P., Colless, M., Burstein, D., Davies, R. L., McMahan, R. K., Jr., Watkins, R. & Wegner G., 1998, preprint (http://www.MPA-Garching.MPG.DE/cosmo/contributions.html)
- (51)
- (52) Scaramella, R., Baiesi-Pillastrini, G., Chincarini, G., Vettolani, G., & Zamorani, G. 1989, Nature, 338, 562
- (53)
- (54) Schlegel, D. J., Finkbeiner, D. P., & Davis, M. 1998, ApJ, 500, 525 (SFD)
- (55)
- (56) Smith, R. J., Lucey, J. R., Hudson, M. J., & Steel, J. 1997, MNRAS, 291, 461 (S97)
- (57)
- (58) Smoot, G. F., Gorenstein, M. V., & Muller, R. A. 1977, Physical Review Letters, 39, 898
- (59)
- (60) Strauss, M. A., Cen, R., Ostriker, J. P., Lauer, T. R., & Postman, M. 1995, ApJ, 444, 507
- (61)
- (62) Strauss, M.A. & Willick, J.A. 1995, Phys. Rep., 261, 271
- (63)
- (64) Tully, R. B., Scaramella, R., Vettolani, G., & Zamorani, G., 1992, ApJ, 388, 9
- (65)
- (66) Viana, P. T. P. & Liddle, A. R. 1996, MNRAS, 281, 323
- (67)
- (68) Watkins, R. & Feldman, H. A. 1995, ApJ, 453, L73
- (69)
- (70) Willick, J., 1998, preprint (astro-ph/9809160)
- (71)
- (72) Zaroubi, S., Zehavi, I., Dekel, A., Hoffman, Y., & Kolatt, T. 1997, ApJ, 486, 21
- (73)