Sect. 8: Diffuse matter in space , 09.03.1; 09.04.1; 13.09.3; 09.19.1; 13.18.3; 09.07.1
G. Lagache
The interstellar cold dust observed by COBE
Abstract
Using DIRBE and FIRAS maps at high latitude () we derive the spatial distribution of the dust temperature associated with the diffuse cirrus and the dense molecular clouds. For a emissivity law, we find that the equilibrium dust temperature of the cirrus is about 17.5 K with only small variations over the high latitude sky. Comparison of the far Infrared DIRBE maps shows the presence of a colder emission component with a temperature around 15 K, assuming a emissivity law. The lowest values of the temperature found in the cold regions ( K) are compatible with the results recently obtained for dense cores in star forming regions by the balloon-borne experiment SPM-PRONAOS (Ristorcelli et al., 1996, 1998, Serra et al., 1997). This cold component is in particular present in the direction of known molecular complexes with low star forming activity such as Taurus. The association between the cold component and molecular clouds is further demonstrated by the fact that all sky pixels with significant cold emission have an excess IR emission with respect to the high latitude IR/HI correlation. We have deduced a threshold value of the column density, NHI=2.5 H cm-2, below which cold dust is not detected within the FIRAS beam of . We have re-examined the problem of the existence of a very cold dust component ( K) by combining DIRBE maps of the cold emission with FIRAS spectra, corrected for the isotropic component found in Puget et al. (1996). The warm and cold component deduced from the analysis of DIRBE maps account for the Galactic FIRAS spectra with no need for a very cold component ( K).
keywords:
ISM: clouds, ISM: dust, extinction, Infrared: ISM: continuum, ISM: structure, ISM: general, Radio-continuum: ISM1 Introduction
Much has been learned about the emission of the interstellar dust from IRAS
observations. To account for the Galactic energy emitted in the near to far infrared, it
is necessary to have a broad dust size distribution from large grains
down to large molecules.
For example, Désert et al. (1990) (see also Draine & Anderson 1985,
Puget et al. 1985, Weiland et al. 1986, Siebenmorgen & Krügel 1992
and Dwek et al. 1997) have proposed a consistent interpretation of both
the infrared emission in diffuse HI clouds and the interstellar extinction
curve using a model with three components: PAHs (Policyclic Aromatic
Hydrocarbons), very small grains (VSGs) and large grains.
PAHs and VSGs are small enough ( nm) to experience significant temperature fluctuations
after photon absorption. They emit over a wide range of temperatures and dominate
the emission for .
The large grain component is the more traditional dust component historically inferred
from optical studies. These grains are in
equilibrium with the incident radiation field with a temperature
of about 17 K in the diffuse atomic medium.
The large spatial variations of the infrared spectrum over the
wavelenghts range have been interpreted as changes in the abundance of small
grains (Boulanger et al. 1990, Bernard et al. 1993).
With the DIRBE (Diffuse InfraRed Background Experiment) and FIRAS (Far InfraRed Absolute Spectrophotometer) instruments on board the COsmic Background Explorer (COBE) satellite, we have a measure of the whole emission spectrum of the interstellar dust from the near infrared to millimeter wavelengths. The mean Far Infrared (FIR) and submillimeter (submm) spectrum of the whole Galaxy was first derived by Wright et al. (1991) using the FIRAS data. They showed that this spectrum can be fitted by a single temperature component with an emissivity index () equal to 1.65 (T=23.3 K) or by a two temperature model assuming =2 (=20.4 K and =4.77 K), with a statistically better agreement for the two component model. More recently, Reach et al. (1995) have followed this analysis by performing a spectral decomposition of the FIRAS data for 146 bins over the whole sky. They have identified a very cold Galactic component (4-7 K) correlated with the warm component (16-21 K). The correlation strongly suggests a Galactic origin for the very cold component. The presence of such a component questioned our understanding of the physics of the FIR Galactic emitters. Only clouds with a central extinction higher than a few tens could sufficiently attenuate the heating rate for classical interstellar grains (graphite or silicate). Such high extinction corresponds to very dense molecular clouds which are not ubiquitous in the Galaxy. The presence of a very cold emission component outside high extinction regions would thus demonstrate the existence of a yet unknown dust component (e.g. needle-like or fractal grains, or very large particles) and/or a departure from a power-law emissivity due for example to a sub-mm spectral feature. However, the Reach et al. (1995) analysis is based on total power FIRAS spectra which could include a non-Galactic emission component. Using HI data in addition to FIRAS spectra, Puget et al. (1996) have found, in the residual emission after the removal of the HI correlated emission, an isotropic component which could be the Cosmic Far Infrared BackgRound (CFIBR) due to distant galaxies. At , at least one third of the emission at comes from the isotropic component which should strongly contaminate the analysis of faint regions of Reach et al. (1995). However, this isotropic component cannot explain the observed correlation between the warm and very cold optical depths.
Boulanger et al. (1996) and Dwek et al. (1997) have derived the emission spectrum of dust using the spatial correlation of the FIRAS data with Galactic templates. This spectrum is insensitive to any isotropic terms (as the CFIBR). The spectrum of Dwek et al. was obtained by deriving the slope of the vs correlation diagrams at high latitude. Boulanger et al. have used the correlation between the FIR and HI 21cm emission to estimate the spectrum of dust associated with HI gas. Both spectra are very well-fitted by a single modified Planck curve with a emissivity law and a temperature of 17.5 K. No significant very cold component is detected in the diffuse medium at high latitude.
In this paper, we present a statistical analysis of the dust temperature in the nearby interstellar medium seen at , using DIRBE and FIRAS data. We show that the dust in molecular clouds is colder than in diffuse atomic gas and argue that the detection of very cold dust is due to the combined emission of the isotropic background and cold molecular clouds. In Sect. 2, we present the data we have used. The map of the large grain temperature is derived and analysed in Sect. 3. The DIRBE data at m allow us to build the maps of the excess of the FIR/60 correlation (Sect. 4a). These excess maps trace the cold molecular clouds (Sect. 4b-c) and thus correspond to the cold component of the dust emission. The cold maps, combined with FIRAS spectra, point out the significant difference in the dust temperatures in the atomic and molecular parts of the ISM in the whole sky (Sect. 5.1). The FIRAS residual emission is discussed in Sect. 5.2. A general discussion is presented in Sect. 6.
2 Data presentation and preparation
DIRBE is a photometer with ten bands covering the range from to with 40 arcmin resolution (Silverberg et al. 1993). We restrict our analysis to because our study is focused on the large grain emission of the ISM. We use annual averaged maps because they have a higher signal to noise ratio than maps interpolated at the solar elongation of (see the DIRBE explanatory supplement).
The FIRAS instrument is a polarising Michelson
interferometer with resolution and two separate bands which have a
fixed spectral resolution of 0.57 cm-1 (Fixsen et al. 1994). The low frequency band
(2.2 to 20 cm was designed to study the
CMB and the high frequency band (20 to 96 cm-1)
to measure the
dust emission spectrum in the Galaxy. We use the
so-called LLSS (Left Low Short Slow) and RHSS (Right High Short Slow) data
which cover the low and high frequency bands respectively
(see the FIRAS explanatory supplement).
Since in our study we combine the FIRAS and DIRBE data at 140 and ,
we have first to check their
consistency. For that, we convolve the FIRAS spectra inside the two DIRBE bands
at 140 and and the DIRBE data (at 140 and ) with the FIRAS Point Spread Function
(PSF).
The PSF is not precisely known for all wavelengths, so we use the approximation
suggested by Mather (private communication)
of a diameter circle convolved with a line of length
perpendicular to the ecliptic plane (Mather et al. 1986).
The pixel to pixel correlation shows that the difference of
responsivity between the two instruments is at and
at .
Before studying the Galactic emission, we have subtracted the CMB and its dipole
emission from the FIRAS data using the parameters given by
Mather et al. (1994) and Fixsen et al. (1994).
To remove the interplanetary dust emission, we consider the map as
a spatial template for the interplanetary dust emission. For the 60 and
maps, we use the zodiacal emission ratios given by Boulanger et al. (1996).
At longer wavelength, we follow
Reach et al. (1995) by taking a zodiacal spectrum .
To analyse the Galactic emission, it is necessary to choose a reference zero
emission level because the sky brightness may contain an
isotropic component (Puget et al. 1996).
Following Puget et al., we choose as a reference the extrapolated value
for zero HI column density of the FIR-HI correlation.
We found an extrapolated emission of
0.65 MJy/sr and 0.56 MJy/sr for the DIRBE 240 and data (convolved with
the FIRAS PSF).
These values are lower than the minimum emission measured in the maps
(equal to and MJy/sr at 240 and respectively),
which shows that all DIRBE pixels (at resolution)
contain a significant Galactic contribution.
For the analysis of the large grain temperatures, in Sect. 3, we subtract from the DIRBE data
at 240 and
0.65 and 0.56 MJy/sr respectively. From the FIRAS data, we subtract the zero HI column density spectrum
of Puget et al. (1996) smoothed to the resolution of 5.7 cm-1.
It is important to check that the reference flux is consistent between DIRBE and FIRAS.
For this, we compare the DIRBE and FIRAS data at high Galactic latitude at
and find an
offset I(DIRBE)-I(FIRAS) equal to -0.15 MJy/sr.
The DIRBE reference zero emission level at
corrected for this difference
is in perfect agreement with the residual spectrum of Puget et al. (1996).
The brightness values subtracted from the DIRBE data should not be used as an estimate of the
CFIBR since it may contain some Galactic emission that is associated with the diffuse ionised
gas. These brightness values are lower than the upper limits on the CFIBR (1.76 and 2.66 MJy/sr
at 240 and respectively) derived by Hauser (1995).
3 Large grain temperature maps
In this section, to study the spatial variations of the temperature,
we assume that each individual spectrum can
be represented as a single modified Planck curve
with a emissivity law. Obviously the hypothesis of a single temperature
is not valid in molecular regions and near the Galactic plane where
several clouds with different temperatures overlap. The
temperatures of large grains are
computed from the ratio of DIRBE emissions at 240 and (taking into
account the bandpass) at the FIRAS resolution.
The very cold component ( K) if it exists does not
significantly contribute to these bands.
We have not used the DIRBE data at shorter wavelengths (60 and )
since (1) small grains contribute significantly to the emission
(Désert et al. 1990, Sodroski et al. 1994, Laureijs et al., 1996) and
(2) the reference zero emission level is difficult to
evaluate because of the residual zodiacal emission.
Fig. 1 shows the temperature map. Uncertainties are about 5 mK for , 50 mK for and 300 mK at higher Galactic latitudes. These errors are estimated using uncertainties in the DIRBE flux obtained by convolving the rms DIRBE maps with the FIRAS PSF.
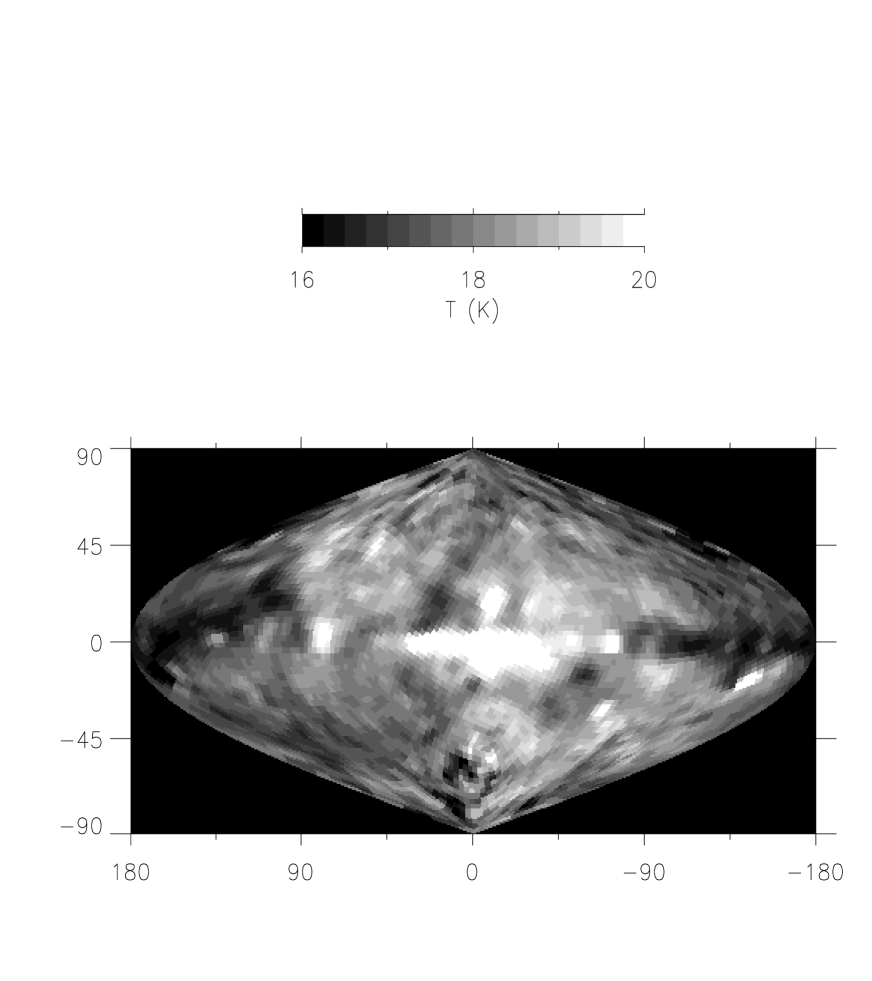
Most of the variations visible on Fig. 1 are real. Star forming molecular regions (e.g. Orion and Ophiucus) have a higher temperature due to dust heated by embedded young stars, while the temperature of clouds forming low mass stars is lower (Taurus, part of Cygnus, Chamaeleon, Polaris…). Cold spots in the south and north polar caps are not significant since they correspond to regions with very low emission in the 140 and maps. Cuts along the Galactic plane confirm the decrease of the temperature with increasing galactocentric distance already studied by Sodroski et al. (1994).
The scatter diagram presented in Fig. 2 does not show any systematic variation of the temperatures with the Galactic latitude, which suggests a relatively constant InterStellar Radiation Field (ISRF) on large angular scales. At smaller scales (), temperature variations at high latitudes (outside large molecular complexes) indicate a variation of the ISRF smaller than .
It is also possible to build a map of large grain temperature with the FIRAS data by fitting each spectrum with a modified Planck curve. The signal to noise ratio of individual spectra is low and temperature uncertainties are typically two times higher than the DIRBE ones. However, differences of temperatures obtained from these two independent datasets are within the uncertainties.

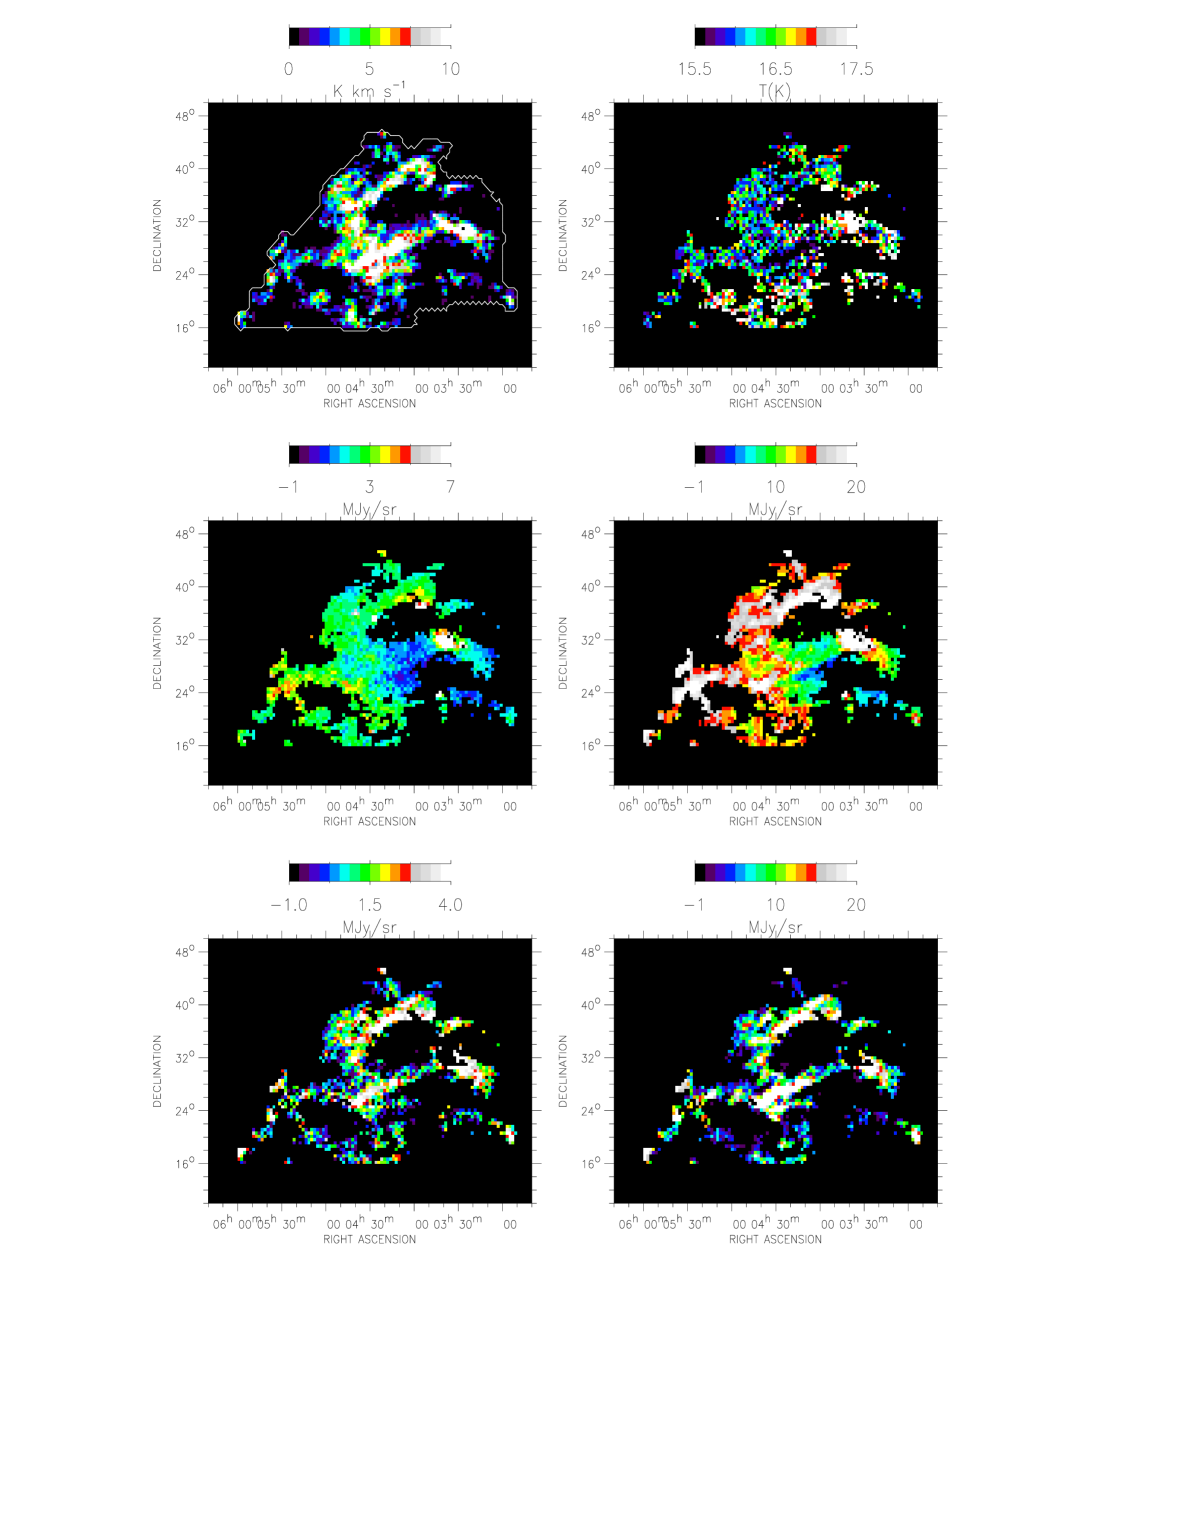
The ISM is known to contain structures over a very wide range of scales with inhomogeneous physical conditions. Temperatures presented in Fig. 1 correspond to values averaged along the lines of sight and within the FIRAS beam. For pixels with a high signal to noise ratio (especially at ), the DIRBE data without any convolution allow the visualisation of spatial variations of the temperatures at a resolution of 40’ (Fig. 3). For the Taurus, Auriga and Perseus (TAP) region, the 12CO () integrated emission map obtained by Ungerechts & Thaddeus (1987) at a resolution of is compared in Figs. 4a-b to the temperature map at the DIRBE resolution (projected upon the 12CO grid). We see that, within this field, there are significant temperature variations (Fig 4b). The regions of cold temperatures spatially correlate with the 12CO filaments. The highest temperature in Perseus (, ) corresponds to the IC 348 HII region (also known as the Per OB2 cloud).
4 Cold emission maps
4.1 Maps of FIR excess with respect to the 60 emission
Studies based on IRAS images have revealed, for dense clouds, sharp increases of without any counterpart of (Laureijs et al. 1991 and Abergel et al. 1994). It is illustrated for the TAP region Figs. 4c-d. Image of the component of the dust emission in excess at 100 (Fig. 4e) is computed using =-x, where R(100,60) is the ratio assumed constant for the neighbouring emission (”cirrus” component). The emission in excess has been found to be correlated with the emission of dense gas in 13CO. In this section, we extend the IRAS excess component analysis to longer wavelenghts using the DIRBE data.
Let () be the DIRBE emission at 100, 140 and respectively, and R(,60) the flux ratio observed in ”cirrus” clouds. The excess maps are computed at each wavelength according to the relationship: .
The vs correlation diagrams (used to derive ) present a high dispersion due to real color variations across the sky (due to temperature effects and/or abundance variations). However, the signal to noise ratio and the angular resolution of DIRBE data do not allow a proper determination of the spatial variations of over the whole sky. Therefore, we have decided to work with averaged values estimated by eye-fitting the vs correlation diagrams for all pixels at and , outside known molecular complexes and the Magellanic Clouds. These values are equal to , and at 240, 140 and respectively. The error bars are due to the dispersion of the points.
Using these three color ratios, we can also compute R(140,100) and R(240,100) (see Table 1). They are remarkably close to the slope of the vs correlation diagrams in Dwek et al. (1997). The discrepancy observed for R(100,60) is due to the fact that we do not study the same part of the sky ( and for Dwek et al.). With the same data points as ours and the same data preparation as Dwek, a value of 3.4 is obtained (Arendt, private communication), which is very close to our value of 3.2. Our color ratios differ significantly from those of Boulanger et al. (1996), especially R(240,100). We have checked that these differences cannot be accounted for by the fact that we do not study the same part of the sky. The color ratios depend on which map is used as independent variable for the correlation (HI for Boulanger et al., for Dwek et al. and in the present study).
| Publications | R(100,60) | R(140,60) | R(240,60) | R(140,100) | R(240,100) |
|---|---|---|---|---|---|
| This paper (1) | |||||
| Dwek et al. (1997) (2) | 6.25 | 1.93 | 1.28 | ||
| Boulanger et al. (1996) (3) | 2.36 | 2.02 |
(1) Ratios are estimated via the emission (for and )
(2) Ratios are estimated via the emission (for and )
(3) Ratios are estimated via the HI emission (for )
We have used our estimates of (given in Table 1) to compute the excess component maps at 100, 140 and . These maps still contain a zodiacal residual emission (mainly coming from the map) visible on large scale. It is difficult to produce all sky maps so we decide to concentrate our study on local features. Low frequency structures in excess maps are removed using a x median filter. The filtering also corrects for the large scale variations of the color ratios and for the isotropic contributions (as the CFIBR).
4.2 Temperature of the excess component in the Taurus, Auriga and Perseus region
The excess maps at 100 and in the TAP region are presented Figs. 4 e-f. We have chosen 8 lines of sight to determine the temperature of the dust associated with the filaments in excess (Table 2, T1). It is clear that these filaments correspond to cold regions with temperatures around 13 K.
To test the effect of spatial variations from cloud to cloud in the color ratios R(,60), we have derived the temperatures using excess maps computed with local color ratios derived in the vincinity of the TAP region: R(240,60)=8, R(140,60)=10 and R(100,60)=5. The new temperatures we obtain are very close to the ones determined with the averaged color ratios (Table 2, T1 and T2). We see that variations in the color ratios do not affect the determination of the temperatures by more than 0.2 K.
Finally, to check whether the temperature determination may be biased by the 60 removal, we compute the temperature using an ”ON-OFF” method: a background emission is estimated for each pixel of the filaments at a distance of typically (OFF position). This background is locally removed from the emission. Temperatures derived with this method are very close to the ones derived with the excess maps (Table 2). Therefore, we conclude that all bright filaments in the excess maps of the TAP region definitively correspond to cold filaments. We will see in Sect. 5 that we can generalise this result for the whole sky at . So, in the following, the excess maps are called “cold emission maps”.
| RA (1950) | DEC (1950) | T1 (1) | T2 (2) | T3 (3) |
|---|---|---|---|---|
| 04h03m33.64s | 40d24m36.8s | 14.60.3 | 14.60.3 | 15.30.6 |
| 04 13 11.65 | 28 43 12.6 | 12.90.2 | 13.00.2 | 13.20.2 |
| 04 16 15.12 | 38 10 35.1 | 14.00.2 | 13.90.2 | 14.30.2 |
| 04 20 20.24 | 37 24 39.3 | 13.50.2 | 13.30.3 | 14.90.2 |
| 04 23 41.15 | 27 20 1.8 | 13.90.3 | 13.90.3 | 14.90.3 |
| 04 27 6.25 | 24 40 18.0 | 12.60.3 | 12.50.3 | 13.70.4 |
| 04 27 18.82 | 24 22 7.6 | 12.50.2 | 12.40.2 | 13.30.3 |
| 04 35 9.36 | 26 14 4.6 | 13.20.3 | 13.00.2 | 13.50.2 |
4.3 Correlation of the cold component with molecular gas
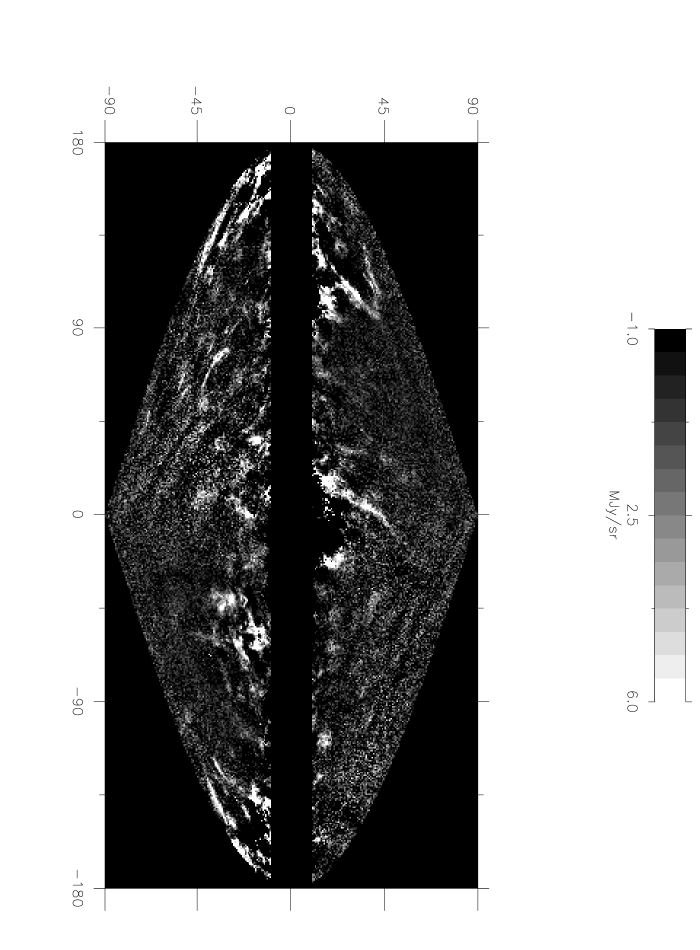
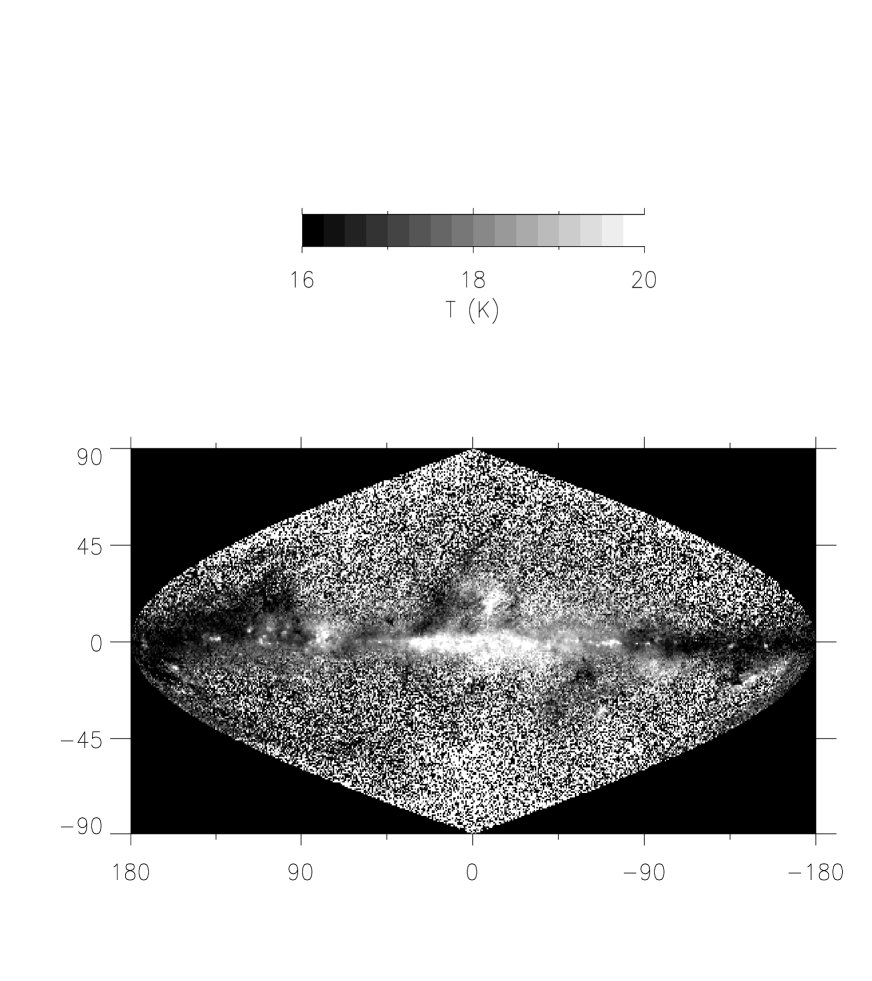
The whole sky map of the cold component at is presented in Fig. 5. We exclude in our analysis the regions at because of high spatial variations of . All bright features at are associated with large molecular complexes: Polaris, Camelopardalis and Ursa Major (, ), Chamaeleon (, ), part of Orion (, ) and Taurus (, ) as illustrated in more details in Figs. 4e-f. The network of bright filaments at negative latitudes around and is associated with molecular emission near the OB association I Lacerta. However, not all molecular complexes are visible on Fig. 5. For example, most of the Ophiuchus complex is not detected, since it contains several B stars and a large number of embedded young stellar objects. We can also compare the 240 cold map to the map of the residuals of the IR/HI correlation (Boulanger et al. 1995). All structures in the cold maps appear as positive excess in the IR/HI residuals, but the reverse is not true. Locally heated molecular clouds and ionised clouds are not present in Fig. 5 (as the one around the nearby star Spica located at , , Zagury et al., 1998).

Boulanger et al. (1996) have correlated the FIR emission from dust as measured by COBE at high with the 21-cm emission from gas as measured by the Leiden/Dwingeloo survey of HI (Hartmann & Burton, 1997). At all wavelenghts (), the correlation is tight for NHI5 H cm-2. For higher NHI, the data points depart from the low emission correlation. They interpret the change in the slope in the FIR-HI correlation as an increasing contribution of molecular gas for NHI larger than 5 H cm-2. The -HI correlation at the FIRAS resolution is shown in Fig. 6 for , using the same HI dataset. We have surrounded all data points for which the cold component is detectable (see Sect. 5.1) at . Most of these ”cold pixels” depart from the low correlation emission (continuous line of Fig. 6 from Boulanger et al., 1996) because of the increasing contribution of cold molecular regions. The other points which also depart from the low HI column density correlation correspond to emissions coming from (1) HII regions, (2) warm molecular clouds and (3) cold molecular clouds too small to be detected as such in the FIRAS beam. The minimum HI column density for the ”cold pixels” at is 2.5 H cm-2. We consider this value as a threshold for the detection of cold emission in DIRBE data convolved in the FIRAS beam.
5 FIRAS spectra of the warm and cold components
In this section, we combine the DIRBE and FIRAS data to extend the study of the Galactic emission (especially the separation between the warm and cold components) to longer wavelenghts. Thus, we work at the FIRAS resolution of .
5.1 Temperature and optical depth of the cold and warm components
We convolve the cold DIRBE emission maps
with the FIRAS PSF (, and
). These maps contain the emission of the cold dust
component in the FIRAS beam.
Even with the low FIRAS resolution, pixels for which the cold component
is significant can be identified.
To select these pixels, we compute the root mean square ()
for each cold map
by fitting the brightness histograms by a gaussian curve.
We find =0.41 MJy/sr,
=0.54 MJy/sr and =0.22 MJy/sr.
The dominant sources of noise are spatial variations in .
We restrict our analysis to and separate the data in two sets
with and without significant cold emission. The pixels with significant
cold emission are defined with:
at 100, 140 and .
Mean cold emissions are equal to 1.0, 3.5 and 3.9 MJy/sr at
100, 140 and respectively.
The spectra of pixels with no significant cold emission ( of the sky) are
fitted by a single temperature Planck curve
with a emissivity law. The mean temperature for this set of pixels
is equal to 17.5 K with a dispersion of 2.5 K. The high dispersion comes from low
signal to noise ratio of individual FIRAS spectra at high Galactic latitude.
Therefore, we confirm that
the averaged temperature of the interstellar dust in the atomic medium
is rather uniform and of about 17.5 K (Désert et al. 1990,
Boulanger et al. 1996).
For pixels with significant cold component (206 pixels which represent
3.4 of the sky),
we measure the optical depth
and temperature of the warm and cold components.
Let be the intensity of the DIRBE emissions at the FIRAS resolution,
the intensity
of the ”cirrus” contribution (which represents the HI clouds and warm molecular envelops)
and the intensity
of the cold dust contribution.
We compute using:
= -
The temperature and optical depth of the
”cirrus” component ( and ) are computed using
/ and
assuming a emissivity law. Then, cold component spectra are obtained by
removing the ”cirrus” modified Planck curves, defined by and ,
from the FIRAS spectra. Each of these cold component spectra is fitted
by a modified Planck curve with a emissivity law
(the line at is removed
before doing the fits). We have checked that a free does not significantly
decrease the 2 value of the cold component fits. As an illustration,
fits of the cold component spectrum at and
with (a) T=19 K,
, =1.4 and (b) T=15.25 K,
, =2 give the same 2 value of 1.26.
We see that the poor signal to noise ratio does not
allow to constrain .
Moreover, the signal to noise
ratio of individual cold spectra is too low for about of them to even determine
properly the temperature and optical depth assuming =2.

The signal to noise ratio is larger with DIRBE than with FIRAS data. Thus, we use the DIRBE 100, 140 and cold maps to compute the temperature and optical depth of the cold component. We assume a emissivity law since the emissivity index () cannot be properly constrained. This emissivity law corresponds to standard interstellar dust grains (Draine & Lee, 1984). The cold component has optical depths (normalised to 1 cm-1) distributed around 5.3 with a dispersion of 4.1 and temperatures distributed around 15 K with a dispersion of 0.8 K (Fig. 7). The coldest temperatures (13 K) are located in the Taurus region. Then, we derive spectra of the dust outside cold regions (”cirrus” component) by subtracting the cold modified Planck curve defined by and from the FIRAS spectra. Finally, each ”cirrus” spectrum is individually fitted in order to determine and . The ”cirrus” component has optical depths distributed around 9.8 with a dispersion of 6.1 and temperatures distributed around 17.8 K with a dispersion of 1.2 K (Fig. 7). These temperatures are significantly different from the cold temperatures determined for the same set of pixels. An example of the decomposition in two components is shown in Fig. 8 for one pixel located in the Chamaeleon complex ( and ).

5.2 Residual emission
The presence of very cold dust (T=4-7 K), not detectable using the DIRBE data at 140 and 240 , may be revealed on the residual FIRAS emission. We compute two residual spectra: one for regions with detected cold emission, by removing the cirrus and cold contributions from the FIRAS spectra, and one for regions with no detected cold emission, by removing only the cirrus contribution from the FIRAS spectra. In Fig. 9, we present the mean emission spectra of the warm and cold components together with the mean residual spectrum for regions with detected cold emission. The mean residue is negative in the range (2 of the total mean emission) and positive above (15 of the total mean emission at ). We have checked that this pattern persists if we fit the spectra with a fixed emissivity index different than 2.

The residual to the one temperature fit of spectra without cold emission shows a similar pattern, comparable to the positive submm excess of Dwek et al. (1997). This excess is typically 25 times smaller than the one detected in Reach et al. (1995). It could be due to very cold dust but we have checked that a temperature distribution of the Galactic components qualitatively reproduces the spectral shape of the residues. We have seen (in Sect. 5.1 and Fig. 7) that the temperature of the ”cirrus” is K while the temperature of the cold regions can be as low as 13 K. Obviously, inside the FIRAS pixels with detected cold emission, there is a range of temperature at least from to . Moreover, the cold regions appear to coincide with molecular clouds which have a typical size smaller than the FIRAS and DIRBE beams. Therefore, pixels with no detected cold emission can also contain small size molecular clouds inducing a range of temperatures. Our residual emission does not contain any detectable very cold dust.
6 Discussion
6.1 Warm and cold components
We have used the spectral information of DIRBE and FIRAS to separate the
different emissions of the ISM. The predominant emission of the whole sky in the FIR
comes from ”cirrus” clouds (as defined earlier: HI clouds and
warm molecular envelopes).
The large grain temperature in ”cirrus” is relatively uniform
and around 17.5 K (Sect. 5.1).
We do not see any systematic variation of the temperatures with the Galactic
latitude which suggests
a relatively constant ISRF on very
large angular scales.
For a emissivity law, the dust temperature scales as the radiation field
intensity to the power 1/6 and the spatial variations
of temperature can be converted to variation in
the radiation field intensity smaller than .
The cold component of the dust emission with a temperature K
is spatially correlated with large molecular
complexes with low star forming activity. The coldest temperature is K.
Since these temperatures are averaged
inside the FIRAS beam, the physical value of the dust temperature in
molecular regions can obviously be lower than 13 K. Such cold temperatures
have also been found by the balloon-borne experiment PRONAOS in
several dense cores in star forming regions with an angular resolution of 2-3.5’ (Ristorcelli
et al., 1996, 1998, Serra et al., 1997).
An important question is to know whether the drop in the temperature is only due to the attenuation of the radiation field in the molecular clouds or whether it also results from a change in the large grain properties. If the small particles disappear by sticking onto large grains within dense gas, it is natural to speculate that the emissivities of the large grains are different. The large grains could become fluffy and this will affect the long wavelength emissivity (e.g Bazell and Dwek, 1990). The IRAS emission at 12 and is observed to drop where the cold emission is present, and this has been interpreted as due to a low abundance of PAHs and VSGs (Bernard et al., 1992). We find here that low abundances are correlated with the drop in the temperatures of large grains. We derive an averaged value of R(140,240) in cirrus clouds and in cold regions using the temperature histograms (Fig. 7). In Table 3 we compare these color ratios with those determined in the Bernard et al. (1992) model which computes with a radiative transfer code the FIR emission of a non-homogeneous, spherically symmetric cloud with a standard dust composition. The large error bars of our estimates of R(140,240), due to the dispersion of the temperature from clouds to clouds, do not allow to conclude if the drop in the temperature is only due to the attenuation of the radiation field or if it also results from a change in the large grains properties. It is necessary to study in detail individual molecular clouds which is beyond the scope of this paper which presents a statistical analysis on the whole sky.
| R(140,240) | |
| Cirrus clouds | |
| Cold regions | |
| Av=0 | 1.26 |
| Av=1 | 1.1 |
| Av=4 | 0.77 |
| Av=6 | 0.64 |
| Av=20 | 0.46 |


6.2 Very cold dust in the Galaxy ?
The problem of the presence of a very cold component in the Galaxy (T=4-7 K) is very important since a positive detection could possibly imply the existence of an unknown population of Galactic grains. Moreover, a very cold dust component at high Galactic latitude would produce a submm Galactic foreground extremely confusing for the future experiments dedicated to study the cosmological backgrounds. In this section, we compare our results with the previous studies of the submm emission of dust from balloon-borne experiments (Fischer et al., 1995 and Masi et al., 1995) and FIRAS data (Wright et al., 1991 and Reach et al., 1995).
Fischer et al. and Masi et al. have detected a submm excess (with respect to a modified Planck curve fit) around the star Pegasi and in the Aries and Taurus region respectively. Their results are strongly constrained by the absolute values of the IRAS emission. However, these values are uncertain, since the calibration of IRAS is known to be different from that of COBE, and depend on the angular scale of sources. COBE/IRAS brightness ratio of 0.7 applies to very large scale emission (Sodroski et al., 1994) but this factor is close to 1 for angular scales smaller than . Moreover, we detect a significant cold component with a temperature K in the FIRAS maps in both regions but no very cold dust emission. We can conclude that the regions mapped by these two balloon borne experiments are not representative of the diffuse interstellar medium and contain submm excess due to cold molecular clouds.
Reach et al. (1995) have fitted FIRAS spectra, averaged in several bins over the whole sky and in the Galactic plane, with two components and found that the optical depths of the very cold component (4-7 K) and warm component (16-21 K) are correlated. This result strongly supports the idea that the submm excess due to the very cold component has a Galactic origin. However, the Reach et al. analysis is based on total power FIRAS spectra which could include a non-Galactic emission component. Puget et al. (1996) have found, in the FIRAS data after the removal of the HI correlated emission, a positive residual emission. They argued that most of this emission comes from an isotropic component. At high latitudes, the presence of such an isotropic component can explain the detection of very cold emission with a two component fit (Fig. 10, to be compared to Fig. 3b of Reach et al.).
At intermediate latitudes (), the isotropic emission becomes negligible and therefore cannot explain alone the very cold component found by Reach et al. However, we have seen that most of the cold emission (15 K) is detected using DIRBE data in this part of the sky (Sect. 4 and Fig. 5). To check whether the submm excess of Reach et al. is due to this cold emission, we have built a synthetic spectrum (Fig. 11a) made of two modified Planck curves with temperatures and optical depths equal to the averaged values found for pixels with detected cold emission (Tcold=15 K, cold=5.3 , Tcirrus=17.8 K and cirrus=9.8 , see Sect. 5.1). The residual emission after removing a single component modified black body shows a submm excess comparable to that found in Reach et al. (Fig. 11 b). The addition of the isotropic component to the synthetic spectrum increases the amplitude of this excess (Fig. 11 c). The fit of the synthetic spectrum with two modified Planck curves produces a component at 8.4 K (Fig. 11d), which is an artefact due to the combination of the cold component at 15 K and the reference zero level emission spectrum. Therefore, we conclude that, out of the Galactic plane, the detection of very cold dust is due to the combination of the cold and isotropic components. The optical depth of the very cold component found by Reach is correlated to the optical depth of the warm component (Fig. 6 of Reach et al., 1995) since the cold molecular emission (15 K) globally correlates with the warm emission (cirrus clouds). In the Galactic plane, the detection of two correlated components is due to the high diversity of physical conditions (from HII regions to cold molecular clouds).


7 Conclusion
We have combined the DIRBE and FIRAS data to analyse the distribution
of dust temperatures in the nearby interstellar medium seen at .
The main results of this work follow:
(1) The sky-averaged temperature of the dust in the whole Galaxy
shows variations between lines of sight containing star forming molecular
regions, clouds forming low mass stars, and cirrus clouds.
At high latitude, the spatial variations
of the temperatures can be converted to variations in
the radiation field intensity smaller than .
(2) Maps of the excess of the FIR/60 correlation
trace the cold component of the dust emission.
This cold component appears to coincide with large molecular complexes
with low star forming activity (such as Taurus,
Polaris, Chamaeleon…). The association between the cold component and molecular clouds
is further demonstrated
by the fact that all sky pixels with significant cold emission have an
excess IR emission with respect to the high latitude IR/HI correlation.
(3) The combination of DIRBE maps of the cold
emission with FIRAS spectra have pointed out the
significant difference in the dust temperature for the diffuse and dense parts of the
interstellar medium
(T distributed around 17.5 K and 15 K respectively with a emissivity law in both
cases inside a beam of 7).
(4) The FIRAS spectral residues of our analysis do not indicate
any detectable very cold dust
(4-7 K) present in the Galaxy at the level found by Reach et al. (1995).
(5) We conclude that the “detection” of such a very cold dust in our Galaxy is
due to the presence of an isotropic background (Puget et al., 1996), together
with the cold molecular clouds identified from DIRBE data.
FIRAS spectra are very well decomposed by one isotropic component
and one or two Galactic components (Fig. 12 and 13).
Acknowledgements.
We would like to thanks F.X. Désert, J.P Bernard, Antony Jones and E. Dwek for enlightening discussions. Particular thanks go to W.T. Reach for helpfull comments and discussions. G.L. acknowledges the hospitality of the Goddard Space Flight Center in Maryland. We are grateful to the Goddard Space Flight Center team for introducing us to the COBE data.References
- [19954] Abergel, A., Boulanger, F., Mizuno, A., Fukui, Y. 1994, ApJ 423, L59
- [1993] Bazell, D. and Dwek, E. 1990, ApJ, 360, 142
- [1993] Bernard, J.P., et al. 1992 ApJ 263, 258
- [1993] Bernard, J.P., et al. 1993 ApJ 277, 609
- [1988] Boulanger, F., & Pérault, M. 1988, ApJ 330, 964
- [1990] Boulanger, F., et al. 1990, ApJ 364, 136
- [1995] Boulanger, F., et al. 1995, in “Unveiling the Cosmic Infrared Background” ed. E. Dwek, (AIP Conf. Proc. 348), p87
- [1996] Boulanger, F., et al. 1996, A&A 312, 256
- [1990] Désert, F.X., Boulanger, F., Puget, J.L. 1990, A&A 327, 215
- [1985] Draine, B.T., & Anderson, N. 1985, ApJ 292, 494
- [1984] Draine, B.T., & Lee, H.M. 1984, ApJ 285, 89
- [1997] Dwek, E., et al. 1997, ApJ 475, 565
- [1994] Fixsen, D.J., et al. 1994, ApJ 420, 457
- [1995] Fischer, M.L., et al. 1995, ApJ 444, 226
- [199] Hartmann, D., and Burton, W.B., Cambridge University Press, 1997
- [1995] Hauser, M.G., 1995, “Unveiling the Cosmic Infrared Background” ed. E. Dwek, (AIP Conf. Proc.)
- [1991] Laurejis, R.J., Clark, F.O., Prusti, T. 1991, ApJ 372, 185
- [1991] Laurejis, R.J., et al. 1996, A&A 315, L317
- [1995] Masi S., et al. 1995, ApJ 452, 253
- [1986] Mather, J.C., et al. 1986, App Opt 25, 16
- [1994] Mather, J.C., et al. 1994, ApJ 420, 439
- [1995] Puget, J.L., Léger, A., Boulanger, F. 1985, A&A 142, L19
- [1995] Puget, J.L., et al. 1996, A&A 308, L5
- [1996] Ristorcelli , I., et al. 1996, in “Diffuse infrared radiation and the IRTS”, Ed. H. Okuda, T. Matsumoto, T. Roelling
- [1996] Ristorcelli , I., et al. 1998, to be submitted
- [1995] Reach, W.T., et al. 1995, ApJ 451, 188
- [1992] Serra, G., et al. 1997, in “The Far Infrared and Submillimetre Universe”, ESA SP-401
- [1992] Siebenmorgen, R., & Krügel, E. 1992, A&A 259, 614
- [1993] Silverberg, R.F., et al. 1993, in SPIE Conference Proc. 2019 on Infrared Spaceborne Remote Sensing, San Diego
- [1994] Sodroski, T.J., et al. 1994, A&A 428, 638
- [1995] Ungerechts, H., Thaddeus, P. 1987, ApJS 63, 645
- [1986] Weiland, J.L., et al. 1986, ApJ 306, L101
- [1991] Wright, E.L., et al. 1991, ApJ 381, 200
- [1997] Zagury, F., et al. 1998, in preparation