Do the Spectra of Soft X-ray Transients Reveal Bulk Motion Inflow Phenomenon?
Abstract
We present our analysis of the high-energy radiation from black hole (BH) transients, using archival data obtained primarily with the Rossi X-ray Timing Explorer (RXTE), and a comprehensive test of the bulk motion Comptonization (BMC) model for the high-soft state continuum. The emergent spectra of over 30 separate measurements of GRO J1655-40, GRS 1915+105, GRS 1739-278, 4U 1630-47 XTE J1755-32, and EXO 1846-031 X-ray sources are successfully fitted by the BMC model, which has been derived from basic physical principles in previous work. This in turn provides direct physical insight into the innermost observable regions where matter impinging upon the event horizon can effectively be directly viewed. The BMC model is characterized by three parameters: the disk color temperature, a geometric factor related to the illumination of the black hole (BH) site by the disk and a spectral index related to the efficiency of the bulk motion upscattering. For the case of GRO J1655-40, where there are distance and mass determinations, a self consistency check of the BMC model has been made, in particular, the assumption regarding the dominance of gravitational forces over the pressure forces within the inner few Schwarzschild radii. We have also examined the time behavior of these parameters which can provide information on the source structure.
Using our inferred model parameters: color temperature, spectral index and an absolute normalization we present new, independently derived, constraints on the black hole mass, mass accretion rate and the distance for the aforementioned sources. Also notable is the relationship between the color temperature and flux, which for GRO J1655-40 is entirely distinct from a simple dependence, and strikingly consistent with the disk model we have invoked - standard Shakura-Sunyaev’s disk with the modification to the electron scattering. This provides insight into the origin of the seed soft photons, and allows us to impose an important estimation of the hardness parameter, , which is the ratio of the color temperature to the effective temperature - we find , higher than previous estimates used in the literature.
1 Introduction
Soft X-ray transients are sources of particular interest given their unique properties: bright sources of this group appear on X-ray sky once or twice per year, typically produce the flux from several hundred milliCrab to several Crab in maximum and fade back to undetectable level over time scales of weeks or months. During the outburst they undergo major changes in their X-ray luminosity and spectral shape. Typical spectral shapes for these sources are well-known (see Sunyaev et al., 1994; Tanaka and Shibazaki, 1996). There are several virtually irrefutable black hole candidates among these sources, based on quiescent optical observations. The binary mass functions, which represent a lower limit for the compact object mass, derived from such observations exceed upper theoretical limits for neutron star mass in some cases, so these objects are widely believed to be black holes (see e.g. McClintock, 1998, for recent review).
Over the last decade, observations clearly demonstrated the existence of at least two qualitatively different spectral states of Galactic black hole binaries (e.g. White et al 1984; Grebenev et al., 1991, 1992; Sunyaev et al., 1994; for recent review see e.g. Tanaka, 1997). A hard power-law-like spectrum was first identified for the prototypical black hole candidate Cyg X-1 (Tananbaum et al., 1972; Sunyaev & Truemper, 1979). It has subsequently been observed in many other systems. The commonly accepted mechanism for the generation of this hard radiation is thermal Comptonization (Shapiro, Lightman & Eardley, 1976; Sunyaev & Titarchuk, 1980, hereafter ST80). Applying the thermal Comptonization model to the hard-state BH spectra suggests the presence of a hot cloud surrounding the central object (BH) with typical plasma temperature around 60 keV and Thomson optical depth of order of 1. Such a cloud is able to Comptonize soft photons which originate in the central region.
For a number of years this spectral shape was considered to be a BH signature. Subsequently, however, similar spectra have been detected from several X-ray bursters (Mitsuda et al., 1989; Barret & Grindlay, 1995), and recently, from some X-ray pulsars (Negueruela et al., 1998; Gilfanov et al., 1998). The luminosities of these neutron star binaries are typically by an order of magnitude less than the Eddington limit. Thus it is clear that there are common spectral features in the BH and NS binaries under certain conditions. In contrast, the high-soft state spectra appear to be distinct. Neutron star binaries exhibit a soft thermal component characterized by color temperatures keV, which is interpreted as radiation emanating from the neutron star surface or an accretion disk and/or boundary layer. In the BH case we have a thermal component from accretion disk and often see an additional hard power law component dominating at energies higher than 10–20 keV.
There have been attempts to explain hard emission component of the high-soft state within the framework of the thermal Comptonization model which successfully describes the hard state spectra (for a recent review of models see Liang, 1998). We believe, that this approach encounters serious problems and cannot provide a clear physical picture without the inclusion of some rather ad hoc components. If one interprets the spectra observed as the result of the thermal Comptonization of soft disk photons in a hot corona situated close to the cold disk, then typical power-law indices of the high-soft state spectra, around 1.5, and high-energy cutoffs above keV require quite small optical depths, , (Titarchuk & Lyubarskij 1995, see Fig. 2 and Eqs. 14 and 16). The crucial question for such an interpretation is, how can one account for the observed stability of the spectral indices seen in the high-soft state spectra given the required high temperature of coronal plasma, keV. Taking into account the high efficiency of the energy amplification in such a hot corona, any variation in the optical depth by a factor of 2-3, which is natural to expect in a number of different sources, will lead to a detectable change of the spectral index, e.g. from 1 to 2. We would routinely detect large sporadic variations in the spectral slope, which is not what is in fact seen in observations. Another natural question is: why should extragalactic black hole sources, for which physical scales differ by orders of magnitude, keep the same invariable optical depth in their coronae? These and other difficult problems appear in connection with the interpretation of the high-soft state spectra by the models of the thermal Comptonization.
An alternative understanding has been developed in a series of papers, where the importance of bulk motion inflow in the formation of emergent spectra was taken into account (Chakrabarti & Titarchuk 1995; Titarchuk, Mastichiadis & Kylafis 1996, 1997; Titarchuk & Zannias 1998, hereafter TZ98). Tests applying the BMC model to data have thus far been encouraging (Shrader & Titarchuk 1998, herein ShT98).
In this paper we present results of our spectral analysis of X-ray transients in the high-soft states in terms of the bulk motion Comptonization (BMC) model. Over 30 spectra are utilized making this as comprehensive an observational test as is currently plausible. We describe observational data used and methods of analysis in §2. The main features of BMC model are outlined in §3. Results of our data analysis are presented in §4 and §5 is devoted to the physical parameter estimation based on our BMC model fitting results. The issue of the origin of the seed soft photons is considered in §6. The geometry of illumination of the converging site is discussed in §7. Discussions and conclusions are offered in §8.
2 Observations
We have analyzed publicly available RXTE data for five transients, which represent ultra-high spectral state of black hole candidates: GRS1915+105, GRO J1655-40, GRS1739-278, XTE J1755-324 and 4U1630-47. A list of observations is presented by Table 1 and the results of the spectral analysis are shown in Tables 2-3. We have analyzed 10 separate observations of GRS1739-278, 20 observations of GRO J1655-40, 2 observations of XTE J1755-324, 6 observations of 4U 1630-47. Our analysis showed that GRS1915+105 represents more complicated case, because this source undergoes dramatic changes in intensity and spectrum during single observational sessions. Spectra accumulated for periods of several seconds demonstrate quite noticeable difference between this source and other systems discussed here. We believe, that the origin of these differences is due to a much higher accretion rate in GRS1915+105, which causes the screening of black hole site by an optically thick plasma cloud. The unique properties of GRS1915+105 are a subject in and of themselves, and further discussion is beyond the general scope of this paper.
For broad band coverage of RXTE transients spectra we used the data from both main instruments onboard the satellite - the PCA and HEXTE spectrometers. For the processing of PCA data, the standard RXTE “FTOOLS” software was applied. Background estimation was carried out using the appropriate models for the bright or fainter objects as described by Stark et al. (1998 in preparation). The comparison between the modeled background spectrum and the observed one during off-source pointings showed count-rate uncertainties at the level of 2-5 percent. We used the estimated background, taking into account the variation of the background over the orbit. We used PCA data in the band from 3 to 20 keV, where effective area is large enough and background estimation is reasonably accurate. Furthermore, to avoid the potential problems with associated with the detailed structure of the soft disk-blackbody component we restricted ourselves to the 5–20 keV energy band. To account for the additional uncertainties in PCA response matrix, we added a systematic error of few percent per bin prior to spectral fitting. A deadtime correction was calculated according to Zhang et al., 1995. For HEXTE data analysis we used the version of response matrix released on April 3, 1997 and standard off-source observations of each cluster of detectors to subtract the background. The spectral band used was 15-150 keV, and a deadtime correction was applied. HEXTE data were included in our subsequent analysis only when they were statistically significant. The HEXTE data have been re-normalized based on the PCA. Finally, we note, that that there are known to be small cross-calibration discrepancies between the HEXTE and PCA instruments, but we do not believe that these are at a level which is likely to effect our basic conclusions.
In addition to the RXTE sample, we obtained archival data for covering of the April 1985 outburst of the transient EXO1846-031 with EXOSAT (Parmar et al. 1993). These data were obtained with the GSPC detector, covering a 2-20 keV bandpass, with a nominal energy resolution of . Although we do not have as large number of spectra as in several of the objects observed with RXTE, the addition of this object complements the RXTE sample in several important ways. For one, it is useful cross-check to further test the model using data from a separate instrument. Furthermore, EXO 1846-031 has an outburst history distinct from that of the other sources in our sample – it was detected in the EXOSAT era, and has not undergone subsequent activity like for example GRS 1915+105 which has essentially “stayed on” following its original outburst – it is thus in some sense more representative of the broader class of X-ray nova (e.g. Chen, Shrader & Livio 1997).
In addition to the RXTE and EXOSAT data, we have examined the higher-energy range covered by the Oriented Scintillator Spectrometer Experiment (OSSE) on board Compton GRO for high-soft-state transient episodes in two sources: GRO J1655-40 and XTE J1550-564. These data were obtained from the public archives; there were no concurrent soft-X-ray observations for the GRO J1655-40 data in question, and we do not currently have access to simultaneous Soft X-ray data for XTE J1550-564.
Our purpose in this case was to study the extent of the hard power law. GRO J1655-40-57 was observed with OSSE during CGRO on a number of occasions in 1994 and 1996 (Grove et al.1998; Tomsick et al. 1998). The Burst And Transient Source Experiment (BATSE) monitoring data, covering the nominal 20-200 keV energy range were examined to gauge the relative hard-X-ray intensity at the time of these observations. This led us to consider the OSSE data from viewing periods 405.5 (MJD 49693-49699) and 414.3 (MJD 49805-49811). In addition, we obtained the public OSSE data for XTE J1550-564 (Smith 1998). In each case, the data utilized were obtained in standard “chopping” mode with about 450 energy channels per detector covering the 50 keV - 10 MeV band with a nominal energy resolution of at 200 keV (for a technical description see Johnson et al. 1993). The standard -minute on- off-source accumulations were analyzed using the OSSE analysis software package,“IGORE”, incorporating the default calibration and background model parameters. Data summation, and response matrix generation were also performed using IGORE, and the resulting count spectra and response matrices were then imported into XSPEC for subsequent model fitting.
In our subsequent analysis, we are interpret the spectra thus obtained within the framework of bulk motion Comptonization (BMC) model. Analytical approximations of the model (Titarchuk, Mastichiadis, & Kylafis 1996, 1997, hereafter TMK; Titarchuk & Zannias, 1998, hereafter TZ98), the validity of which has been confirmed through Monte Carlo simulations by Laurent & Titarchuk 1998 (hereafter LT98), have been imported into the “XSPEC”software package with which our spectral deconvolutions have been performed.
3 Bulk-Motion Spectral Model
For our interpretation we assume the following overall geometry of the system. The plasma taken from optical companion is accreting as a sum of two components - one, which is Keplerian, forming an accretion disk and another, which is non-Keplerian, leading to a quasi-spherical accretion component that may eventually be stopped by a centrifugal barrier - or it may just smoothly proceed towards a black hole releasing energy due to Coloumb collisions, geometric compressions (Chakrabarti & Titarchuk, 1995, hereafter CT95) and viscous dissipation (Narayan & Yi 1994). Neither of these components can exist in the closes-in environment of the black hole, where nothing can stop the matter in its relativistic movement towards the event horizon. The regions involved in the X-ray emission are in this case 1) the internal part of the “classical” accretion disk; 2) a high-temperature region, the Compton cloud; and 3) internal bulk-motion Comptonization (BMC) region. The presence of the disk, itself is a sign that the radiation pressure in the system is much less the Eddington value - by factor of (where and are a disk half-thickness and radius respectively). In fact, the hydrostatic equilibrium in the disk can be sustained only if the local luminosity in the disk is an . Thus, the radiation cannot hold the matter situated outside the disk from entering in an almost free fall manner onto the black hole horizon. The accretion disk is believed to emit as a multicolor blackbody [see Shakura & Sunyaev (1973), hereafter SS73]. A high temperature region, which we refer to as the Compton cloud, is usually associated with the generation of Thermal Comptonized emission in the hard-low state. The Compton cloud however, will be substantially cooled by powerful flux of low energy photons from the disk, when the accretion rate increases and the system approaches its high-soft spectral state. The bulk motion region then becomes a principal source of hard X-ray photons.
It has been shown elsewhere (TMK97, TZ98, LT98) that two effects, the bulk motion upscattering and the Compton (recoil) downscattering, compete forming the hard tail of the spectrum as an extended power law. The soft part of the spectrum comes from the disk photons seen directly and a subset of those photons, which escape from the BMC atmosphere after undergoing a few scatterings but without any significant energy change. It has also been shown that, even neglecting special and general relativistic effects, one is able to reproduce the main features of the full relativistic formalism: the overall spectral energy distribution and the dependence of the high-energy power law on mass accretion rate (TMK97, Monte-Carlo calculations in LT98).
It is worth noting that BMC model predicts a specific feature - spectral turnover at the energies near the electron rest mass keV. The exact energy of the turnover is determined by several effects which can shift it in either direction. The turnover energy is a function of the plasma temperature which becomes increasingly sensitive for temperatures higher than 10 keV (LT98). There is also a possibility that the electron distribution in the converging inflow can deviate from a Maxwellian, flattening at high velocities, since there is insufficient time for it to thermalize (Ellison, Baring & Jones, 1996). The hard photon tail may then extend to higher energies. On the other hand, due to gravitational redshift and photon bending effects, the injected soft photons are not Comptonized very effectively. The hard tail of the BMC spectrum is quite steep – the energy spectral index is higher than 1 – and there is a notorious dearth of (net) photons in the low-energy gamma-ray band. Since the extent of the high-energy power law comprises a specific diagnostic of the BMC model, we examine what constraints current observations can impose in Section 5.
Any high-energy spectral feature related to a relativistic electron distribution, for example that which is presumably responsible for the appearance of jets, is not uniquely constrained to this energy band, i.e. not tied to . If the power-law component, or some other spectral feature is found to extend to energies MeV, one should consider alternative origins for this emission, such as relativistic jets. These are far less restricted in terms of possible Lorentz factors and thus potentially able to generate photons with extremely high energies.
Unfortunately, the data obtained so far for energies near 1 MeV are severely background limited (Grove et al. 1998) and cannot address this issue in a definitive manner. We hope that future gamma-ray missions (e.g. INTEGRAL) will be able to resolve such issues and help to delineate between the models. A more detailed discussion of BH spectra in gamma-ray band is well outside of the scope of this paper.
We have assumed that the external illumination of the converging (BMC) flow is due to low-energy thermal radiation from the accretion disk characterized by a temperature . This assumption is model independent. We show below (§5) that the multicolor disk model is reasonably well described by this shape in the energy band where the photon energies are always higher than the characteristic energies of the soft injected photons. This assumption is valid for the RXTE energy band (which starts from 3 keV) because the soft photon color temperature is always keV or less (some important exemptions will be discussed in the next section).
Furthermore, we have assumed that this illuminating radiation impinges on the BMC atmosphere in a manner characterized by a certain geometry, which we have paramaterized in terms of a geometric parameter . This parameter is really the first expansion coefficient of the spatial source photon distribution over the set of the eigenfunctions of the BMC formulation (TMK97, Eq. 30). It is easy to prove (using the property of the upscattering Green’s function to conserve the number of scattering photons) that is exactly the ratio of the number of photons multiply scattered in the converging inflow to the number of photons in thermal component. As it is clearly demonstrated in TMK97, TZ98 and LT98 the spectral index is independent of the illumination parameter, .
In §7 we discuss the possible scenarios of the illumination of the converging inflow region by the soft photons of the disk and some useful formulae for the factor are derived.
In the soft state when the accretion rate is higher, photons from the Keplerian disk cool the ambient Compton cloud through thermal Comptonization and free-free emission (CT95). The cooler converging inflow, as it rushes towards the black hole, scatters soft-photons within the radius, – some of the photons then undergo outward radiative diffusion. Here , is Schwarzschild radius, is the net accretion rate (including accretion from the disk plus any halo or other non-keplerian component), is the Eddington accretion rate, is the mass of the central object, is the proton mass and is the gravitational constant. Momentum is transferred to the soft-photons producing a power-law component extending to energies comparable to the kinetic energy of electrons in the converging inflow, i.e. of order keV. As we mentioned above the luminosity of the upscattered component, the hard power law, can be very small compared to the Eddington luminosity.
On the other hand in the hard state, the hot Compton cloud obscures the BMC region and no upscattered photons are seen.
The BMC spectral model can be described as the sum of a thermal (disk) component and the convolution of some fraction of this component with the upscattering Green’s function (TMK97, Eq. 30). The Green’s function has the form of a broken power-law with spectral indices and for high and low energy parts respectively,
| (1) |
The above convolution is insensitive to the value of the Green’s function spectral index , which is always much greater than one. The validity of this formalism has recently been confirmed through extensive Monte Carlo simulations (LT98). Furthermore, TZ98, using the full relativistic formalism, have demonstrated that for a Schwarzschild black hole, the extended power law is formed in the bulk motion inflow, the production of the hard photons as a function of radius peaks at ( is Schwarzschild radius) and that most of the hard photons observed are produced within . Furthermore, the same statement is valid for the case of a rotating (Kerr) black hole, although a higher mass accretion rate is required to provide the same efficiency for the soft photon upscattering.
For low plasma temperatures, one obtains a power-law energy index , which we note is the canonical value for the Narrow line Seyfert Galactic Nuclei (Brandt, Mathur & Elvis 1997). Furthermore Laurent & Titarchuk 1998, using Monte-Carlo calculations, have shown that the hard-soft transition can be achieved through the plasma temperature regulation in the bulk motion inflow from a few keV up to 50 keV. They have also shown that for the low temperature limit ( keV) the hard tail is formed, but when the temperatures approach 50 keV, the spectrum is almost indistinguishable from the thermal Comptonization case.
We note that the processes of absorption and emission, as free-free or synchrotron radiation, can be neglected provided the plasma temperature of the bulk flow is keV or greater for characteristic number densities cm-3 and for magnetic field strengths in the proximity of the black hole Gauss or less.
4 Spectra
Examples of our spectral fitting are presented in Figure 1. Application of the BMC model demonstrates good agreement with the data, even though the spectrum of accretion disk is approximated by a single-temperature black-body. For spectra extending below several keV, replacement of the single black-body by a multicolor disk component within the framework of BMC model is expected to be necessary, but given the limited soft sensitivity of RXTE, the single black body approximation is adequate for most spectra we have analyzed.
Editor: Place Figure 1 here
As we have noted, significant deviations from a single-temperature black body shape are expected in the emergent spectra due to electron scattering effects. This emergent “diluted” blackbody spectral form has been observed in GRS1915+105, GRO J1655-40 and 4U1630-47. A convolution of a black body function with Green’s function is needed to satisfactorily describe these spectra. One example, 4U1630-47, is illustrated in Fig.1. We believe, that in this case the soft photons site is screened by a plasma cloud, which dilutes incident spectrum with a net effect of shifting it to higher energies. Applying this assumption we are able to determine the temperatures characterizing the incident photon distribution and the cloud from the inferred parameters of our fit. Typical cloud temperatures are keV have thus far been obtained. We plan to study such spectra in more systematic manner and present these results elsewhere. Here we have concentrated on the more simple case, where the black body approximation is able to adequately represent the data.
In some cases these spectra can be satisfactorily fitted by the sum of two components: a multicolor disk component and a power law. Our approach has however, two important advantages. First, if one uses a simple sum of two such components, it is not known, how far the power law extends towards low energies. This lack of knowledge can potentially cause incorrect physical information to be inferred the parameters of the fit; notably the disk effective temperature. Thus, estimations of the total luminosity and energy inputs from both components can be inaccurate. Second, the BMC model parameters are physically meaningful, and from them one can derive important constraints on the geometry of the system, the central-object mass, the mass accretion rate and the distance to the source (see §5).
Editor: Place Figure 2 here
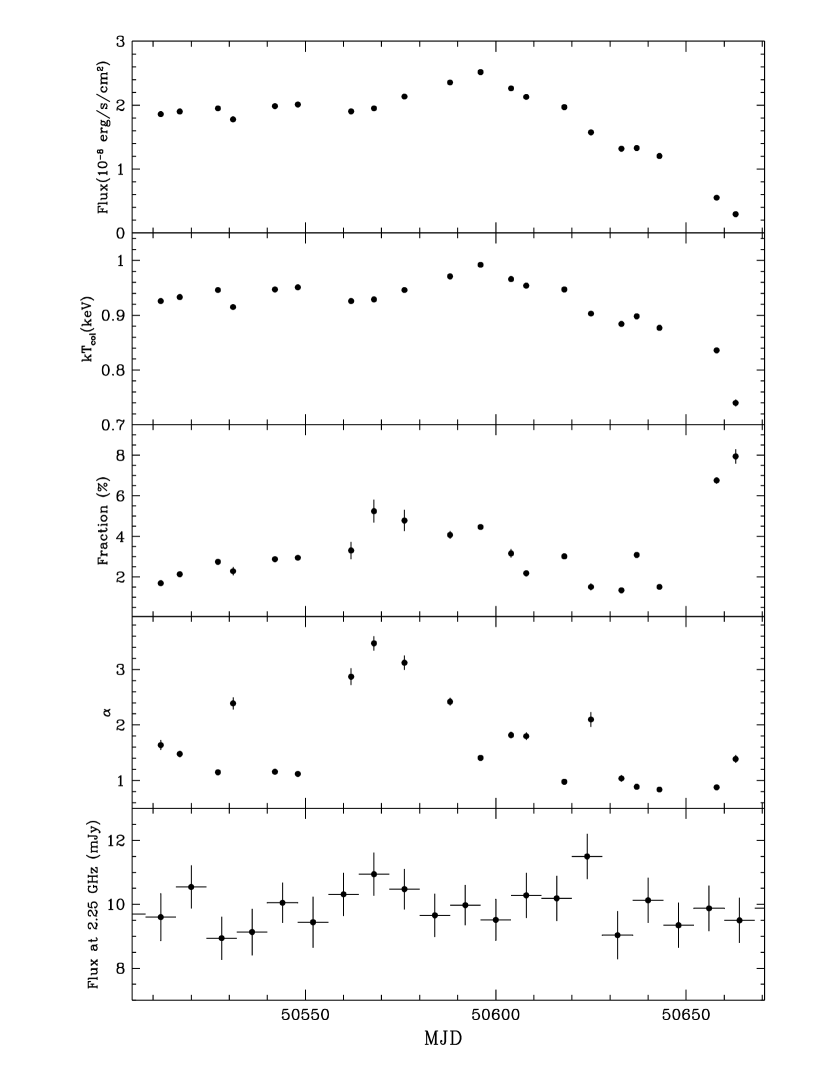
The RXTE coverage of GROJ1655-40 provides a good sample of high-state spectra. The variation of our derived parameters with time is presented in Fig.2. The correlation between the color temperature and X-ray flux is evident (see also Fig. 7 ), which is quite natural, since most of the observed photons come from the accretion disk. However, this correlation cannot be approximated by single function as one would expect in the case of constant effective area (a similar conclusion for GRS1739-278 is demonstrated in Borozdin et al., 1998). These results demonstrate that the effective radius of the accretion disk is variable and depends on variations in color temperature (§6 addresses this issue in detail). This became evident for the last five observations of this series where we see the beginning of the transition to the low-hard state, accompanied by a drastic decrease in color temperature. The soft component is no longer detected during following observations [see Trudolyubov et.al (1998), Sobczak et.al (1998)].
Another important result is the lack of an overall correlation between the disk color temperature and the power-law index. We see such a correlation, for example for the observation of March 24, 1997, when the drop in temperature corresponds to a steepening of the power-law. This is not the case, however, for other periods when the power-law became steep without any noticeable change of the temperature, namely, for a series of sessions between Apr 24 and May 20, and on June 26. We believe, that during these periods of time there might be some outflow from the black hole site, which reduces the amount of matter falling into the BMC region. Or there is another possibility that the increase of the spectral index (or softening of the spectrum) during the soft-high state can be also related with the downscattering degradation of the hard photons (produced in the very core of the bulk inflow region) when these photons escape towards an observer passing through the relatively cold optically thick material of the expanded disk during the flares.
To confirm this interpretation we have examined some radio measurements,which would support the presence of outflowing plasma during those periods.
We have studied publicly available data for GRO J1655-40 obtained with the Green Bank Interferometer at 2.25 GHz frequency (The Green Bank Interferometer is a facility of the National Science Foundation operated by the NRAO in support of NASA High Energy Astrophysics programs). These data, which are integrated for several days per point, are shown at the lower panel of Fig.2. The data show no significant increase of activity during the entire period of RXTE observations, although it appears that the highest fluxes were detected concurrently with an increase in the power law index. These results support our interpretation, but unfortunately are not sensitive enough to make any strong conclusion. Observations with more sensitive instruments are needed to confirm or disprove this correlation.
For GRS1739-278 the data sample is not so evenly spaced as for GRO J1655-40. The first observation, March 31, 1996, was carried out when the system was in an ultra-high spectral state with a spectrum formed by the two strong components: the accretion disk component and extended power-law seen in energies from 10 keV and up to 100 keV. In May 1996, a series of observations was carried out, where the power-law component was much weaker and the source was detected by only by the PCA experiment. The BMC model was able to satisfactorily describe the data in both these cases. Derived parameters, as was the case for GRO J1655-40, show a correlation between disk temperature and flux, which is evidently related to variations in accretion rate. Other dependencies are less evident, because of the weak significance of the power-law component in most cases examined.
As noted in Section 3, an important diagnostic of the BMC model is the behavior of the high-energy power law; specifically, a break at energies keV is predicted. As part of our comprehensive study of the BMC model and its application to current observational data, we have explored what constraints can or cannot be imposed.
Editor: Place Figure 3 here
In Figure 3 we have plotted the background-subtracted count spectra resulting from the GRO J1655-40 (a) and XTE J1550-564 (b) described in Section 2. We have plotted the count-rates per detector-channel superposed on curve of zero intensity. Only channels above 45, corresponding to approximately 300 keV are shown. The data are consistent we believe with any significant lack of flux above 500 keV in each case. We note that others, (Grove et al. 1998; Tomsick et al. 1998) have found that the power-law fit that they obtain for GRO J1655-40 extends to energies as high as keV, and that in fact this pure power-law fit may lead to an improved chi-square relative to a a model invoking a high-energy cut-off. Indeed, our own fits to the data led to similar power-law indices and a positive residual in the model between 500 and 600 keV, but in no case is the statistical significance greater than 2 standard deviations.
We consider the issue to be unresolved, and cite the simple lack of net-detector counts above 500 keV as the primary basis for our claim. Future instrumentation, such as the Integral Spectrometer (SPI) may be able to unambiguously address this issue.
5 Estimation of Physical Parameters of Black Hole Systems
In this section we demonstrate the principal abilities of the BMC model to estimate the values of physical parameters of the system. We also show what kind of uncertainties are present in these determinations and some ways they might be overcome.
Using derived parameters, the color temperature and an absolute normalization, one can infer the effective area into a soft-emission region if the distance to the source and the hardening factor, (ratio of the color temperature to the effective temperature) are known. This involves translating the observable surface area to the black hole mass in terms of a specific disk model. We have selected the SS73-model with a modification to treat electron scattering (e.g. Titarchuk 1994a) as our basic disk model. The spectrum of such a disk can be represented by the integral of a diluted blackbody function characterized by the dilution coefficient over the entire disk. The flux density , measured in units of erg sec-1 ster-1cm-2, is given by:
| (2) |
Here the blackbody disk color temperature distribution is a function of the radius , expressed in the units of Schwarschild radius :
| (3) |
It is normalized to the maximum value at . The normalization factor of the equation (2) measured in units phot sec-1 ster-1 cm2 is:
| (4) |
where is the cosine of the inclination angle (the angle between the line of sight and the normal to the disk), the black hole mass is , and the distance to the source d is in kpc units.
It is possible to replace the multicolor disk spectrum by the diluted blackbody spectrum with the color temperature using the theorem of the mean value (e.g. Korn & Korn 1961), i.e.
| (5) |
where
| (6) |
It is worth noting that in principle is a function of the photon energy . But if the energy band covered is such that ratio of photon energy to the blackbody temperature is greater than 2, the effective radius is almost constant. In this case, the blackbody spectral shape with color temperature provides a reasonable approximation to the multicolor disk spectrum (see Fig. 4).
Editor: Place Figure 4 here
In fact, the shape of the multicolor disk spectrum is also characterized by only one parameter, the maximal temperature (if the inner edge of the accretion disk is fixed at 3 Schwarzshild radii):
| (7) |
¿From the fitting of data with the BMC model one can obtain a color temperature and an absolute normalization . Then, for a given , equations (2) and (5) give and .
Editor: Place Figure 5 here
Editor: Place Figure 6 here
In Figures 5 and 6 the dependencies of , and are presented as functions of . These relations are calculated by using the least squares method, comparing the deviation between the multicolor disk and single temperature blackbody spectra (equations 2 and 5 respectively). It is worth noting that higher color temperatures require higher effective radii, i.e. at higher temperatures an effective area of the disk is more outwardly extended. The ratio is in the range 1.15 and 1.3 when the color temperature changes from 0.7 keV to 1.1 keV. Once the best-fit and are determined one can use these values for the BH mass and the distance determinations(see Eq. 6).
On the other hand the mass accretion rate is related to the BH mass, and through the relation:
| (8) |
This allows one to find the mass accretion rate and ultimately luminosity of the disk (soft) component.
5.1 Constraints on the mass, mass accretion rate and the distance of BH sources
5.1.1 Hardening factor determination for GRO J1655-40
To check the self-consistency of this procedure we first make the appropriate estimates for GRO J1655-40, since we know its distance kpc (Hjellming & Rupen 1995), mass and inclination angle (Orosz & Bailyn 1997) to a relatively high-degree of precision.
Equations (2)-(5) (see also Fig. 5) give us an effective radius of the emission region in the disk which is related to the color temperature . The best-fit parameters, and , along with the known mass, distance and inclination angle allow us to determine the hardening factor from equation 6.
We then obtain a mass accretion rate from equation (8) using the values for , and . Then the luminosity of the soft component is determined as
| (9) |
We have applied our inferred spectral parameters, using Eq.(6) and a least-squares procedure, to obtain the mean value, standard deviation and probability density distribution for . It is easy to show using the least-squares method that
| (10) |
where the sum is implemented over all the best-fit color temperature values . For each set of best-fit parameters (see Eq.6). Averaging this quantity over the probability distribution one can find the mean value and standard deviation of .
For the sample of 20 spectra of GRO J1655-40 we obtain . From this result we can conclude that the hardening factor for this sample is almost constant and independent of color temperature. This value of the hardening factor is consistent with theoretical calculations by Shimura & Takahara (1995), provided the -parameter is 0.1, i.e if the Reynolds number is 10. In fact, Titarchuk, Lapidus & Muslimov (1998) found that these values of the -parameter are typical for the binary systems found to exhibit kHz QPOs.
5.1.2 Distance and BH mass determination
Unfortunately, for sources we lack the precise measurements of the binary system that we are afforded with GRO J1655-40. However, we can derive the distance-mass relationship for any BH system, using parameters inferred from the BMC model, and assuming that the hardening factor obtained above for GRO J1655-40 represents a canonical value. We argue that the general use of that value is justified, because it was obtained over relatively wide dynamical range of color temperatures.
For a given set of inferred parameters , (and hence ), the distance-mass ratio is determined from equation (6) as:
| (11) |
Using the same averaging technique, we applied earlier to determine of the mean value and standard deviation of the hardening factor, we can find the mean value and standard deviation of the distance-mass ratio. With the assumptions that and , we find that , , for 4U 1630-47, GRS 1739-278, and XTE J1755-324 respectively.
The spectral indices and the results of Monte Carlo simulations for the spectral index-mass accretion rate relationship (see LT98, table 2) afford us the possibility to elaborate the constraints on the mass and distance separately. With the assumption that the electron temperature of the converging inflow is low ( 10 keV) we get an inequality for the mass accretion rate in the converging inflow which is a sum of the disk mass accretion rate and mass accretion rate of the halo (advection dominated) component. Namely, and , if the spectral indices satisfy and respectively. Equation (8) then allows us to place constraints on the black hole mass with certain assumptions regarding the hardening factor and the innermost disk radius . For the former, we can use the value 2.6 obtained for GRO J1655-40 (see above) and for the latter one we can use the radius of the last stable orbit in the disk (r=3). Then the constraints on the distance can be obtained using equation (10) with the absolute normalization and the effective radius .
For mass-distance estimations we rewrite equations (8) and (10) as:
| (12) |
and
| (13) |
The luminosity of the soft component (see Eq. 9) expressed in units of erg/s is determined by
| (14) |
Here , and are functions of , and and represent the estimations or constraints we get for mass, distance and soft component luminosity taking into account all the discussion above.
In table 4 we present the set of parameters, obtained from our spectral fitting, that we used for our parameter estimations and the constraints inferred from equations (12)-(14) for each source in our sample other than GRO J1655-40.
Fit parameters for GRS 1915+105 are taken from ShT98 and we derive that the distance-to-mass ratio is 0.67 with an assumption Using millimeter observations of the relativistic ejections in GRS 1915+105 Mirabel & Rodrigues 1994 (see also Chaty et al. 1996) came to the conclusion that this source is at the distance kpc from the Sun, behind the core of a molecular cloud at kpc. Applied this distance estimate we find that the BH mass in GRS 1915+105 system is solar masses. We will verify these mass-distance constraints in our future more extended data analysis of RXTE observations of GRS 1915+105.
XTE J1755-32 represents a special case, because its spectral index is quite low. This means that the converging inflow, with a total mass accretion rate presumably higher than 2, is not cooled effectively by the disk photons and that may be comparable to, or even exceed the disk mass accretion rate . To estimate in this case we have used the distance arguments presented by Trudolyubov et al 1998.
They have demonstrated that bright X-ray transients tend to group around Galactic Center, where mass density is maximal. In the case of XTE J1755-32 its position on the sky allows us to assume, that this is one of sources, which are not too far away from the Center of Galaxy, and the distance is somewhere between 6 and 12 kpc with high probability. Thus with an assumption kpc one can get from the above estimates of the distance-mass ratio that a black hole mass and then using Eq. (12) one can get .
6 On the origin of the seed soft photons component
As we have shown, the spectral energy distribution of Compton scattered photons from the converging flow is very close to what is observed. But it is still necessary to understand the origin of the soft component. If these soft photons come from the accretion disk, then what is the specific nature of the disk? There are a lot of disk models presented in the literature. Currently, among the most widely discussed are those invoking an advection-dominated accretion disk (see e.g. Narayan & Yi 1994, Esin, McClintock, & Narayan 1997, Narayn, Barret, & McClintock 1997). Other recent models are based on the presence of two flows simultaneously proceeding towards the central objects in the non-Keplerian and Keplerian manners (e.g. Chakrabarti 1990, 1996, Molteni, Sponholz, & Chakrabarti 1996, CT95).
In the previous sections, our analysis of the BH parameter constraints were based on the standard SS73 disk model modified to incorporate electron scattering effects. A question of major importance is whether or not we can derive any argument favoring one particular disk over another model from available data.
Here we attempt to demonstrate how one can establish what is the appropriate disk model from the apparent color temperature of the soft photons and the observable flux. Fortunately, GRO J1655-40 provides a relatively large dynamical range of the color temperatures and fluxes.
Editor: Place Figure 7 here
In Figure 7 we present the observational relation between these two quantities. We remind the reader that the temperature of the black body with a fixed surface area depends on the energy flux as the fourth root. It is evident from the figure that the data deviate significantly from this dependence (dashed line). As a comparison, we calculated the dependence of the color temperature on the energy flux for the disk model detailed in the previous sections. For a given color temperature we have found an effective radius of the emission disk region , and then derived an energy flux in the PCA band, integrating the blackbody spectral distribution (see Eq. 5).
The results of these calculations are represented by the solid line and two dotted lines, which represent the error corridor (about 20%) expected from a variety of possible uncertainties. The theoretical dependence of the color temperature on flux was obtained assuming the constancy of the hardening factor in the given range of the color temperatures. Almost all of the points for GRO J1655-40 follow the theoretical curve through one decade in energy flux. This evident agreement of the theory with the observations give us a solid basis for use of the model which in turn allows us to constrain the BH system parameters. The fact that the dependence of the flux on the hardening factor, is very strong (it is proportional to ), yet the theoretical curve for a constant describes the observational points quite well, gives us confidence to fix the value of the hardening factor in treating other sources within our sample.
In Figure 7 we present our flux and temperature determinations for GRS 1739-278 source (hollow circles). Flux values were scaled to approximate GRO J1655-40 values. GRS 1739-278 data are also consistent with multicolor disk model and inconsistent with single-temperature blackbody model (dashed-line). Unfortunately, for the other sources we do not have comparable statistics as in the case of GRO J1655-40. For those cases, arguments characterizing the disk must be considered in terms of the similarity of their observational appearances (e.g. color temperatures, luminosities etc). Further investigations are required to determine the dependencies of color temperature on flux for the more general case.
7 Soft photons illumination of the converging inflow region
Our disk model predicts that the emission surface area is related to the color temperature of the soft spectral component (Fig. 5); the emission region expands outward with increasing color temperature. Thus one can expect a decrease in the illumination parameter, , with increasing color temperature, provided the converging inflow (CI) remains situated inside 3 Schwarzschild radii. I n this case the CI illumination is becoming less effective as the outer edge of the disk, characterized by , propagates to larger radii. If the converging inflow atmosphere overlaps the disk, as is the case, when a non-Keplerian flow is present above the disk, the CI illumination parameter is not correlated with color temperature and relatively high illumination is expected. In this section we will analyze the effect of the illumination of the BMC region and derive certain constraints on the structure of the accretion depending on the absolute value of parameter and its dependence on the color temperature.
To analyze the illumination effect we assume that the disk emits isotropically and extends from the inner radius to the outer radius , while the outer radius of the CI atmosphere is . Furthermore, we assume that . In fact, the disk flux intercepted by the CI atmosphere with radius is calculated through the integral
| (15) |
where . In the case where the disk illuminates the slab (with the half-width and the half-height ) situated in the center . Two internal integrals of Eq. (15) are calculated analytically. The first one is equal to 2 and the second one is , where . The triple integral of Eq. (15) can also be estimated analytically with accuracy better than 10% for the spherical case with the aforementioned assumption that :
| (16) |
In the case, when the part of the disk is overlapped by the cloud, is calculated by integration from to followed by adding , the disk flux emitted inside the atmosphere. The fraction of the disk photons illuminating the CI atmosphere is
| (17) |
where is a probability of scattering of the disk photons in the CI atmosphere of optical depth , and . The optical depth of the CI region is 1: . Here for the optical depth estimate we use formula (2) from TMK97 with an assumption that and (TZ98). But a smaller number of photons emerges after multiple scatterings to form the hard tail of the spectrum (see Fig. 1). We remind the reader (see ST80, Titarchuk 1994b, and TMK97 for details ) that photons undergoing multiple scatterings produce a specific space distribution (in accordance to the first space eigenfunction, see TZ98, Fig. 3) and that fraction of photons undergoing multiple scattering in the plasma cloud, is related to the expansion coefficient of the space source distribution over the first space eigenfunction. In the simplest case, the uniform source distribution is approximately 0.8.
The parameter , used for the spectral fitting, can be estimated as:
| (18) |
where is an illumination factor, is the cosine of inclination angle of the disk and is a spherical albedo of the CI atmosphere. The quantity can be estimated as follows (e.g. Sobolev 1975):
| (19) |
This formula is obtained in the Eddington approximation with an assumption of isotropic scattering at any event and the pure absorptive inner boundary. Despite the Eddington approximation the albedo formula (19) provides an accuracy 10% for any optical depth. For optical depth 1, , which is slightly higher than value obtained by LT98 in the Monte Carlo simulations, , because of photon bending effects.
Now we present the numerical estimates of parameter for different cases: The first one relates to the Monte Carlo simulations (LT98) when , , and we assume that . This gives which is very close to what we get from the application of our model to Monte Carlo simulated spectra. It is worth noting here that in the limit of the high optical depth (or mass accretion rate) because , , and converge to one. Thus, in this particular case, the parameter can approach or even exceed unity.
Editor: Place Figure 8 here
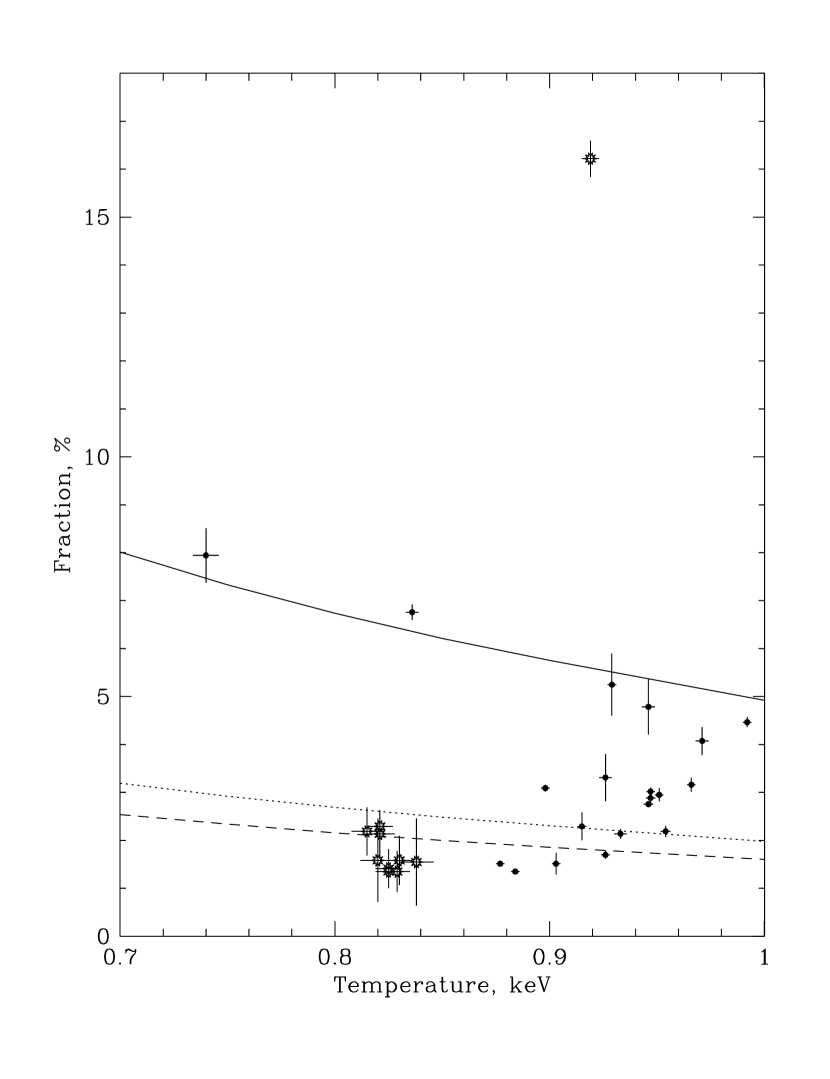
In Figure 8 we present the observational and theoretical determinations of the illumination parameter, versus the color temperature, for two sources, GRO J1655-40 (solid circles) and GRS 1739-278 (hollow circles). The theoretical determinations the CI illumination have been made applying cylinder geometries, with the half-height (solid line), and spherical geometries with (dotted line). In both cases we assume that the inclination angle cosine . The dashed line describes the -dependence on the color temperature, when the analytical approximation of the illumination factor (Eqs. 15-16) is used.
In the case of GRO J1655-40 all observational points on Fig.8 lie in the region of space associated with a CI region situated within a few Schwarzschild radii (). But in the source GRS 1739-278 the converging inflow either shrink to smaller radius (parameter is about 2%), or it overlaps the underlying disk (parameter is ). It is worth noting that for GRS 1915+105 the parameter is and we can speculate that the CI region covers a significant part of the disk. In fact, the Comptonizing region must overlap the inner region of the disk, in order to get such a high fraction of the seed photons from the disk. But on the other hand, high values of parameter () can be obtained, if the innermost region of the disk is puffed up to heights of and the disk is seen nearly edge on.
8 Discussions and Conclusions
Our analysis of broad-band X-ray spectral data for several soft X-ray transients, representing a large fraction of the publicly available RXTE archive for this type of sources, demonstrate that the bulk-motion theory, even in its simplified analytical form, satisfactorily approximates all of the data.
We would like to point out that in many cases, consideration of the BMC upscattering effects leads to lower effective disk color temperatures in comparison with commonly used models involving the sum of a black-body (or multi-color disk) plus power-law component. Interpretation of our results does not require consideration of black hole rotation, which has been invoked earlier to explain reported high temperatures (2-4 keV) observed in accretion disks (Zhang et al. 1997a, Zhang, Cui & Chen 1997b).
The bulk motion theory allows one to explain, in a self-consistent manner, the origin of two-component spectra in high state on the basis of simple geometrical assumptions and basic physical principals. Study of parameter variations show the overall correlation between the temperature of disk component and X-ray flux and demonstrates the decrease of effective disk radius when the system starts its transmission to low spectral state.
The variation of the power law index could be induced either by variations in mass accretion rate reflected by temperature changes (see the difference between spectra of GRS1739-278 obtained in March and in May, 1996), or by a difference in mass accretion rate for the non-Keplerian (advection) flow only (with the disk accretion remaining stable). The latter interpretation, if confirmed would be a tool to study inflow/outflow processes in the disk. Radio data of good quality could support this interpretation, if radio micro-bursts are found to be in coincidence with the increase in the hard power law index. This is apparently the case for GRS 1915+105 source (Mirabel et al. 1998).
For any reasonable hydrodynamical model the final stage of the accretion, i.e. when any disk structure no longer exists, occurs in a nearly free fall manner. The radiation pressure forces cannot stop matter from falling in, because they are significantly below of the Eddington limit. In the soft spectral state of the black hole systems the whole system is cooled down to temperatures of 10 keV or less. In this case the thermal motion is not able to generate the hard photons, which are seen in the observations of the soft state. But for any model of accretion flow – advection dominated, as considered by (e.g.) Narayan & Yi (1994) or Chakrabarti & Titarchuk (1995), or optically thick disk, analyzed by Shakura & Sunyaev (1973) – the accreting matter enters into free fall upon its final black hole. It is worth noting here that effects associated with the innermost boundary were not treated in deriving the self-similar advection dominated solution (Narayan & Yi 1994). It was not within the scope of their work, the goal of which was to demonstrate the existence of the hot solution for the optically thin case, which may be associated with the quiescent of the X-ray novae. If one applies the same technique of the self-similarity for the optically thick case, i.e. when the mass accretion rate is of order of Eddington, one derives the cold solution (e.g.. Wang & Zhou 1999). We assert that in the context of this solution, the only possible mechanism for generating the hard photons is the bulk-motion effect in the region within a few gravitational radii (Titarchuk & Zannias 1998, Laurent & Titarchuk 1998). In fact, Esin, McClintock & Narayan (1997) note that the bulk motion effect could be very important for the hard spectrum formation in the soft-high state of the BH systems.
We wish to emphasize that the BMC theory does not preclude other mechanisms contributing to spectral formation within the inner accretion flow. It is possible that BMC model, alone can not reproduce the power law spectrum beyond keV, which may have been seen from GRO J1655-40 with OSSE (Grove et al. 1998; Tomsick et al 1998). As we have noted however, we have examined these data independently and it is our view claims of a detection, as opposed to an extension of a fit to the data, is not irrefutable.
Quite distinct from the high-soft state, the low-hard spectral state does not appear to uniquely associated with black hole binaries. Neutron star binaries, when observed in low-luminosity states, in fact exhibit spectra which are strikingly similar to the black- hole low-hard state (Barret & Vedrenne 1994; Barret & Grindlay 1995; Barret et al. 1999). The best demonstrations of this come from observations of X-ray bursters during periods of low-intensity. The high-energy spectra are very well represented by thermal Comptonization models as is the case for the low-hard state black holes. Non-bursting, high- luminosity low-mass X-ray binaries containing weakly magnetized neutron stars, on the other hand they show no indication of sustaining high-energy emission. This seems to be a clear indication that the high-soft state, and in particular the high-energy power-law associated with that state, is directly tied to the physics of the black hole environment. This, further, strongly suggestive that the phenomena which underlie it are associated with the innermost probable regions of the black hole system.
It is important to point out that bulk-motion spectral component can be presented in the high state spectra of black hole systems, because its existence is dependent on the presence of a black-hole horizon - this is a natural “drain” allowing removal of extra energy from the system. In this sense the bulk-motion flow is an advection-dominated flow, because the most of energy is advected onto the black hole and only a small percentage contributes to an increase in the number of emergent X-ray photons.
One of the principal predictions of the theory – that two-component spectra are typical for BH binaries – is an attribute of black hole physics only, and is not applicable to neutron star binaries. This prediction seems to be in agreement with observational data thus far obtained.
Some additional assumptions are necessary to extract the basic physical parameters of the system from its X-ray spectra. GRO J1655-40, a well-measured system, can be used as a template to develop a formalism allowing one to make estimations of black hole mass and a distance for other sources based on their spectral properties only. For example, using our derived distance-to-mass ratio and the distance determination presented by Mirabel & Rodrigues (1994) kpc for GRS 1915+105 we find that the BH mass in this source is solar masses.
We have shown that at least for GRO J1655-40 and GRS 1739-278, that an extraction of the best-fit parameters in terms of BMC model allows us to come to reach certain conclusions regarding the structure of the accretion disk. Our results are in favor to the standard disk model (SS73) modified to the electron scattering as an origin of soft component of BH soft state spectra.
ACKNOWLEDGMENTS
This work made use of services provided by the High-Energy Astrophysics Science Archive Research Center (HEASARC) and the Compton Gamma Ray Observatory Science Support Center at the NASA Goddard Space Flight Center. L.T. acknowledges NASA for support under grant NAG5-7317 and thanks Jean Swank for encouragement in all aspects of this work. The work of IKI co-authors have been supported partly by RFBR grant 96-15-96343. Authors are very grateful to the referee for the his/her interesting comments on the manuscript.
References
- Barret et al (1999) Barret, D. Harrus, I.M., Grindlay, J.E., & Olive, J.F. 1999, A&A, in press
- Barret & Grindlay (1995) Barret, D. & Grindlay, J.E. 1995, ApJ, 440, 841
- Barret & Vedrenne (1994) Barret, D. & Grindlay, J.E. 1994, ApJS, 92, 505
- Borozdin et al. (1998) Borozdin, K.N., Revnivtsev, M.G., Trudolyubbov, S.P. et.al, 1998, Astronomy Letters, v.24, N4, p.435
- Chakrabarti (1996) Chakrabarti S.K. 1996, ApJ, 464, 664
- Chakrabarti (1990) Chakrabarti S.K. 1990, Theory of Transonic Astrophysical Flow (Singapore: World Scientific)
- Chakrabarti & Titarchuk (1995) Chakrabarti S.K. & Titarchuk, L. G. 1995, ApJ, 455, 623 (CT95)
- Chaty et al. (1996) Chaty, S., Mirabel, I.F. , Duc, P.A., Wink, J.E., & Rodriguez, I.F. 1996, A&A, 310, 825
- Chen et al. (1997) Chen, W., Shrader, C.R., & Livio, M., 1997, ApJ, 491, 312
- Ellison et al. (1996) Ellison, D.C., Baring, M.G. & Jones, F.C. 1996, ApJ, 473, 1029
- Esin, McClintock & Narayan, (1997) Esin, A.A., McClintock, J.E., & Narayan, R., 1997, ApJ, 489, 865
- Gilfanov et al., (1998) Gilfanov, M., Revnivtsev, M, Sunyaev, R.A., & Churazov, E. 1998, A&AL 1998, 338L, 83
- Grebenev et al., (1991) Grebenev, S.A., Sunyaev, R.A., Pavlinsky, M.N. and Dekhanov, I.A. 1991, Sov.Astron.Lett., 17, 985.
- Grebenev et al., (1992) Grebenev, S.A., Sunyaev, R.A., Pavlinsky, M.N. et al. 1992, Sov.Astron.Lett., 18, 11.
- Grove et al. (1998) Grove, J.E., Johnson, W.N., Kroeger, R.A., McNaron-Brown, K., & Skibo, J.G. 1998, ApJ, 500, 899
- Hjellming,& Rupen (1995) Hjellming, R.M., & Rupen, M.P., 1995, it Nature, 375, 464.
- Laurent & Titarchuk (1998) Laurent, Ph., & Titarchuk, L.G., 1998 ApJ, 511, (LT98)
- Liang (1998) Liang, E.P. 1998, Phys. Rep. 302, 66
- McClintock (1998) McClintock, J.E., 1998, Harward-Smithsonian Center for Astrophysics, Preprint Ser., 4643
- Mirabel et al. (1998) Mirabel, I.F., Dhawan, V., Chaty, S., Rodrigues, L.F., Marti, J., Robinson, S.R., Swank, J., & Geballe., T.R. 1998, A&A, 330, L9
- Mirabel & Rodrigues (1994) Mirabel, I.F., & Rodrigues, L.F 1994, Nature, 371, 46
- Mitsuda et al. (1989) Mitsuda, K., Inoue, H., Nakamura, N., Tanaka, Y., 1989, PASJ, 41, 97
- Molteni et al. (1996) Molteni, D., Sponholz, H., Chakrabarti S.K. & 1996, ApJ, 457, 805
- Morgan, Remillard & Greiner (1997) Morgan, E.H., Remillard, R.A., & Greiner, J., 1997, ApJ, 482, 993
- Narayan, Barret & McClintock, (1997) Narayan, R., Barret, D., & McClintock, J.E., 1997, ApJ, 478, 448
- Narayan, Garcia & McClintock, (1997) Narayan, R., Garcia, M.R., & McClintock, J.E., 1997, ApJ, 478, L79
- Narayan & Yi (1994) Narayan, R., & Yi, I. 1994, ApJ, 428, L13
- Negueruela et al. (1998) Negueruela, I., Reig, P., Coe, M.J., & Fabregat, J. 1998, A&A, 336, 251
- Orosz & Bailyn (1997) Orosz, J., & Bailyn, C.D. 1997, ApJ, 477, 876
- Parmar et al. (1993) Parmar, A. N., Angelini, L., Roche, P.& White, N. E. 1993, A&A, 279, 179
- Revnivtsev et.al (1998) Revnivtsev, M., Gilfanov, M., Churazov, E., 1998, Astron.Astrophys., in press, see also astro-ph/9804173
- Sobczak et.al (1998) Sobczak, G.J., McClintock, J.E., Remillard, R.A., et al. 1998, astro-ph/9809195
- Shakura & Sunyaev (1973) Shakura, N.I., & Sunyaev, R.A., 1973, A&A, 24, 337 (SS73)
- Shapiro et al. (1976) Shapiro, S., Lightman, A.P., & Eardley, D.M. 1976, ApJ, 204, 187
- Shimura & Takahara (1995) Shimura, T., & Takahara, F. 1995, ApJ, 445, 780 (ShT95)
- Shrader & Titarchuk (1998) Shrader, C., & Titarchuk, L.G. 1998, ApJ, 499, L31 (ShT98)
- Smith (1998) Smith, D.A., 1998, IAU Circ. No. 7008
- Sobolev (1975) Sobolev, V.V. 1975, Light Scattering in Atmospheres (Oxford: Pergamon Press)
- Sunyaev & Truemper (1979) Sunyaev, R.A., Truemper, J., 1979, Nature, 279, 506
- Sunyaev & Titarchuk (1980) Sunyaev, R.A., & Titarchuk, L.G. 1980, A&A, 86, 121 (ST80)
- Sunyaev et al. (1994) Sunyaev, R.A., Borozdin, K.N., Aleksandrovich, N.L., et al. 1994, Astron.Lett., 1994, 20, 890
- Tanaka (1997) Tanaka, Y, 1997, Lecture Notes in Physics, 487, 1
- Tananbaum et al., (1972) Tananbaum, H., Gursky, H., Kellogg, E., et al. 1972, ApJ, 177, L5
- Titarchuk, Lapidus & Muslimov (1998) Titarchuk, L.G., Lapidus, I.I. & Muslimov, A., 1998, ApJ, 499, 315
- Titarchuk & Zannias (1998) Titarchuk, L., & Zannias. T., 1998, ApJ, 493, 863 (TZ98)
- Titarchuk, Mastichiadis & Kylafis, (1997) Titarchuk, L. G., Mastichiadis, A., Kylafis, N. D. 1997, ApJ, 487, 834 (TMK97)
- Titarchuk & Lyubarskij (1995) Titarchuk, L.G., & Lyubarskij, Yu., 1995, ApJ, 450, 876
- Titarchuk (1994a) Titarchuk, L.G. 1994, ApJ, 429, 340
- Titarchuk (1994b) Titarchuk, L.G. 1994, ApJ, 434, 570
- Tomsick et al. (1999) Tomsick, J.A., Kaaret, Ph. Kroeger, R.A. & Remillard, Ron. A. 1999, ApJ in press (astro-ph/9809098
- Trudolyubov et.al (1998) Trudolyubov, S., Gilfanov, M., Churazov, E., 1998, Astron.Astrophys., submitted
- Zhang et al. (1997a) Zhang, S.N., et al, 1997, ApJ, 479, 381
- Zhang et al. (1997b) Zhang, S.N., Cui, W., & Chen, W. 1997b, ApJ, 482, L155
- Zhang et al. (1995) Zhang, W., Jahoda, K., Swank, J.H., Morgan, E.H. & Giles, A.B. 1995, ApJ, 449, 930


| Date obs. | Time start, UT | Time end, UT | PCAa/HEXTEb live time, s | |
|---|---|---|---|---|
| XTE J1755-324 | ||||
| 1 | 29/07/97 | 05:17:20 | 06:54:24 | 768 |
| 2 | 01/08/97 | 05:19:12 | 06:58:24 | 1993 |
| GRS 1739-278 | ||||
| 1 | 31/03/96 | 18:08:48 | 20:50:56 | 5215/2066 |
| 2 | 10/05/96 | 07:08:00 | 07:56:00 | 1365 |
| 3 | 11/05/96 | 18:58:56 | 20:05:52 | 2421 |
| 4 | 12/05/96 | 03:23:28 | 03:45:52 | 1117 |
| 5 | 13/05/96 | 17:05:20 | 17:50:56 | 2110 |
| 6 | 14/05/96 | 13:43:28 | 14:48:00 | 2886 |
| 7 | 15/05/96 | 17:04:32 | 18:25:52 | 325 |
| 8 | 16/05/96 | 23:48:32 | 24:34:56 | 1691 |
| 9 | 17/05/96 | 12:24:32 | 13:26:56 | 3398 |
| 10 | 29/05/96 | 02:47:28 | 03:57:52 | 2529 |
| EXO 1846-031 | ||||
| 1 | 04/04/85 | 00:06:56 | 02:32:32 | 6959c |
| Date | , keV | /dof | ||||
|---|---|---|---|---|---|---|
| GRS 1739-278 | ||||||
| 31/03/96 | 22.8/36 | |||||
| 10/05/96 | 26.5/36 | |||||
| 11/05/96 | 34.1/36 | |||||
| 12/05/96 | 27.5/36 | |||||
| 13/05/96 | 28.3/36 | |||||
| 14/05/96 | 30.3/36 | |||||
| 15/05/96 | 19.6/36 | |||||
| 17/05/96 | 25.6/36 | |||||
| 17/05/96 | 28.3/36 | |||||
| 29/05/96 | 30.5/36 | |||||
| XTE J1755–324 | ||||||
| 29/07/97 | 29.8/36 | |||||
| 1/08/97 | 32.5/36 | |||||
| EXO 1846–031 | ||||||
| 04/04/85 | 237/204 | |||||
| Date | , keV | |||||
|---|---|---|---|---|---|---|
| GRO J1655-40 | ||||||
| 05/01/97 | 29.9 | |||||
| 12/01/97 | 37.9 | |||||
| 20/01/97 | 31.6 | |||||
| 26/02/97 | 37.5 | |||||
| 10/03/97 | 31.4 | |||||
| 20/03/97 | 34.5 | |||||
| 24/03/97 | 31.4 | |||||
| 10/04/97 | 24.4 | |||||
| 24/04/97 | 28.0 | |||||
| 30/04/97 | 23.1 | |||||
| 12/05/97 | 20.1 | |||||
| 20/05/97 | 15.6 | |||||
| 28/05/97 | 30.6 | |||||
| 05/06/97 | 17.6 | |||||
| 09/06/97 | 17.2 | |||||
| 19/06/97 | 17.2 | |||||
| 26/06/97 | 28.1 | |||||
| 04/07/97 | 38.6 | |||||
| 08/07/97 | 23.6 | |||||
| 14/07/97 | 37.2 | |||||
| Source | Spectral fit parameters | Physical parameter estimations | ||||||||
|---|---|---|---|---|---|---|---|---|---|---|
| GRS 1915+105a | 3.0 | 0.9 | 0.72 | 1.7 | 1.1 | 11.5 | ||||
| GRS 1739-278 | 1.33 | 0.94 | 0.14 | 1.4 | 1.16 | 11.8 | ||||
| XTE J1755-324 | 1.18 | 0.71 | 0.02 | 1.0 | 0.82 | 9.6 | ||||
| 4U 1630-47 | 2.27 | 0.85 | 0.025 | 1.38 | 1.02 | 10.9 | ||||
| EXO 1846-031 | 3.5 | 0.75 | 0.27 | 1.88 | 0.88 | 9.9 | ||||