Kinematics of the helium accretor GP Com
Abstract
We present and analyse time-resolved -band spectra of the double-degenerate binary star, GP Com. The spectra confirm the presence and period () of the ‘S’-wave feature found by Nather, Robinson and Stover. GP Com is erratically variable at X-ray and UV wavelengths. We have found the equivalent variability in our data, which, as also seen in UV data, is mostly confined to the emission lines. The HeII 4686 changes by the largest amount, consistent with X-ray driven photo-ionisation. The flaring part of the line profiles is broader than the average, as expected if they are dominated by the inner disc. The HeII 4686 profile is especially remarkable in that its blue-shifted peak is from line centre compared to for the HeI lines (the red-shifted peak is blended with HeI 4713). We deduce that HeII 4686 emission is confined to the inner 1/4 of the disc. We suggest that the activity of the inner disc indicates that accretion is significant (and unstable) there, in contrast to quiescent dwarf novae, in support of models in which GP Com is in a (quasi-)steady-state of low mass transfer rate.
GP Com shows triple-peaked lines profiles which consist of the usual double-peaked profiles from a disc plus a narrow component at line centre. The latter has previously been ascribed to emission from a nebula, although none could be found in direct images. However, we find evidence for both radial velocity and flux variability in this component, inconsistent with a nebula origin. The radial velocity amplitude of and its phase relative to the ‘S’-wave are consistent with an origin on the accreting white dwarf, if the mass ratio, , is of order , as expected on evolutionary grounds. However this explanation is still not satisfactory as the systemic velocity of the narrow component shows significant variation from line to line, and we have no explanation for this.
keywords:
accretion, accretion discs – novae, cataclysmic variables – stars: individual: GP Com1 Introduction
GP Com (G61–29) is a high proper motion star [Giclas, Burnham & Thomas 1961] with an optical spectrum dominated by broad HeI emission lines [Burbidge & Strittmatter 1971]. Warner [Warner 1972] and Smak [Smak 1975] found rapid photometric variability, similar to the flickering observed in cataclysmic variable stars and suggested that, like them, it is a binary star, although they found no convincing periodicity.
Nather, Robinson & Stover (1981, hereafter NRS) found a narrow emission-line component which varied in radial velocity on a period of , providing strong support for the binary nature of GP Com. The variable component moved between the two outer peaks of the triple-peaked emission lines, similar to phenomena observed in hydrogen-dominated cataclysmic variable stars (e.g. U Gem). Thus, by analogy, NRS identified the moving component with the region where the gas stream hits the accretion disc. The short period and absence of hydrogen qualifies GP Com as one of the AM CVn group of accreting double-degenerate systems; it is in fact the longest period of these systems and stands out from the crowd as the only one with a spectrum strongly in emission and as the only one to show an ‘S’-wave.
The most prominent element other than helium is nitrogen in the form of NV in IUE [Lambert & Slovak 1981] and HST [Marsh et al. 1995] spectra and NI in spectra covering the R- and I-bands [Marsh, Horne & Rosen 1991]. The absence of hydrogen and the strong helium and nitrogen emission are consistent with our seeing material from the core of the star that has undergone hydrogen burning and CNO-cycle processing of most of the carbon and oxygen into nitrogen. This is as expected given the very short period of GP Com.
The emission lines from GP Com show the characteristic double-peaked, broad profiles of emission from an accretion disc. However, unlike hydrogen-dominated cataclysmic variables with such profiles, GP Com also sports a narrow component at the centre of each emission line which we will refer to as the “central spike”. The origin of this component is unclear. NRS could find no radial velocity variability of the central spike and suggested that it might come from a nebula surrounding GP Com, by analogy with old novae. However a subsequent search failed to find any nebula [Stover 1983]. On the other hand the mass donor star in GP Com is probably of such a low mass that the spike could originate on the mass accretor and still show little radial velocity variability. We look at this component again in this paper.
Another remarkable feature of GP Com was seen in HST spectra [Marsh et al. 1995] in which flaring was seen in the emission lines, representing a factor of 5 change in flux from minimum to maximum. This is probably driven by X-ray variability [van Teeseling & Verbunt 1994] which might also influence the optical lines. We look for this in the time-resolved data we present here.
We begin with a description of the observations and an analysis of orbital variability in our data.
2 The Observations and their Reduction
We used the m Isaac Newton Telescope on the island of La Palma to take 414 spectra on three nights from the 21st to the 23rd April 1988. The spectra were taken with the Intermediate Dispersion Spectrograph (IDS) with an Image Photon Counting System (IPCS) detector, and cover the range to Å in 2040 pixels with a full width half maximum (FWHM) resolution of 2 pixels. Apart from the first six exposures of 120 seconds each, all exposures were 100 seconds long, taken through a by 50 arcsecond slit aligned to a position angle of to capture simultaneous spectra of the variable GP Com and a nearby comparison star. Arc spectra were taken every half hour or so to track flexure in the spectrograph. Spectra of the comparison star and the flux standards BD and Feige 34 were taken to provide flux calibration.
The sky background was estimated by interpolation from uncontaminated sky regions on each side of the object spectra. After subtraction of the background, the spectra were extracted by summation perpendicular to the dispersion. Flat field corrections were applied at the same time.
We fitted 13th order polynomials to the average arc spectrum for each night. The two lowest order terms were then refitted for the individual arc spectra. The root mean square (RMS) of the fits was typically Å , equivalent to or th of a pixel at our dispersion. The wavelength scales for GP Com were then interpolated between neighbouring arc spectra. This procedure eliminates the effects of flexure which amounted to Å during the night.
Finally the flux standard spectra were used to correct for the instrumental sensitivity and the comparison star spectra were used to correct for slit losses.

3 Results
3.1 The Average Spectrum
The average of our spectra has already been discussed in Marsh et al. [Marsh, Horne & Rosen 1991]. For convenient reference, we show it once more in Fig. 1. The spectrum confirms the earlier investigations of Burbidge & Strittmatter [Burbidge & Strittmatter 1971] and NRS. The only strong lines detected are those of HeI and HeII, and these are broad and triple-peaked, a structure seen most clearly in the HeI 5015 line.
Smak [Smak 1975] and NRS suggest that the lines are made up of a broad, double-peaked profile from an accretion disc plus a separate narrow component near the centre of the line. The variation in the relative strength of the central “spike” from line to line supports this hypothesis. Double-peaked profiles are well known from the hydrogen-dominated cataclysmic variables [Honeycutt, Kaitchuck & Schlegel 1987], but the central spike is unique to GP Com.
3.2 The Orbital Period
The first reliable detection of a periodicity in GP Com was made by NRS who discovered a narrow emission-line component (in addition to the central spike) which varied in velocity with a period of . The velocity of the component varied from to taking it between the two outer peaks of the lines. Such ‘S’-waves are well-known from other CVs, and are associated with the region where the gas stream from the secondary star hits the disc. If this is the case in GP Com, then is also the orbital period of the binary.
The ‘S’-wave is also present in our data. In the upper panel of Fig. 2
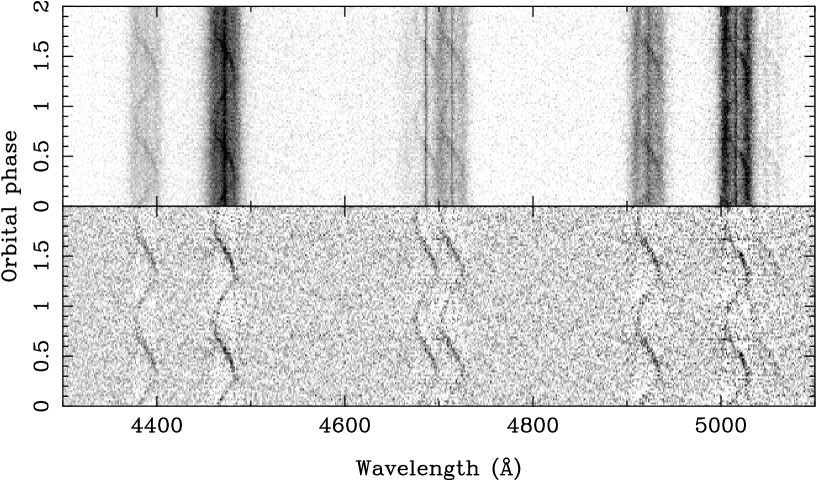
we show the phase binned trailed spectrum of GP Com, and in the lower panel we show the result of subtracting the average spectrum from this. Fifty phase bins were equally spaced around the cycle and they are repeated twice for clarity. The ‘S’-wave is clear in all the lines, while there is little other variability. Fig. 2 also shows the lack of radial velocity variation in the central spike. Thus it is the ‘S’-wave that gives the best way of measuring the orbital period in GP Com.
In order to measure the period quantitatively we undertook a multi-gaussian fit which was made to all the spectra and all lines at once, representing the ‘S’-wave as a single gaussian with the same sinusoidal radial velocity curve for all the lines. The period was one of the free parameters of the fit, and is determined by the need to keep the ‘S’-wave in step over the three nights of our run. We obtained a period of days or . This differs from NRS’s value by , but given uncertainties caused by the round-off implicit in NRS’s value, we doubt this is significant.
There is no clear indicator of the conjunction phase for GP Com, and thus we chose an arbitrary zero point close to the middle of our observations to compute phases. Thus we use the following ephemeris for all phases in this paper:
This is the ephemeris used in constructing Fig. 2. We will discuss a possible constraint on the conjunction phase in section 4.1.
3.2.1 Superhumps?
The sub-class of cataclysmic variables called the SU UMa stars are known for quasi-periodic flaring behaviour during outburst which occurs on a period somewhat longer than the orbital period. These flares, usually known as “superhumps”, are thought to be the result of a distortion of the outer disc induced by the 3:1 resonance [Whitehurst 1988] between the disc and binary orbit. The distortion only occurs if the 3:1 resonance radius is inside the disc and this requires the mass ratio () to be less than about . This neatly explains why the SU UMa stars are all at the short period end of the cataclysmic variable period distribution because then the secondary star is of relatively low mass. The restriction on mass ratio is easily satisfied by the even shorter period GP Com, and so it is of interest to see whether it shows any superhump-like behaviour. Since our spectra are slit-corrected we can attempt this.
We computed light curves over two regions avoiding the emission lines. The first of these covered 4250 to 4350 and 4510 to 4640 Å while the second covered 4750 to 4880 and 5080 to 5190 Å.

Periodograms [Scargle 1982] of these light curves are shown in Fig. 3. These do indeed show some evidence for a signal on a slightly longer period than the spectroscopic one; the difference visible in the right-hand panels of Fig. 3 corresponds to a difference of about cycles over the 2 day baseline of our observations, which is easily measurable. Thus our data are at least consistent with the possibility of superhump-like behaviour in GP Com. However, given that the signal in the continuum near the spectroscopic period is only one of several peaks of similar power, the evidence can only be regarded as suggestive. It should be noted that superhumps in SU UMa stars are only seen during some outbursts, and so it would not be surprising if GP Com failed to show them.
3.3 Doppler Images
The emission lines in GP Com show the broad, Doppler-shifted profiles produced by accretion discs. Doppler tomography provides a powerful method of interpreting such profiles. We imagine that the profiles are built from the sum of many ‘S’-waves which have radial velocity
at orbital phase . The strength of each ‘S’-wave is plotted with coordinates , to build up an image. The coordinates are chosen for consistency with a coordinate system in which the axis points from the primary to the secondary star and the axis points in the direction of the secondary star’s motion. A detailed description of the computation of the images is given in Marsh & Horne [Marsh & Horne 1988].
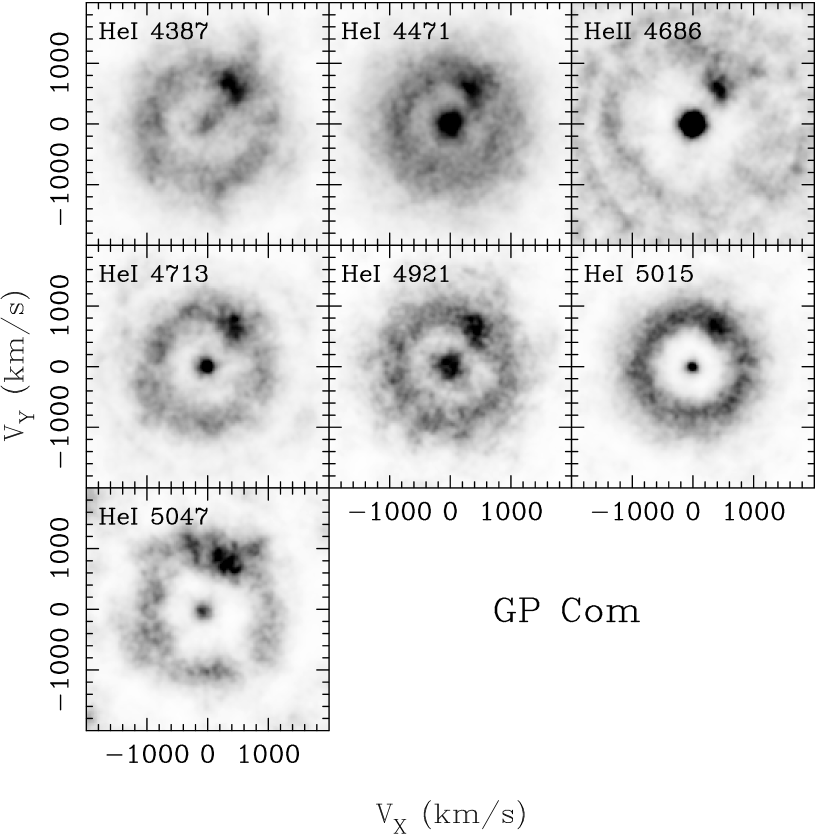
Images of the seven lines are presented in Fig. 4. These images were computed in three sets, the first covering HeI 4387 and 4471, the second HeII 4686 and HeI 4713 and the third HeI 4921, 5015 and 5047. In this way blending between lines could be accounted for. The fits to the lines were very good with reduced of order .
All lines show a similar structure with a central spot, matching the central spikes of Figs. 1 and 2, an offset spot equivalent to the ‘S’-wave and a smooth ring-shaped background for the rest of the disc. We have scaled the lines so that the ring from the disc is seen at about the same level in each case which brings out the marked variation in the relative strengths of the central spike and bright-spot components.
The outer ring visible in HeII 4686 is a consequence of its blending with HeI 4713 (which has a similar but less obvious artefact). It is the inner ring that corresponds to the edge of the HeII 4686 emission region and it can be seen to be markedly larger than its equivalents in the HeI lines. This indicates that the HeII 4686 emission does not cover all of the disc, a point we will return to in section 3.6 when we discuss flaring behaviour in GP Com.
3.4 The ‘S’-wave
The spot equivalent to the ‘S’-wave appears to have some structure in several of the images of Fig. 4, most obviously in HeI 4387. On examining the data more closely (Fig. 2), it turns out that the ‘S’-wave is significantly non-sinusoidal, a phenomenon also seen in the strong ‘S’-wave of WZ Sge (this is best seen by looking at Fig. 2 sideways). In order to assess the departure from a sinusoid, we returned to the multi-gaussian fits, forcing the velocity of the S-wave to be the same in all lines. We first fitted the ‘S’-wave velocity as before when determining the period but now, rather than just a simple sinusoid, we fitted a Fourier series of the form:
With this as a starting point, we then measured velocities individually from 50 phase-folded spectra (the signal-to-noise being too low to attempt this on the raw data). The results and Fourier fit are plotted in Fig. 5.

The parameters of the Fourier fit are listed in Table 1.
| Coefficient | 1 | 2 | 3 | |||
|---|---|---|---|---|---|---|
| Cosine amplitude | ||||||
| Sine amplitude | ||||||
Both figure and table exhibit the substantial departure from a pure sinusoid. Non-sinusoidal velocity changes of this manner violate one of the basic assumptions of Doppler tomography, but are easily produced by phase-dependent visibility in the emission regions. For example, at one phase we may see emission from the stream, whereas at another emission from the disc near the stream may be easier to see. In general these will have different velocities and thus we see a non-sinusoidal behaviour. Such visibility variations imply that vertical structure in the disc or stream plays a significant role in GP Com, suggesting that it is of high orbital inclination. The Doppler maps cannot reflect this complexity and instead we see an averaged view of the system with emission spread over all contributing sites. This explanation is nicely supported by the phase-dependent flux variation in the ‘S’-waves of Fig. 2. Similar behaviour can be seen in the ‘S’-wave of the hydrogen-dominated system, WZ Sge [Spruit & Rutten 1998].
To illustrate the difference between the stream and disc velocities we have plotted the ‘S’-waves predicted for stream only (dash-dotted line) and disc only (dotted) in Fig. 5. The predicted velocities are based upon a mass ratio of and a disc of radius . Ideally, the observed velocities should be bracketed by these two paths. This is near enough the case for the above explanation to be credible. The phasing and scaling used in producing the prediction is discussed in the next section.
| Line | ||||
|---|---|---|---|---|
| HeI 4387 | ||||
| HeI 4471 | ||||
| HeII 4686 | ||||
| HeI 4713 | ||||
| HeI 4921 | ||||
| HeI 5015 | ||||
| HeI 5047 | ||||
Measurements of the amplitudes for the individual lines are listed in Table 2. In this case a simple sinusoid has been fitted to each line. We will consider these further in the next section.
3.5 The Central Spike
The absence of obvious radial velocity variation in the central spike led to suggestions that it arose in a nebula, which however has not been found [Stover 1983]. However, although the absence of variations rules out the mass donor, the disc and the bright-spot, as we pointed out earlier, the accreting white dwarf remains a possibility because the extreme mass ratio expected of GP Com (see section 4.2) means that its semi-amplitude is only of order . Therefore a measurement of the radial velocity amplitude of the central spike provides an important constraint upon its origin.
Actually measuring the amplitude is difficult. In principle it can be measured by determining the position of the central spot in the Doppler images. However, this is adversely affected by the systemic velocity shifts visible in the mean spectra (which tend to blurr the central spot) and it is also difficult to estimate uncertainties with this method. On the other hand one can’t simply measure velocities directly without accounting for the presence of the ‘S’-wave. Therefore we again applied the multi-gaussian fitting method. With the spike and ‘S’-wave modelled as gaussians, and with velocities fitted by the usual function, the fitted parameters are listed in Table 3.
| Line | ||||||
|---|---|---|---|---|---|---|
| HeI 4387 | ||||||
| HeI 4471 | ||||||
| HeII 4686 | ||||||
| HeI 4713 | ||||||
| HeI 4921 | ||||||
| HeI 5015 | ||||||
| HeI 5047 | ||||||
| All | – | |||||
The last entry denoted by “All” was derived from a simultaneous fit to all lines in which they were forced to have the same and . Individually the signal-to-noise in the lines is too marginal to be confident of a detection, but the simultaneous fit to all of them, which gives , , is statistically significant. However, it should be remembered that this measurement was made against a background of disc and ‘S’-wave and that the semi-amplitude is only of order 1/10th of the FWHM of the spike. Nevertheless the detection supports the accretor origin for the central spike.

After making a small correction for noise-induced bias, our measurement is equivalent to an amplitude of . This can be compared to NRS’s measurement of based upon the emission line wings. The values are consistent, although unfortunately NRS do not specify the phasing of their measurement. We have not tried to measure the amplitude from the line wings as they are so broad that the measurement of such small amplitudes cannot be relied upon, as NRS warn.
If the spike truly does reflect the motion of the accretor, and the ‘S’-wave originates from the gas stream/disc impact region, then their relative phases and amplitudes depend upon the mass ratio. The connection is illustrated in Fig. 6 which shows that the S-wave parameters listed in Table 2 (plotted as the cluster of points in upper-right quadrant of each panel) are consistent with the measured position of the spike (which lies on the straight, dashed lines) for a mass ratio if the ‘S’-wave represents the velocity of the gas stream or if it represents the velocity of the disc along the path of the stream. In the former case the disc would extend to 75% of the way to the inner Lagrangian point, whereas in the latter it would only need reach % of the way. Both mass ratios and disc radii are reasonable for GP Com, and provide further circumstantial evidence that the spike may indeed be from the accretor. If this interpretation is correct, then inferior conjunction of the secondary star (the expected phase of eclipse of the disc, if there was one), occurs at orbital phase on our ephemeris. The same method was used to produce the predicted stream and disc ‘S’-waves plotted in Fig. 5.
3.6 Stochastic variability
So far we have mainly considered variations with orbital phase. However, strong flaring behaviour has been observed in HST data which does not appear to be related to orbital phase [Marsh et al. 1995]. In the HST data the flux of NV 1240 was seen to increase by a factor of up to five during three flares which occurred in the 13 hour observing interval, while the continuum only increased by %. It is likely that this variation is driven by X-ray variability through photo-ionisation, and indeed, variations have been seen in ROSAT data on GP Com [van Teeseling & Verbunt 1994]. If so, we can expect similar effects at optical wavelengths.

That this is so is demonstrated in Fig. 7 which shows the light curves of the continuum and emission lines of GP Com during our run. There is significant, correlated variability in all components, and it has a larger amplitude in the lines than the continuum.
We can derive a spectrum for the flaring component using the method employed by Marsh et al. [Marsh et al. 1995]. In this the spectra are modelled as the sum of a spectrum representing the mean plus multiples of another spectrum representing the flaring component. Both spectra and the multipliers (which are different for each of the 414 spectra) are optimised by minimising .

The constant and flare components derived from our data are shown in the top two panels of Fig. 8. It has to be remembered that our spectra were taken through a narrow slit, and although they were corrected for slit losses, it is likely that some part of the “flaring” could be artificially induced. This would have the effect of making the flare spectrum look like the mean spectrum. Therefore as a further check we repeated the computation of the flare spectrum after subtracting the continuua of the spectra. This allows the variations in the lines to determine the flare spectrum rather than the lines and continuum and should weaken the influence of poor slit corrections, although not eliminate them entirely. The result of this is shown in the lower panel of Fig. 8 and probably gives the most accurate representation of the line profiles.

Expanded views of four of the line profiles are shown in Fig. 9.
Looking first at the upper two panels confirms the behaviour seen in the light curves of Fig. 7. The emission lines are relatively stronger than the continuum in the flare compared to the mean. This is exactly as found in the HST data [Marsh et al. 1995], although not to such a marked extent (the possible contamination due to poor slit loss correction should be remembered however). The line ratios in the two spectra are very similar with the exception of HeII 4686 which is stronger in the flare component; with hindsight the HeII 4686/HeI 4713 light curve can be seen to be the most modulated in Fig 7. This supports photo-ionisation as the driver of the flares. Finally there are substantial differences in the line profiles (Fig. 9). The profiles in the flare spectrum have broader wings than they do in the mean spectrum, indicative of a larger contribution from the inner disc and they also have a weaker central spike component compared to the mean. However, it is important to note that the flare spectrum does appear to have some central spike component, although the caveat about slit loss contamination is worth repeating.
The weakening of the central spike leads to profiles with more pronounced double-peaks. Most remarkable of all is the HeII 4686 profile which in the flare spectrum has a blue-shifted peak at around (the blending with HeI 4713 rendering it impossible to be sure of the red-shifted peak). If interpreted as a standard profile from an accretion disc, this suggests that the HeII 4686 emission region only extends out to about 1/4 of the radius of the disc (assuming that the HeI lines come from all of it). This peak is consistent with the radius of the inner ring of the HeII 4686 map of Fig. 4.
4 Discussion
4.1 Origin of the Central Spike
The persistent narrow emission at the centre of all the lines is a puzzling feature of GP Com. The nearest equivalent we know of is the zero velocity emission observed in IP Peg and SS Cyg [Steeghs et al. 1996], but this was only seen during outburst. The parameters in Table 3 provide several constraints upon its origin. The amplitude of any radial velocity variations is low. The spike is seen best in HeI 4713, HeI 5015 and HeII 4686 and these lines indicate a narrow FWHM of . We take these lines as representative since the ambiguity about whether flux is from the spike or from the disc is likely to cause much larger systematic errors for the other lines.
Taken together, the small width and the radial velocity amplitude allow only a few possible sites of origin which are (a) the accreting white dwarf, (b) a nebula or (c) a wind or jet. Any other part of the binary moves too fast (e.g. the donor star) or would produce too broad a profile (e.g. the disc). All the above sites have their own problems however.
A wind origin faces difficulties since the winds observed in normal cataclysmic variables are too highly ionised to produce HeI emission and have large velocities characteristic of the escape velocity of the white dwarf [Drew 1987]. It is hard to see how expansion velocities of order arise in such circumstances. Moreover a wind origin has no good explanation for the variations in the systemic velocities, most obvious in HeI 5015.
The main point in favour of the accreting star is our detection of radial velocity variation, albeit of low amplitude. As we showed in section 3.5 the measured amplitude and phase of the spike are in accord with the ‘S’-wave amplitude and phase. However, once more the systemic velocities are hard to understand, although the primary star has the possibilities of gravitational, pressure [Koester 1987] and Zeeman shifts. It is encouraging that the most discrepant line, HeI 5015, is the only singlet line in our wavelength range, but there does not seem to be enough known about these lines for us to say anything more.
A nebula origin copes best with the systemic velocities. HeI 5015 is the line most sensitive to optical depth effects. Under case A conditions the HeI 5015/4922 ratio should be of order whereas under case B it increases to about [Brocklehurst 1972]. Thus a correlation between the velocity of the emitting material and its density could be the reason behind the HeI 5015 anomaly. The nebula, if it exists, would have to be asymmetric, which is no great obstacle. There are however other problems with a nebula origin. First, it is not resolved. A nebula expanding at would reach a size of 1 arcsecond in only 10 years if GP Com lies at the upper limit of deduced by Marsh et al. [Marsh, Horne & Rosen 1991]. We find no evidence for any extended emission in our long slit spectra and estimate that an extension of order 1 arcsecond should have been detected; Stover [Stover 1983] found that what appeared to be extended emission around GP Com is in fact a group of stars. Perhaps the most significant problems are the radial velocity and flux variability that we have detected. The nebula explanation can only survive these if they are dismissed as systematic artefacts. Given the small amplitude of the radial velocity variations, it is hard to rule out this possibility. However, while we cannot be sure that poor slit loss correction has not artificially produced the spike component in the flare spectra, our feeling is that it is too strong for this to be the case. Luckily, it should be possible to improve upon this with better data in the future.
4.2 Parameters of GP Com
The evolution that leads to a system such as GP Com has been discussed in several papers [Savonije, de Kool & van den Heuvel 1982]. At any particular orbital period there are two possibile configurations. In one case the donor may be a helium star of relatively high mass and luminosity. In this case the orbital period decreases with time. Alternatively, at a later stage after the system has passed its minimum period (of order ), the donor adopts a semi-degenerate structure of very low mass and luminosity. In this state as the donor loses mass it increases in radius and the orbital period increases as well. It is unable to reach a truly degenerate structure because its thermal timescale becomes so long. The latter case is almost certainly the one that applies to GP Com since there is no sign of the donor star. Our favoured mass ratio of also supports this scenario. Based upon Savonije et al.’s work, Warner [Warner 1995] deduces that
where the orbital period is measured in hours. This gives a mass of order for the donor star. Given an accretor mass of order , this is acceptably close to the mass ratio we deduce, and confirms the status of GP Com. Using the relation given by Warner for a fully-degenerate secondary (his equation 9.43) leads to , still consistent with our mass ratio if the accretor is more like .
For , and , we calculate , a reasonable value. Uncertainties in and are too large to deduce any useful value of the inclination however, and we just note again that the non-sinusoidal ‘S’-wave behaviour suggests that it might be high, although there is no sign of an eclipse.
4.3 Flaring in GP Com
The flaring we have found at optical wavelengths, and seen more dramatically still at UV wavelengths, is another unusual feature of GP Com. It strongly suggests that the inner disc is variable in a way not seen in the systems that look most like GP Com in terms of their optical spectra, the quiescent dwarf novae (leaving aside the absence of hydrogen!). GP Com has never been seen to show outbursts, and there has been discussion as to whether this is because it has a very long inter-outburst interval or because it is in a steady-state of very low mass transfer rate [Warner 1995]. The former possibility is quite reasonable given the decades-long intervals between the outbursts of the short-period dwarf novae known as the WZ Sge stars. On the other hand, it has long been realised that, if the thermal instability model of dwarf nova outbursts is correct, a disc composed largely of helium may behave very differently from one dominated by hydrogen [Smak 1983, Tsugawa & Osaki 1997]. The turning points on the thermal equilibrium curve plotted as versus (the “S-curve”) are at a higher temperature and surface density for helium compared to hydrogen [Tsugawa & Osaki 1997]. As a result, it is more likely that the entire disc can be on the lower branch of the S-curve, and thus the system will not undergo outbursts.
We suggest that the high-level of X-ray to optical flux in GP Com [Verbunt et al. 1997] and the flaring behaviour support the latter possibility. That is, matter accretes at all radii in the disc rather than accumulating in the outer disc as it is believed to do in quiescent dwarf novae. In this state the disc can be optically thin [Tsugawa & Osaki 1997], which explains the strong emission lines displayed by GP Com, in contrast to the rest of the AM CVn group. Of course, some other instability must be occurring in the inner disc to explain the flaring; its cause remains to be determined.
5 Conclusions
We have analysed time-resolved spectrophotometry of the double-degenerate binary GP Com. We confirm the presence of the ‘S’-wave feature found by NRS and refine its period to . We have detected a small radial velocity variation with a semi-amplitude of in the sharp component at the centre of the emission lines, which may indicate that it comes from the accreting primary star. The amplitude and phase are consistent with such an origin together with the measured parameters of the ‘S’-wave if the mass ratio is of order . This is roughly as expected if GP Com is now increasing in period and has a near-degenerate donor star. However, the systemic velocity of the narrow component, which varies from line to line, remains to be explained.
While the orbital variations that we find are consistent with earlier data, we have also discovered erratic flaring which we believe to be analogous to similar but more obvious behaviour seen at UV wavelengths. We suggest that this supports models in which GP Com’s disc is on the lower branch of the thermal instability curve and does not undergo the global outbursts followed by intervals of mass accumulation as occur in dwarf novae.
Acknowledgements
TRM was supported by a PPARC Advanced Fellowship during the course of part of this work. The data reduction and analysis were carried out on the Southampton node of the UK STARLINK computer network.
References
- [Brocklehurst 1972] Brocklehurst, M., 1972, MNRAS, 157, 179.
- [Burbidge & Strittmatter 1971] Burbidge, E. M., and Strittmatter, P. A., 1971, ApJL, 170, 39.
- [Drew 1987] Drew, J. E., 1987, MNRAS, 224, 595.
- [Giclas, Burnham & Thomas 1961] Giclas, H. L., Burnham, R. Jr., and Thomas, N. G., 1961, Lowell Observatory Bulletin, 112, 61.
- [Honeycutt, Kaitchuck & Schlegel 1987] Honeycutt, R.K., Kaitchuck, R.H., Schlegel, E.M., 1987, ApJSupp, 65, 451.
- [Koester 1987] Koester, D., 1987, ApJ, 322, 852.
- [Lambert & Slovak 1981] Lambert, D. L., Slovak, M. H., 1981, PASP, 93, 477.
- [Marsh & Horne 1988] Marsh, T. R., Horne, K., 1988, MNRAS, 235, 269.
- [Marsh et al. 1995] Marsh, T. R., Wood, J. H., Horne, K., Lambert, D., 1995, MNRAS, 274, 452.
- [Marsh, Horne & Rosen 1991] Marsh, T. R., Horne, K., Rosen, S., 1991, MNRAS, 366, 535. (paper I).
- [Nather, Robinson & Stover 1981] Nather, R. E., Robinson, E. L., Stover, R. J., 1981, ApJ 244, 269.(NRS)
- [Savonije, de Kool & van den Heuvel 1982] Savonije, G.J., de Kool, m., van den Heuvel, E.P.J., 1986, A&A, 155, 51.
- [Scargle 1982] Scargle, J.D., 1982, ApJ, 263, 835.
- [Smak 1975] Smak, J., 1975, Acta Astron, 25, 227.
- [Smak 1983] Smak, J., 1983, Acta Astron, 25, 227.
- [Spruit & Rutten 1998] Spruit, H., Rutten, R., 1998, MNRAS, in press.
- [Steeghs et al. 1996] Steeghs, D. Horne, K., Marsh, T.R., Donati, J.-F., 1996, MNRAS, 281, 626.
- [Stover 1983] Stover, R. J., 1983, PASP, 95, 18.
- [Tsugawa & Osaki 1997] Tsugawa, M., Osaki, Y., 1997, PASJ, 49, 75.
- [van Teeseling & Verbunt 1994] van Teeseling, A., Verbunt, F., 1994, A&A, 292, 519.
- [Verbunt et al. 1997] Verbunt, F., Bunk, W.H., Ritter, H., Pfeffermann, E., 1997, A&A, 327, 602.
- [Warner 1972] Warner, B., 1972, MNRAS, 159, 315.
- [Warner 1995] Warner, B., 1995, Cataclysmic Variable Stars, CUP.
- [Whitehurst 1988] Whitehurst, R., 1988, MNRAS, 232, 35.