Cosmological Implications of Lyman-Break Galaxy Clustering
Abstract
We review our analysis of the clustering properties of “Lyman-break” galaxies (LBGs) at redshift , previously discussed in Wechsler et al. w98 . We examine the likelihood of spikes found by Steidel et al. s98 in the redshift distribution of LBGs, within a suite of models for the evolution of structure in the Universe. Using high-resolution dissipationless N-body simulations, we analyze deep pencil-beam surveys from these models in the same way that they are actually observed, identifying LBGs with the most massive dark matter halos. We find that all the models (with SCDM as a marginal exception) have a substantial probability of producing spikes similar to those observed, because the massive halos are much more clumped than the underlying matter – i.e., they are biased. Therefore, the likelihood of such a spike is not a good discriminator among these models. The LBG correlation functions are less steep than galaxies today (), but show similar or slightly longer correlation lengths. We have extened this analysis and include a preliminary comparison to the new data presented in Adelberger et al. adel . We also discuss work in progress, in which we use semi-analytic models to identify Lyman-break galaxies within dark-matter halos.
Introduction
Recently, Steidel et al. (S98) s98 discovered that the redshift distribution of “Lyman-break” galaxies (LBGs) in a pencil beam reveals a large “spike” in the LBG distribution near . This spike corresponds to a fractional overdensity of LBGs of a few hundred percent over a comoving scale of order . Since then, they have compiled a sample of more than 600 galaxies in six fields, with measured redshifts between about 2.5 and 3.5 adel , s98b .
At a first glance, such a high peak seems surprising, since it suggests substantial nonlinear clustering on rather large scales. In fact, we w98 and other authors bagla , jing , governato find from simulations that these spikes arise naturally in a variety of cosmologies, provided that there is substantial galaxy biasing.
Here we compare the clustering properties of the LBGs to those expected in high-resolution simulations of four different cosmological models, by identifying LBGs with the most massive halos in our simulations at that redshift. We are currently working on improving this analysis, both by comparing to the increasing amounts of new data, and by using semi-analytic models to explore different ways of identifying LBGs with halos in N-body simulations.
How probable are the Spikes?
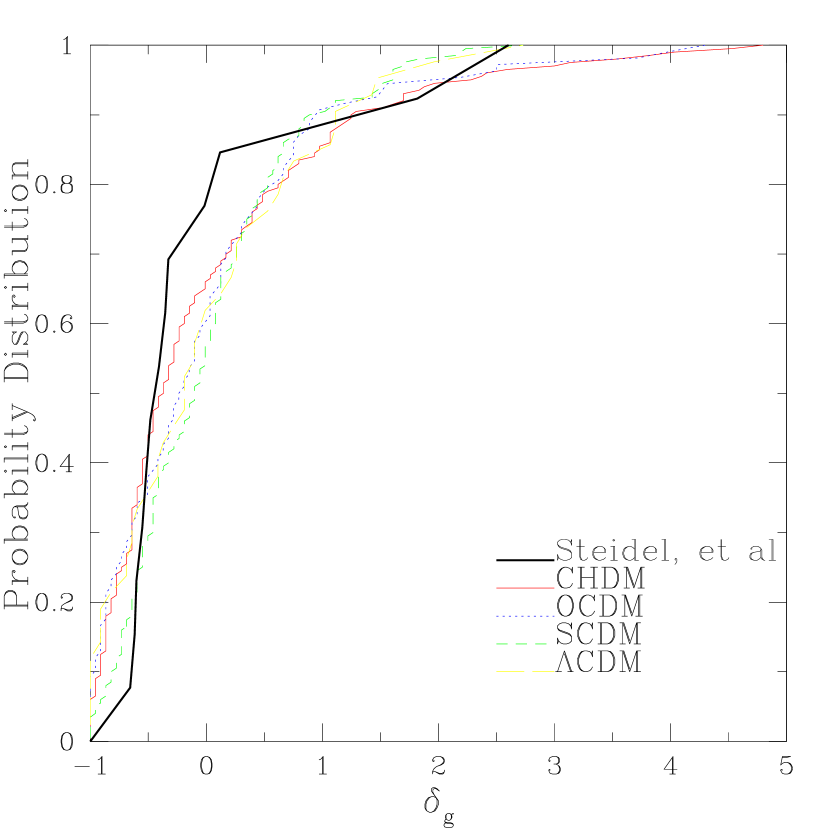
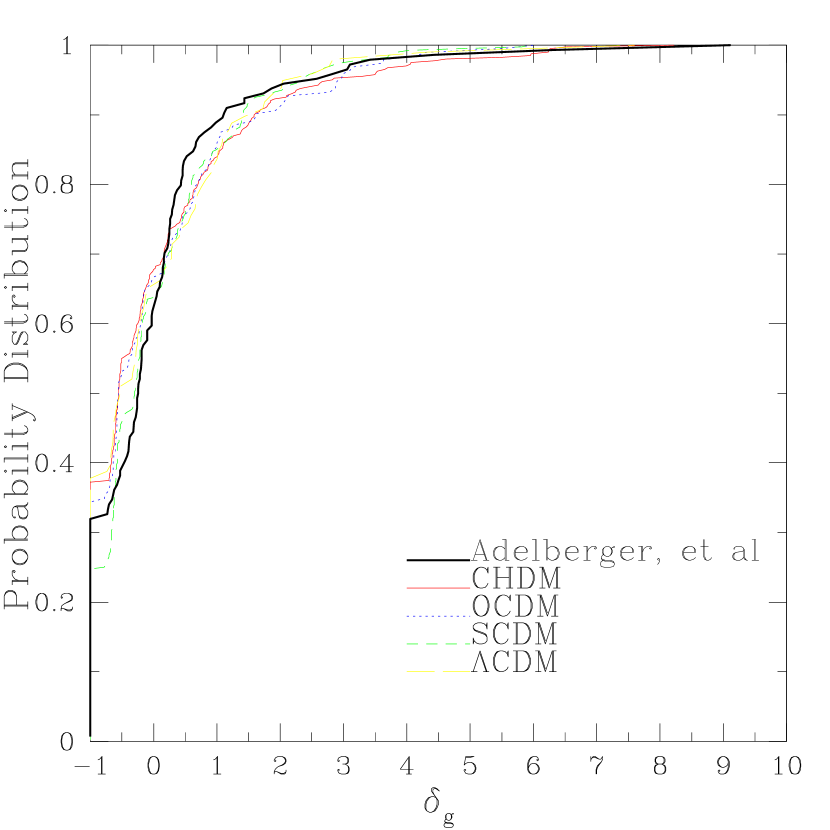
Our methods are described fully in Wechsler et al. (W98) w98 , and will be described only briefly here. The data is taken in x fields; the redshift distribution is binned in bins of . In determining the probability of spikes, our statistics consider each pixel separately, where a pixel is one z=0.4 redshift bin by the size of an angular field: x (in the case of data from S98), or x, (in the case of the newer data from Adelberger et al. (A98) adel ). The number of galaxies in each pixel is divided by its selection function; we then consider the galaxy overdensity per pixel: . These data are then compared to N-body simulations by Gross et al. grossetal of four cosmological models: SCDM (), CHDM (), OCDM (), CDM (), in a 75 box; 57 million CDM particles (+ 113 million HDM particles in CHDM). The halos are identified as virialized regions at . To assign LBGs to halos we assume that one LBG resides in each massive halo, then choose a mass cutoff to match the observed number density of candidates and randomly select 40% of these (because S98 find redshifts for 40% of candidates). The mass cutoff ranges from for CHDM to for SCDM. We then “observe” pixels the size of the observational determined pixels, and compared the statistic to that calculated from the data. The cumulative probability distribution of this galaxy overdensity statistic is plotted in Figure 1, both for the analysis done in W98, which compared only to the data from the one x field published by S98, and compared to the more complete data set from six x fields published by A98. We find that the probability of observing a spike as large as the largest seen by S98 (corresponding to ) is about 37%, 31%, 27%, and 6% for CHDM, OCDM, CDM, and SCDM, respectively. The reason for the small probability for SCDM seems to be due to the shape of the power spectrum w98 , adel . The distribution of the newer data set published in A98 looks relatively well fit by all of the models; a full analysis will be published elsewhere. In future work, we will also take into better account a more accurate selection function for the data.
Bias & Correlation Function
The clustering of LBGs is found to be biased with respect to the
underlying dark matter. The bias factor ,
defined as ,
has an average value of about 2-5 depending on the cosmological model.
High-density regions are the most biased.
We have measured the correlation function for the LBGs in our
simulations. The best fit parameters are: [ Mpc] =
3.3, 5.1, 5.0, 7.3, and = 1.7, 1.6, 1.6, 1.5, for SCDM,
CHDM, OCDM, and CDM, respectively.
A98 have calculated the correlation function using a
counts-in-cells method, and find correlation lengths of
, and Mpc) for = 1, 0.2
open, and 0.3 flat, assuming that = 1.8
(cf. giavalisco ).
Adding Semi-Analytic Models
In previous work, we identified LBGs by making the assumption that one object resides in each massive halo above some mass cutoff. Alternatively, we can use semi-analytic models sp98 , spf98 , psfw to predict the location of objects luminous enough to be observed as LBGs – they may reside in less massive halos, or there may be more than one per halo. We are currently exploring how different models of galaxy formation affect the clustering properties of the Lyman-break galaxies when identified in this way – which may help to distinguish between galaxy formation models and to determine the nature of the Lyman-break galaxies.
Conclusions
Large peaks in the observed redshift distribution of LBGs are common at in several cosmological models. Galaxy formation is biased at high-z in all cosmologies we have considered, with a bias factor of . The clustering properties will probably not distinguish between different cosmologies, without independent information about the bias. We find a similar correlation length but slightly shallower correlation function slope compared with that observed. We find that the bias and clustering properties are more strongly affected by the shape of the power spectrum than by the mass density; a model with a shallow power spectrum, like SCDM, seems to be somewhat less clustered than the data.
A preliminary analysis of the data published by A98 shows that the original spike s98 is one of the highest in all surveyed fields, and the new data is in fairly good agreement with all four cosmological models. Major improvements to our prior analysis can be made both by comparing to the still-increasing amounts of new data, and by improving our method of assigning LBGs to dark-matter halos. By using semi-analytic models to test and improve upon our method of identifying LBGs within halos from N-body simulations, we may be better able to understand the clustering properties and nature of the Lyman-break galaxies, and may begin to distinguish between galaxy formation scenarios.
References
- (1) Wechsler, R. H., Gross, M. A. K., Primack, J. R., Blumenthal, G. R., & Dekel, A. 1998, ApJ, 506, 19 (W98, astro-ph/9712141)
- (2) Steidel, C.. C., Adelberger, K. L., Dickinson, M., Giavalisco, M., Pettini, M., & Kellogg, M. 1998, ApJ, 492, 428 (S98, astro-ph/9708125)
- (3) Adelberger, K. L., Steidel, C. C., Giavalisco, M., Dickinson, M., Pettini, M., Kellogg, M. 1998, ApJ, 505, 543 (A98, astro-ph/9804236)
- (4) Steidel, C.. C., Adelberger, K. L., Giavalisco, M., Dickinson, M., Pettini, M., & Kellogg, M. 1998 (astro-ph/9804237, astro-ph/9805267)
- (5) Bagla, J. S., 1998, MNRAS, 297, 251 (astro-ph/9707159)
- (6) Jing, Y. P., Suto, Y. 1998, ApJL, 494, L5 (astro-ph/9710090)
- (7) Governato, F., Baugh, C. M., Frenk, C. S., Cole, S., Lacey, C. G., Quinn, T., & Stadel, J. 1998, Nature, 392, 359
- (8) Gross, M. A. K., Somerville, R. S., Primack, J. R., Holtzman, J., & Klypin, A. A. 1998a, MNRAS, 301, 81 (astro-ph/971214)
- (9) Giavalisco, M. Steidel, C. C., Adelberger, K. L., Dickinson, M. E., Pettini, M., Kellog, M. 1998, ApJ, 503, 18 (astro-ph/9802318)
- (10) Somerville, R. S., Primack, J. R. 1998, MNRAS in press (astro-ph/9802268)
- (11) Somerville, R. S., Primack, J. R., & Faber, S. M. 1998, MNRAS, in press (astro-ph/9806228)
- (12) Primack, J. R., Somerville, R. S., Faber, S. M., & Wechsler, R. H., 1998 (astro-ph/9806263)