09.04.1 11.09.1 11.09.4 11.19.2 13.09.1 13.09.4 11institutetext: Observatory, P.O. Box 14, FIN-00014 University of Helsinki, Finland (email: mattila@cc.helsinki.fi) 22institutetext: Max-Planck-Institut für Astronomie, Königstuhl 17, D-69117 Heidelberg, Germany
K. Mattila, mattila@cc.helsinki.fi
Detection of widely distributed UIR band emission in the disk of NGC 891 ††thanks: Based on observations made with ISO, an ESA project with instruments funded by ESA member states (especially the PI countries: France, Germany, the Netherlands and the United Kingdom) and with the participation of ISAS and NASA
Abstract
The spectrum of the unidentified infrared (UIR) emission bands between 5.9 and 11.7 m has been observed for the first time in the disk of an external galaxy. We have used the low-resolution spectrometer of the ISOPHOT instrument aboard ISO. The UIR bands at 6.2, 7.7, 8.6, and 11.3 m have absolute intensities which are similar to the values observed for the diffuse emission of our own Galaxy. The UIR bands between 5.9 and 11.7 m contribute 9% of the total IR radiation of NGC 891. The intensity ratios and band widths in the NGC 891 disk emission are similar to the diffuse emission of the Milky Way, pointing to a common carrier for the UIR bands in the two galaxies. However, there are some notable variations of the band ratios along the major axis of the galaxy.
keywords:
Galaxies: individual :NGC 891 – :ISM – :spiral – ISM :dust – infrared: ISM: lines and bands – Infrared: galaxies1 Introduction
The family of the so-called unidentified infrared emission bands (UIR bands), centered at 3.3, 6.2, 7.7, 8.6, and 11.3 m, has been observed for more than 20 years (Gillett et al. 1973) in a number of galactic objects, such as planetary nebulae (PN), HII regions, and reflection nebulae (RN) around early type stars, as well as in the nuclear regions of some external galaxies. These objects are characterized by UV radiation densities several orders of magnitude above the average interstellar radiation field in the galactic disks and as a consequence the UIR band intensities are high.
A surprisingly high level of mid-IR emission from the disk of our Galaxy was first detected by Price (1981) and later confirmed by the 12 and 25 m IRAS observations. Similarly, the global IR emission of other spiral galaxies has been observed to have a strong excess in the IRAS 12 and 25 m bands. This emission constitutes ca. 20 % of the IR radiation energy from the disk of our Galaxy, and 10 – 30 % of the total IR flux of other spiral galaxies (cf. Helou et al. 1991). Puget et al. (1985) have proposed that the 12 m emission of our Galaxy is largely due to the UIR bands. This proposal has been supported by the photometric detection of the 3.3 m and 6.2 m UIR bands in the galactic disk emission using the AROME balloon-borne experiment (Giard et al. 1988; Ristorcelli et al. 1994) and has been confirmed by the ISO and IRTS spectrophotometry (Mattila et al. 1996; Onaka et al. 1996).
Strong UIR band emission at 3.3, 7.7, 8.6, and 11.3 m has been detected in HII region type galactic nuclei showing vigorous star formation activity (Moorwood 1986, Roche et al. 1991). The average ratio of the 8.6 and 11.3 m band intensities has been found to be higher in galaxy nuclei than in the nebular sources in our Galaxy (Aitken & Roche 1984). With the Infrared Space Observatory (ISO) large surveys and several detailed individual studies have been performed of the UIR bands in the nuclear or starburst regions of galaxies (see e.g. Spoon et al. 1998, Moorwood et al. 1996, Boulade et al. 1996).
In the case of disks of external galaxies no spectra have been obtained for the UIR bands so far. However, in analogy to the ISM in our Galaxy, model calculations have been presented which suggest that the UIR bands and/or continuum emission by other transiently heated very small grains do dominate the IRAS 12 m emission in other galactic disks as well ( Walterbos & Schwering 1987, Xu & DeZotti 1989, Helou et al. 1991, Walterbos & Greenwalt 1996).
The present investigation was initiated to answer the following questions: (1) Are the UIR emission bands at 6.2, 7.7, 8.6, and 11.3 m present also in the disks of external galaxies where the UV ISRF is typically 100 – 1000 times lower than in the galactic nuclear regions. (2) Can the IRAS 12 m emission of galaxy disks be explained (solely) as the integrated emission of the UIR bands? (3) What are the relative intensities of the UIR bands in the disks in comparison with the nuclear regions of galaxies and the bright galactic sources, the PNs, RNs, and the HII regions? (4) What is the spatial distribution of the UIR band carriers in the disks of galaxies? By finding the answers we hope to contribute also to the problem of identifying the UIR band carriers.
In this paper we present results of an ISOPHOT low resolution spectrometer (PHT-S) observing project aimed at studying the UIR bands in the galaxy NGC 891. NGC 891 is an Sb spiral closely similar to our own Galaxy, thus motivating a comparison with spectrophotometry of the diffuse galactic UIR emission (Mattila et al. 1996). NGC 891 is seen almost exactly edge-on (inclination ). This is an essential condition in order to have a sufficiently large column density of ISM along the line of sight to enable spectrophotometric analysis with PHT-S. For the distance of NGC 891 we adopt the value 9.5 Mpc (van der Kruit & Searle 1981). It is consistent with the value 8.9 Mpc estimated by Handa et al. (1992) on the basis of the infrared Tully-Fisher relation.
2 Observations and reductions
The observations were carried out during the ISO revolutions 656 ( 1 September 1997) and 788 ( 11 January 1998). A linear raster of 20 positions along the major axis of NGC 891 at position angle was observed with PHT-S (see Lemke et al.1996). The integration time per raster position was 512 sec along the northern and 356 sec along the southern part of the major axis. The raster step size was 24”, i.e. equal to the PHT-S aperture size (24” 24”). The observed positions with their orientation are shown in Fig. 2 superimposed on an optical image of the galaxy. At the distance of NGC 891 the aperture size corresponds to 1.1 kpc. The outermost raster positions were at 216” (9.9 kpc) North and at -240” (11.0 kpc) South of the central position ( = 2h 19m 24.6s, = 42∘ 07’ 21” (1950.0)). Four off-axis positions were observed in addition, displaced by 24” perpendicular to the major axis from the central and the 120” North positions. An off-position observation 5’ West of the galaxy centre was performed in revolution 788 but it turned out to be of lower quality than the rest of the measurements. Thus, the four off-axis positions plus the outermost positions at the ends of the major axis were used for the background subtraction.

The data reduction was performed using the ISOPHOT Interactive Analysis Program
(PIA) Version 7.0 (Gabriel et al. 1998).
The following reduction steps were
applied:
(1) Deglitching of the data (to eliminate cosmic ray effects)
(2) Deletion of first 10 sec of integration (to eliminate detector
drift effects).
(3) Subtraction of dark current. Instead of the short (32 sec) dark current
measurement preceeding each PHT-S spectrum measurement we used the
“default” dark values provided by PIA7.0 in dependence of ISO’s orbital
position. They are based on extensive compilation of dark signal measurements
randomly distributed over the duration of the orbital science window
(see Klaas et al. 1998, Ábrahám et al. 1998).
(4) Calibration to convert instrumental units (V/s) to surface brightness
units (MJy sr-1). The calibration for the PHT-S measurements
is based on observations of the ISO standard stars HR 6705, HR 6688, HR 6817,
and HR 6514. For the calibration of extended sources that fill the aperture
(as in our case) the
measured beam profile for each spectrometer detector
pixel has been integrated over the whole PHT-S aperture
and the resulting correction factors are included in the PIA7.0 calibration
values (see Klaas et al. 1998).
(5) Subtraction of the zodiacal emission for the long-wavelength (=PHT-SL)
spectra (5.9 – 11.7 m). We used the off-axis spectra
and the outermost on-axis positions at the northern and southern end of
the major axis to determine the foreground zodiacal emission.
Because these positions still
contain some UIR band emission from the galaxy we excluded the wavelength
ranges of the bands and fitted a 2nd or 3rd order polynomial through the
continuum points. Some continuum emission from the galaxy
might be present in these background positions making our zodiacal emission
estimate too high. However, if we assume that the band-to-continuum ratio
for the background positions is the same as for the strong on-axis emission
this error in the continuum correction is negligible.
We illustrate the zodiacal background subtraction for revolution 788 in Fig. 1.
Panel (a) shows the average of the southernmost (-240”) on-axis and the two
off-axis spectra at +120” North. The three spectra were in good agreement
with each other. UIR band emission at 6 – 6.5, 7.3 – 8.8, and 11 - 11.5
m appears to be present. These portions, indicated by thick line,
were excluded and a 3rd order polynomial was fitted through the remaining
channels. The derived background spectrum is consistent with
the spectral shape and absolute level of the zodiacal emission at the
target coordinates to
,
(see Ábrahám et al. 1998,
Reach et al. 1996). We point out that no spectral features at the UIR
or other wavelengths are seen in the very deep zodiacal emission spectra
presented by Ábrahám et al. (1998) and Leinert et al. (1998).
The zodiacal emission spectrum has a pure continuum in this wavelength
region. The weak UIR band emission seen in our OFF positions (Fig. 1a)
is thus not connected to the zodiacal foreground emission.
Panel (b) shows the observed spectrum for
central position of NGC 891 together with the fitted background spectrum.
After subtraction of the zodiacal light the final
spectrum of the galaxy’s radiation is obtained and is
shown in panel (c).
(6) Subtraction of the zodiacal light (and any remaining instrumental effects) for the short-wavelength(= PHT-SS) spectra (2.5 – 4.9 m). This was performed using spectra at the same background positions in the outskirts of NGC 891 as in the long-wavelength case. In this case, however, no polynomial fit was done but the averaged background spectrum was used as such.
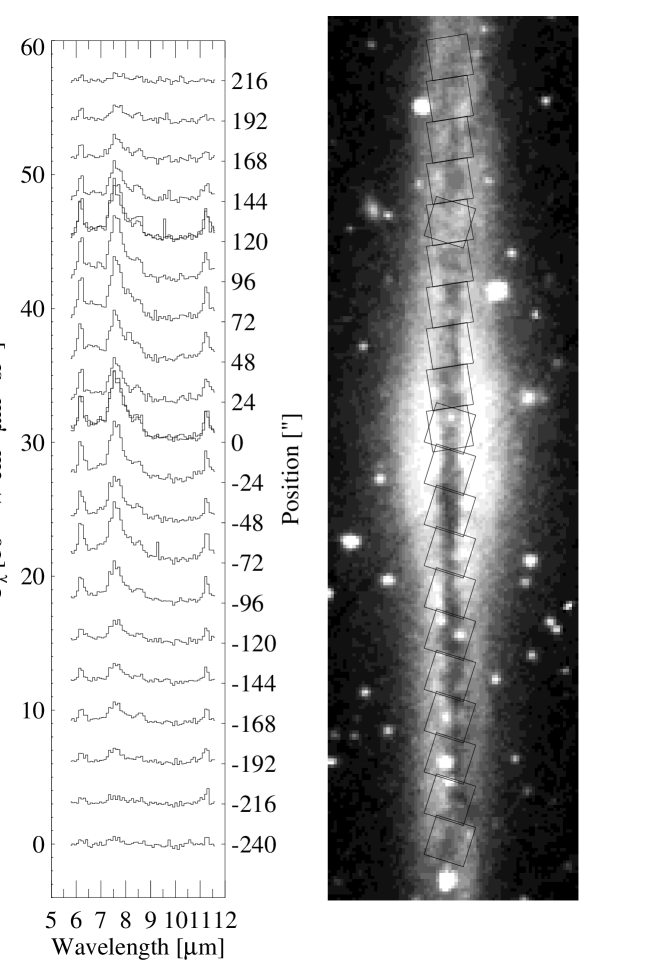
The resulting PHT-SL spectra along the major axis of NGC 891 are shown in Fig. 2a. The surface brightness scale is valid for the bottom-most spectrum at -240” and the consequtive spectra are displaced by 3 units in the vertical direction. In Fig. 2b we show an optical image (blue light) of NGC 891 reproduced from the Digital Sky Survey. The scaling of Fig. 2b is such that 24” correspond to the spacing between the spectra in Fig. 2a. The observed PHT-S 24”x24”aperture positions are shown in Fig. 2b with their correct orientations on sky, i.e. with the sides parallel to the spacecraft Y and Z axes.
The central and the 120” North positions were observed twice, once in each of the revolutions 656 and 788. The two independent measurements agreed within 10 % for the PHT-SL spectra (see Fig. 2a), the rev. 788 intensities being systematically smaller than the rev. 656 ones by this amount. We brought the PHT-SL measurements to a uniform scale by applying a multiplicative correction factor of 1.05 and 0.95, to rev. 656 and 788, respectively. The resulting surface brightness values are expected to have an absolute accuracy of better than 30 % (Klaas et al. 1998a, 1998b). However, since the observations were performed as two interconnected one-dimensional raster maps the relative point-to-point accuracy is better than the absolute one. We estimate it to be 10%. The relative feature intensities within the spectrometer band are estimated to have an uncertainty of 10%.
3 Results
3.1 PHT-SL spectra (5.9 – 11.7 m)
By inspecting the spectra in Fig. 2a (see also Fig. 1c) we can immediately list the following qualitative results:
(1) The main UIR bands at 6.2, 7.7, 8.6, and 11.3 m
are clearly present in the disk of NGC 891 at least to a distance of 192”,
corresponding to 8.8 kpc, both North and South of the centre.
The spectra look very similar to those observed for the diffuse emission
of the disk of our Galaxy as well as for bright galactic objects,
such as reflection nebulae and HII regions.
(2) There is an apparent broad underlying plateau-like emission between 6 and 9 m.
This is in accordance with the findings for e.g. the Orion Bar (Bregman
et al. 1989) as well as for the diffuse emission of our Galaxy
(Mattila et al. 1996). However, with Cauchy profile fits the plateau
emission can be explained by the line wings (see Sect. 3.1).
(3) The maximum emission at 7.7 m occurs at the central and the
96” North positions and is
5.0 10-10 W cmm-1 sterad-1.
This is comparable to the level of the diffuse emission in the inner disk
of our Galaxy, 3.2 10-10 W cmm-1 sterad-1,
observed with the same instrument (see Mattila et al. 1996).
(4) The continuum emission at 9.5 – 10.5 m is detected and its level is
5 to 10 % of the UIR band peaks.
Some further, more quantitative results are:
(5) In order to compare the integrated emission of the UIR bands
with the IRAS 12 m emission we have summed up the PHT-S spectra
between 7.5 and 11.6 m
(the IRAS band pass covers 7.5 m to 15 m).
The results for the total and the UIR band emission are
and W cm-2,
respectively, integrated over all the
observed positions. The total PHT-S flux value can be compared with
IRAS 12 m band flux of NGC 891, 5.66 Jy (Rice et al. 1988) which corresponds
to an in-band flux of 7.64 10-17 W cm-2. Taking into account
an absolute calibration error of 20% for IRAS and 30% for
PHT-S
we conclude that the two integrated flux values are in good agreement and that
at the very least % of
the IRAS 12 m emission is due to the UIR bands.
If the relative intensities of the UIR bands in the 11.5 to 16 m range
are similar to the highly illuminated regions in our Galaxy
it is possible that the whole
IRAS 12m emission of NGC 891 can be explained in terms of the UIR bands
plus the weak underlying continuum seen in our spectra.
(6) Guélin et al. (1993) have estimated the IR flux density of the large
grains in NGC 891. They have fitted the IRAS 60 and 100 m and their
1.3 mm flux densities with a warm ( = 30 K) and a cold
( = 15 K) dust component. They find the corresponding luminosities
of L⊙ and
L⊙ which
correspond to a flux density of
7.2 10-16 W cm-2.
The energy emitted in the UIR bands at 6.2, 7.7, 8.6, and 11.3 m
is 1.10.3 10-16 W cm-2 or 15% relative to the large grains.
This is somewhat higher than the fraction (10 %)
found for the diffuse emission of our Galaxy (Mattila et al. 1996).
Adding the contribution of the IRAS 12 and 25 m bands (see Rice et al.
1988) we find that the total IR flux density of NGC 891 is
11.9 10-16 W cm-2, and the UIR band contribution
is 9% of the total.


(7) We have fitted the spectra with a combination of a linear baseline and four Cauchy line profiles
The fit for the spectrum at 120”N is shown in Fig. 3. The fit parameters, i.e. the line heights, central wavelengths, and linewidths (FWHM) for the individual positions were first determined with no parameter values fixed. Inspection of the resulting central wavelengths and line widths showed that there were no significant differences over the disk or between the disk and the nucleus of NGC 891. Their mean values together with the standard deviations are as follows: 6.19 0.01 m (0.22 0.02 m) 7.60 0.02 m (0.62 0.02 m) 8.48 0.02 m (0.30 0.02 m) 11.24 0.01 m (0.30 0.05 m)
The central velocities are given in the rest frame of NGC 891 ( =
+530 km s-1).
These values agree well with the wavelengths
and widths observed for the diffuse emission of our Galaxy and for
bright galactic nebulae.
In order to improve the accuracy of line intensity
estimates we subsequently
determined the heights of the lines keeping the central wavelength
and line width fixed. The line intensities (areas)
were then determined from
height FWHM.
We give the resulting line intensities together with their (statistical) error
estimates in columns (2) to (5) of Table 1. The line ratios
together with their statistical error estimates are given in columns (6) to (9).
The external statistical errors (standard deviations) derived
from the values of
the northern and southern inner disk are , and
for the four ratios displayed.
These are smaller or equal to the statistical errors given in Table 1.
The average values of the band ratios
, , and
are very closely the same for the northern and southern inner disk
( to ) (see Table 2).
We have preferred the Cauchy line profiles to the Gauss ones. With Cauchy profiles no additional “plateau emission” component between 6.5 – 9 m is needed; this feature is completely explained by the broad Cauchy line wings. Also, a better overall fit of the observed spectrum is obtained in this wavelength region. Boulanger et al. (1998) have presented a comparison of Lorentz vs. Gauss profile fits to ISOCAM CVF spectra. They also find much better fits with the Lorentz profiles, equivalent to the Cauchy profiles but in frequency instead of wavelength space. See also their discussion of physical arguments justifying the use of Lorentz profiles. One should note that a direct comparison of the Cauchy/Lorentz feature intensities with the Gauss ones is not possible: the Cauchy/Lorentz band intesities, especially for the 7.7 m feature, are larger since they include the broad wing emission.
3.2 PHT-SS spectra (2.5 – 4.9 m)
The following results can be listed for the short-wavelength spectra:
(1) The 3.3 m UIR band is not detected, neither at the central
position nor in the disk. An upper limit of
W cmm-1 sr-1 can be set to the
height of the line.
(2) A stellar continuum is present at m.
| Position | I(6.2) | I(7.7) | I(8.6) | I(11.3) | ||||||||||||
|---|---|---|---|---|---|---|---|---|---|---|---|---|---|---|---|---|
| (1) | (2) | (3) | (4) | (5) | (6) | (7) | (8) | (9) | ||||||||
| -240 | 0.14 | 2 | 0.51 | 3 | 0.10 | 2 | 0.28 | 4 | 0.27 | 4 | 0.20 | 4 | 0.54 | 8 | 0.37 | 9 |
| -216 | 0.16 | 7 | 0.54 | 13 | 0.12 | 7 | 0.39 | 16 | 0.28 | 14 | 0.22 | 14 | 0.71 | 34 | 0.31 | 22 |
| -192 | 0.28 | 8 | 1.02 | 16 | 0.17 | 8 | 0.48 | 16 | 0.27 | 9 | 0.17 | 8 | 0.47 | 17 | 0.36 | 20 |
| -168 | 0.34 | 9 | 1.44 | 18 | 0.28 | 9 | 0.51 | 16 | 0.24 | 7 | 0.19 | 7 | 0.35 | 12 | 0.55 | 25 |
| -144 | 0.36 | 9 | 1.34 | 18 | 0.18 | 8 | 0.39 | 16 | 0.27 | 8 | 0.14 | 6 | 0.29 | 12 | 0.47 | 28 |
| -120 | 0.33 | 9 | 1.52 | 19 | 0.24 | 9 | 0.43 | 16 | 0.22 | 6 | 0.16 | 6 | 0.28 | 11 | 0.56 | 29 |
| -96 | 0.62 | 12 | 2.69 | 25 | 0.38 | 10 | 0.77 | 18 | 0.23 | 5 | 0.14 | 4 | 0.28 | 7 | 0.49 | 18 |
| -72 | 0.90 | 16 | 4.06 | 34 | 0.48 | 12 | 1.03 | 19 | 0.22 | 4 | 0.12 | 3 | 0.25 | 5 | 0.47 | 14 |
| -48 | 0.71 | 13 | 3.30 | 29 | 0.43 | 11 | 0.74 | 18 | 0.21 | 4 | 0.13 | 3 | 0.22 | 6 | 0.57 | 20 |
| -24 | 0.90 | 16 | 4.10 | 34 | 0.46 | 12 | 1.03 | 19 | 0.22 | 7 | 0.11 | 3 | 0.25 | 5 | 0.45 | 14 |
| 0 | 0.92 | 17 | 4.37 | 35 | 0.52 | 13 | 1.08 | 17 | 0.21 | 4 | 0.12 | 3 | 0.24 | 4 | 0.48 | 14 |
| 24 | 0.75 | 12 | 2.70 | 23 | 0.36 | 9 | 0.77 | 14 | 0.27 | 5 | 0.13 | 3 | 0.28 | 6 | 0.46 | 14 |
| 48 | 0.84 | 13 | 2.99 | 26 | 0.43 | 10 | 0.92 | 15 | 0.27 | 5 | 0.14 | 4 | 0.30 | 6 | 0.47 | 13 |
| 72 | 1.05 | 15 | 3.96 | 31 | 0.49 | 11 | 0.98 | 16 | 0.26 | 4 | 0.12 | 3 | 0.24 | 4 | 0.50 | 14 |
| 96 | 1.02 | 15 | 4.18 | 31 | 0.52 | 11 | 0.87 | 15 | 0.24 | 4 | 0.12 | 3 | 0.20 | 4 | 0.60 | 16 |
| 120 | 0.96 | 14 | 3.72 | 30 | 0.54 | 11 | 0.98 | 16 | 0.25 | 4 | 0.14 | 3 | 0.26 | 5 | 0.55 | 14 |
| 144 | 0.57 | 2 | 2.33 | 5 | 0.39 | 2 | 0.56 | 3 | 0.24 | 1 | 0.16 | 1 | 0.23 | 1 | 0.70 | 5 |
| 168 | 0.34 | 8 | 1.48 | 16 | 0.27 | 8 | 0.24 | 12 | 0.22 | 6 | 0.18 | 6 | 0.16 | 8 | 1.11 | 64 |
| 192 | 0.28 | 1 | 0.95 | 1 | 0.22 | 1 | 0.17 | 1 | 0.28 | 1 | 0.23 | 1 | 0.17 | 1 | 1.33 | 10 |
| 216 | 0.10 | 3 | 0.41 | 6 | 0.14 | 4 | 0.05 | 8 | 0.24 | 8 | 0.34 | 11 |
| Object | Reference | ||||
|---|---|---|---|---|---|
| (1) | (2) | (3) | (4) | (5) | |
| NGC 891 Southern end -168” to -240” | 0.26310 | 0.19512 | 0.528 | 0.405 | Present study |
| NGC 891 Inner disk South -24” to -120” | 0.2173 | 0.1308 | 0.263 | 0.512 | Present study |
| NGC 891 Inner disk North +24” to +120” | 0.2606 | 0.1325 | 0.262 | 0.526 | Present study |
| NGC 891 Northern end +144” to +192” | 0.25018 | 0.19120 | 0.192 | 1.0418 | Present study |
| Milky Way Diffuse radiation | 0.215 | 0.159 | 0.238 | 0.676 | Mattila et al.(1996) |
| () | |||||
| G300.2-16.8 Cirrus | 0.33-0.43 | Lemke et al. (1998) | |||
| Oph Bright rim | 0.32 | 0.17 | 0.30 | 0.57 | Boulanger et al.(1996) |
| Twelve galaxy nuclei(starburst) | 0.730.25 | Aitken & Roche(1984) | |||
| (0.40 – 1.44) | |||||
| Six Compact HII Regions | 0.10-0.50 | 0.11-1.7 | 0.09-0.20 | 0.7-10 | Roelfsema et al.(1996) |
| NGC 1333 | 0.65-0.27 | Joblin et al.(1996) |
4 Discussion
4.1 General properties
Despite the much lower level of emission, per unit mass, and the different environment of interstellar space which is probed by our NGC 891 spectra, the basic properties and ratios of the UIR bands are surprisingly similar to the objects with a much higher radiation field, the planetary and reflection nebulae, and HII regions. Also, less surprisingly, they are very similar to the diffuse disk emission of our Galaxy. This demonstrates that the carriers of the UIR bands are very resistant to different interstellar environmental and ageing effects. Also, if the UIR bands are caused by a mixture of different molecule/grain populations their relative abundances and physical parameters (e.g. ionization) must be remarkably constant or, alternatively, the spectral characteristics of the different molecules/grains must be very similar both in NGC 891 and in our Galaxy.
The intensities for the two data sets, i.e. the NGC 891 disk and the diffuse emission of our Galaxy (Mattila et al. 1996), are very similar. This is, however, more probably a coincidence than the result of the similarity of these two galaxies. The width of the ISM distribution in NGC 891 (HI, CO, cold dust) has been observed to be 15” (Rupen 1991, Scoville et al. 1993, Guélin et al. 1993) causing the filling factor in our 24” aperture to be . In the case of our Galaxy the beam filling factor is probably close to 1 but the regions selected were intentionally avoiding the bright portions of the galactic disk emission.
In order to produce thermal emission at the level observed in the UIR peaks of our NGC 891 spectra one needs a temperature of 100 K. Such high equilibrium temperatures cannot be reached by grains in the very low ISRF of the diffuse ISM in a galactic disk. Thus our observation of mid-IR emission in the UIR bands excludes an equilibrium emission and points to emission during thermal spikes.
There is a continuum present both at 6 m as well as in the 9 - 10 m range. This is in agreement with the observations for reflection nebulae, the strongly irradiated Oph rim (see Boulanger et al. 1996) and the cirrus cloud G300.2-16.8 (Lemke et al. 1998). However, the situation in NGC 891 differs from that encountered for the diffuse emission of our Galaxy (Mattila et al. 1996) where no 10 m continuum was seen. The 10 m continuum in NGC 891 is most probably produced by the emission of transiently heated small particles. The contribution by stellar photospheres or circumstellar shells is expected to be negligible (see e.g. Boulade et al. 1996).


4.2 Radial distributions
The line intensities for the four UIR bands along the major axis are shown
in Fig. 4a -d. Besides
the general trend of decreasing line intensity with increasing distance
from the centre we notice for the four UIR bands the following
characteristic features:
(1) a central peak;
(2) a ring of minimum intensity between 20” to 50”;
(3) a ring of maximum intensity between 70” to 120”;
(4) The profiles are not symmetric:
the minimum appears deeper and the maximum broader and stronger on
the northern side.
In Fig. 5 we compare the distribution of the UIR band intensity,
represented by the sum of the 6.2, 7.7, 8.6, and 11.3 m band intensities,
with that of other ISM components:
(1) cold dust, traced by the 1.3 mm continuum emission intensity
(Guélin et al. 1993)
(2) the molecular gas which is traced by the 12CO(2-1) integrated line
intensity (Scoville et al. 1993);
(3) the atomic hydrogen, traced by the 21 cm integrated line intensity
(Sancisi & Allen 1979);
(4) warm dust, traced by the 50 m IRAS CPC emission (Wainscoat et al.
1987);
(5) ionized carbon, traced by the 158 m integrated line intensity
(Madden et al. 1995), and
(6) ionized hydrogen, traced by the H emission (Dettmar 1990,
Dahlem et al. 1994).
It is striking how closely the UIR band intensity follows the 12CO(2-1) line and the 1.3 mm continuum dust emission. These two data sets have closely the same resolution ( 24” - 30”) as our PHT-S data. Considering the coarser resolution (70” - 80”) of the IRAS 50 m data the agreement with the UIR band distribution is also good. The HI 21 cm distribution, on the other hand, is distinctly different. It has a depression in the central area, which suggests a hole in the HI distribution (but can be partly caused by absorption of the continuum emission from the galactic nucleus); the maximum 21 cm intensity occurs further out, and the radial extent is larger than that of the UIR band emission. Details of the [CII] distribution have been smoothed out by the larger beam ( 1’) used in these observations but it is nevertheless seen that the [CII] distribution has a smaller radial extent than the UIR bands along the southern major axis.
The UIR band intensities depend on two factors, the abundance of
their carriers and the ambient radiation density of the exciting photons.
It is usually assumed that UV photons below are
needed to excite the UIR band carriers (See, however, Uchida et al. 1998
for other evidence). We show in Fig. 5h the distribution
of the optical (3400 - 6900 ) emission of the van der Kruit & Searle
(1981) disk model for NGC 891. By comparing the different distributions
in Figs. 5a-h we come to the following conclusions:
(1)the UIR band carriers have a distribution very similar to CO and
large cold dust grains;
(2) a large-scale association of the UIR band emission with neutral hydrogen is not
present;
(3) the UIR band emission does not follow the ionized gas distribution
(H, [CII] 158 m); thus an essential part of the UIR band emission
must come from the non-ionized ISM component.

4.3 Variations of the band ratios
The band ratios , , , and as observed along the major axis of NGC 891 are given in Table 1, and are plotted in Fig. 6.
By inspecting Fig. 6 and Table 1 we notice that
there are some significant trends and differences of the line ratios
between the different parts of NGC 891:
(1) On the southern axis, outside of the molecular ring the
11.3/7.7 ratio increases with
increasing offset, from 0.23 at r -100” to 0.50
at r -200”. This difference
is most clearly demonstrated by the two spectra shown in Fig. 7.
The 8.6/7.7 m ratio shows the same tendency,
increasing from 0.14 at r -100” to 0.20
at r -200”. The 8.6/11.3 m
ratio decreases slightly over this range.
(2) On the northern axis, outside the molecular ring, the 8.6/7.7 m ratio
increases from 0.15 at r 100” to 0.30
at r 200”. Over the same range there is a modest decrease in
the 11.3/7.7 m ratio. As a result the 8.6/11.3 m ratio shows
even a stronger increase than the 8.6/7.7 m ratio:
from 0.6 at r 100” to 1.2 at r 200”
(see also Fig. 8).
(3) Although the 6.2 and 7.7 m intensity distributions are
qualitatively quite similar (see Fig. 4)
the ratio 6.2/7.7 m shows a rather
peculiar behaviour: its value is constant, 0.25, over the whole
northern as well as the outer part of the southern major axis but
between 0” and -120” it drops to 0.22. (see also
Fig. 9). This cannot
be explained by calibration differences between revolutions 656 and 788 as the positions at 0” and +120” which were observed during both revolutions
gave consistent results.
(4) The line ratios for the central position
do not differ from the values of the inner galactic disk.
For comparison with the different areas of NGC 891 we show in Table 2 the line ratios as given in literature for a number of different galactic and extragalactic objects. The values for two positions in the inner Milky Way disk have been observed with the same instrument (PHT-S) and applying similar analysis methods (e.g. Cauchy fits) as for NGC 891. The Milky Way values are seen to agree with the NGC 891 inner disk values except for the ratio which is similar to the northern major axis values. The value for the G300.2-16.8 cirrus cloud, derived from ISOPHOT filter photometry, is in reasonably good agreement with the NGC 891 southern major axis range of values. The band ratios for the Oph Bright rim were derived from ISOCAM CVF observations (Boulanger et al. 1996) using a similar fitting procedure (Lorentz profiles) as for NGC 891. The band ratios are in good agreement with the NGC 891 inner disk values except, perhaps, for the ratio which appears to be somewhat larger. The range of values in covered by the sample of twelve galaxy nuclei (Aitken & Roche 1984) brackets the NGC 891 inner disk values; the average value of the band ratio for the galaxy nuclei, 0.73, is larger than the value for the NGC 891 inner disk and centre.
4.4 Band ratios in the PAH model
There are several possible mechanisms which can influence the PAH band ratios and can potentially explain their variations as observed in NGC 891:
(1) The dehydrogenation of PAHs. The strength of the C–C vibration bands (6.2 and 7.7 m) depends only on the PAH skeleton structure, whereas the C–H band strengths (8.6 and 11.3 m) depend on the number of H atoms in the molecule. The degree of dehydrogenation is measured by which is the ratio between the numbers of actual and possible H atoms in the PAH molecule. Thus = 1 for complete hydrogen coverage and = 0 for fully dehydrogenated molecule. The 8.6 m band strength is proportional to the number of H atoms. For the 11.3 m band the dependence is somewhat more complicated: with increasing dehydrogenation its strength first slightly increases until 0.7 and then monotonically drops for . This is caused by the duo and trio H bonds, see Schutte et al. 1993. For strong dehydrogenation it is thus possible to obtain a small intensity ratio of the 11.3 m to the 6.2 and 7.7 m bands, corresponding to the ISM observations (see Léger et al. 1989, Jourdain de Muizon et al. 1990, Schutte et al. 1993). The dehydrogenation is thought to occur through UV photodissociation, thus becoming monotonically weaker when the ISRF weakens.
This mechanism fails, however, to explain why the band ratios are so similar in high- and low-ISRF objects although the dehydrogenation degrees are expected to be very different. Furthermore, it does not explain why also the 8.6/11.3 m ratio is much higher in the ISM than predicted by the dehydrogenated PAH model.
(2) The fraction of PAH cations, [PAH+]/[PAH]. A probable solution to the band ratio problem has emerged from recent laboratory and theoretical results for PAH cations (for a review see Allamandola et al. 1995): the 6.2, 7.7, and 8.6 m band cross sections for PAH+s are typically a factor of 10 larger than for neutral PAHs whereas the 11.3 m band is much less influenced. The ISM 11.3/7.7 m ratio could thus be understood if a substantial fraction of the PAHs are ionized. The ionization degree results from an equilibrium between ionizing events, depending on the intensity of the ISRF, and recombination events, depending on the local electron density. In regions with high UV radiation density and low electron density, such as reflection nebulae, the fraction of ionized PAHs approaches unity (Omont 1986). In low-ISRF diffuse medium the situation is less clear. Verstraete et al. (1990) have estimated that for the two compact PAHs, coronene and pyrenene and for a solar-neighbourhood ISRF the ionization degree ([PAH+]/[PAH]) is 6%. For the same PAH molecules Bakes & Tielens (1994) and Salama et al. (1996) have calculated similarly low [PAH+]/[PAH] ratios in moderately dense ( 200 cm-3) diffuse clouds. Joblin et al. (1996) have found that the 8.6/11.3 m ratio in the reflection nebula NGC 1333 decreases by a factor of 2 between the position of the star and outer nebula in accordance with the calculated degree of PAH ionization.
(3) The fraction of compact and non-compact species in the PAH ion mixture. Absorption spectra of a number of compact and non-compact PAH cations were measured by Hudgins et al. (1994) and Hudgins & Allamandola (1995). Roelfsema et al. (1996) inspected these results especially in view of the large variation of the 8.6/7.7 m band ratio they observed in compact HII regions (see Table 2). They found that the addition of less condensed PAHs to the mixture enhances the 8.6 m region relative to the 7.7 m region.
4.5 Interpretation of the observed band ratios
We will now make an attempt to interpret the observed band ratios and their variations in NGC 891 in terms of the PAH model.
(1) With reference to point (1) in Sect. 4.3 we notice that the UIR band emission, especially in the 8.6 and 11.3 m bands, is more extended on the southern than on the northern side. Also the 1.3 mm cold dust emission shows the same kind of southern extension with excess emission at -200”. The 12CO and the H I 21-cm emission do not have any excess in this area, but there is a pronounced 21-cm excess beyond -300”. The H emission (corrected for extinction), on the other hand, shows a distinct deficiency in this area. Since there is no deficiency of atomic or molecular hydrogen in this area the deficiency of ionized hydrogen must be caused by a smaller number of hot young stars. Thus the UV ISRF is weaker in this area as compared to the corresponding regions at the northern major axis. We interpret the simultaneous increase of the 11.3/7.7 m and 8.6/7.7 m ratios to be caused mainly by increased hydregenation of PAHs in this region with low UV ISRF.
(2) The behaviour of the ratios 8.6/7.7 m, 11.3/7.7 m, and 8.6/11.3 m towards the end of the northern major axis (point 2 in Sect. 4.3) calls for a different explanation. An increasing fraction of PAH cations relative to neutral PAHs can explain the increase of the 7.7/11.3 m and 8.6/11.3 m ratios. However, the increase of the 8.6/7.7 m ratio can not be explained this way. In view of the results of Roelfsema et al. (1996) for galactic HII regions (see Sect. 4.4, point (4) above) we suggest that this effect is due to the increasing contribution of non-compact PAH cations, residing preferentially in high-luminosity HII regions. This interpretation is in accordance with the observed higher H luminosity indicating higher ionization at the northern part of the major axis.
(3) The modest depression of the 6.2/7.7 m ratio on the inner southern major axis between 0” and -100” is more difficult to explain. It could be due to a lower average temperature of PAHs during their temperature spikes. This could happen if the mean energy of the UV photons were lower or the PAH size larger in this region. It is difficult to judge on the basis of the available data whether either of these prerequisites is fulfilled.
(4) Assuming that the width of the 3.3 m UIR band in NGC 891 is the same as in the diffuse emission of our Galaxy, m (Tanaka et al. 1996), the upper limit of the 3.3 m band intensity in the NGC 891 disk can be estimated to be W cm-2 sr-1. The 11.3 m band intensity is W cm-2 sr-1 (see Table 1), which gives a lower limit of 3 for the 11.3/3.3 m ratio. Following the analysis of Jourdain de Muizon et al. (1990) this allows us to set for the average PAH emission temperature an upper limit of K which leads to an estimate for the lower limit of the average PAH size (number of atoms) of . These limits indicate that the temperature is at least somewhat lower and the PAH size at least somewhat larger than the typical values found for HII regions and reflection nebulae (see Léger et al. 1989, Jourdain de Muizon et al. 1990).
5 Conclusions
(1) We have observed for the first time the UIR band spectra at 6.2, 7.7, 8.6, and 11.3 m in the diffuse emission of an external galaxy disk, the nearby edge-on Sb spiral NGC 891.
(2) The UIR band emission between 5.9 and 11.7 m is 9% of the total infrared emission of the galaxy.
(3) The UIR band emission is visible along the major axis of the galaxy up to a distance of 10 kpc.
(4) The distribution of the UIR band intensities is closely similar to that of the 1.3 mm continuum emission by cold dust and to that of the 12CO(1-0) line intensity, whereas the 21-cm HI emission has a substantially broader distribution. The distributions of the H and [CII] 158 m line emissions are also different from the ones for the UIR bands. We conclude that the UIR band carriers are mainly associated with areas of neutral molecular gas.
(5) The UIR band ratios show substantial variations along the major axis of NGC 891. Adopting the PAH model the band ratios suggest a low dehydrogenation degree of the PAHs at the southern end of the major axis, and an increase of the fraction of PAH cations, especially the non-compact ones, along the northern major axis of NGC 891.
Acknowledgements. We gratefully acknowledge the financial support for this research project by the University of Helsinki Research Fund and the Academy of Finland (Project 1011055).
References
- [1] Ábrahám P., Acosta-Pulido J.A., Klaas U. et al., 1998, Proc. of the first ISO Workshop on Analytical Spectroscopy with SWS, LWS, PHT-S and CAM-CVF, ESA SP-419
- [2] Aitken D.K., Roche P.F., 1984, MNRAS 208, 751
- [3] Allamandola L.J., Sandford S.A., Hudgins D.M., Witteborn F.C., 1995, PASP Conf. Ser. 73, 23
- [4] Bakes E.L.O., Tielens A.G.G.M., 1994, ApJ 427, 822
- [5] Boulade O., Sauvage M., Altieri B. et al., 1996, A&A 315, L85
- [6] Boulanger F., Boissel P., Cesarsky D., Ryter C., 1998, A&A 339, 194
- [7] Boulanger F., Reach W.T., Abergel A. et al., 1996, A&A 315, L325
- [8] Bregman J., Allamandola L.J., Tielens A.G.G..M., Geballe T.R., Witteborn F.C. et al., 1989, ApJ 344,791
- [9] Dahlem M., Dettmar R.J., Hummel E., 1994, A&A 290, 384
- [10] Dettmar R.-J., 1990, A&A 232, L15
- [11] Gabriel C., Haas M., Heinrichsen I., Tai W.-M., 1998, The ISOPHOT Interactive Analysis – PIA User Manual V 7.0
- [12] Giard M., Pajot F., Lamarre J.M. et al., 1988, A&A 201, L1
- [13] Gillett F.C., Forrest W.J., Merrill K.M., 1973, ApJ 183, 87
- [14] Guélin M., Zylka R., Mezger P.G. et al., 1993, A&A 279, L37
- [15] Handa T., Sofue Y., Ikeuchi S., Kawabe R., Ishizuki S., 1992, PASJ 44, L227
- [16] Helou G., Ryter C., Soifer B.T., 1991, ApJ 376, 505
- [17] Hudgins D.M., Allamandola L.J., 1995, J.Ph.Chem. 99, 3033
- [18] Hudgins D.M., Sandford S.A., Allamandola L.J., 1994, J.Ph.Chem. 98, 4243
- [19] Joblin C., Tielens A.G.G.M., Geballe T.R., Wooden D., 1996, ApJ 460, L119
- [20] Jourdain de Muizon M., d’Hendecourt L.B., Geballe T.R., 1990, A&A 227, 526
- [21] Klaas U., Acosta-Pulido J.A., Ábrahám P. et al., 1998a, in Proc. of the first ISO Workshop on Analytical Spectroscopy with SWS, LWS, PHT-S and CAM-CVF, ESA SP-419
- [22] Klaas U., Laureijs R.J., Radovich M., Schulz B., 1998b, ISOPHOT Calibration Accuracies, SAI/98-092/Dc, Version 1.0
- [23] Kruit P.C. van der, Searle L., 1981, A&A 95, 116
- [24] Léger A., d’Hendecourt L., Défourneau D., 1989, A&A 216, 148
- [25] Leinert Ch, Ábrahám P., Lemke D. et al., 1998 (in preparation)
- [26] Lemke D., Klaas U., Abolins J. et al., 1996, A&A , 315, L64
- [27] Lemke D., Mattila K., Lehtinen K. et al., 1998, A&A 331, 742
- [28] Madden S.C., Geis N., Townes C.H. et al., 1995, in Airborne Astronomy Symposium on the Galactic Ecosystem, ASP Conf. Ser. 73, 181
- [29] Mattila K., Lemke D., Haikala L. et al., 1996, A&A 315, L353
- [30] Moorwood A.F.M., 1986, A&A 166, 4
- [31] Moorwood A.F.M., Lutz D., Oliva E. et al., 1996, A&A 315, L109
- [32] Omont A., 1986, A&A 164, 159
- [33] Onaka T., Yamamura I., Tanabé T., Roellig T.L., Yuen L, 1996, PASJ 48, L59
- [34] Price S., 1981, AJ 86, 193
- [35] Puget J.L., Léger A., Boulanger F., 1985, A&A 142, L19
- [36] Reach W.T., Abergel A., Boulanger F. et al., 1996, A&A 315, L381
- [37] Rice W., Londsdale C.J., Soifer B.T. et al., 1988, ApJ S 68, 91
- [38] Ristorcelli I., Giard M., Meny C. et al., 1994, A&A 286, L23
- [39] Roche P.F., Aitken D.K., Smith C.H., Ward M.J., 1991, MNRAS 248, 606
- [40] Roelfsema P.R., Cox P., Tielens A.G.G.M. et al., 1996, A&A 315, L298
- [41] Rupen M.P., 1991, AJ 102, 48
- [42] Salama F., Bakes E.L.O., Allamandola L.J., Tielens A.G.G.M., 1996, ApJ 458,621
- [43] Scoville N.Z., Thakkar D., Carlstrom J.E., Sargent A.I., 1993, ApJ 404, L59
- [44] Schutte W.A., Tielens A.G.G.M., Allamandola L.J., 1993, ApJ 415, 397
- [45] Spoon H.W.W., Genzel R., Lutz D., 1998, ASP Conf. Series 132, 414
- [46] Tanaka M., Kawada M., Matsumoto T. et al, 1996, PASJ 48, L53
- [47] Sancisi R., Allen R.J., 1979, A&A 74, 73
- [48] Uchida K.I., Sellgren K., Werner M., 1998, ApJ 493, L109
- [49] Verstraete L., Léger A., d’Henecourt L., Dutruit O., Défourneau D., 1990, A&A 237, 436
- [50] Wainscoat R.J., de Jong T., Wesselius P.R., 1987, A&A 181, 225
- [51] Walterbos R.A.M., Schwering P.B.W., 1987, A&A 180, 27
- [52] Walterbos R.A.M., Greenawalt B., 1996, ApJ 460, 696
- [53] Xu C., DeZotti G., 1989, A&A 225, 12