Predicted HST FOC and broad band colours for young and intermediate Simple Stellar Populations
Abstract
This paper presents theoretical HST and broad band colours from population synthesis models based on an homogeneous set of stellar evolutionary tracks as computed under canonical (no overshooting) assumptions, covering the range of cluster ages from Myr to Gyr for three different metallicities (Z, , and ). Statistical fluctuations in the cluster population have been investigated, assessing the predicted fluctuations of the various colours as a function of the cluster integrated absolute magnitude. We show that the red leak in HST UV filters deeply affects the predicted fluxes and colours. However, we find that for F152MF307M and for F170MF278M (which means ages lower than 1 Gyr) the HST UV colours can still be used to infer reliable indications on the age of distant clusters. Moreover, one finds that the age calibration of these colours is scarcely affected by the amount of original helium or by the assumed IMF. On this basis, we present a calibration of the HST UV two-colours (F152MF307MvsF170MF278M) in terms of cluster ages for the three above quoted metallicities. We suggest the combined use of HST UV colours and IR colours (VK in particular) to disentangle the metallicity-age effect in integrated colours of young stellar populations ().
Key words: : (Galaxy:) open clusters and associations: general – (Galaxies:) Magellanic Clouds – Galaxies: star clusters
1 Introduction
The integrated light emitted by distant stellar populations is among the most stimulating evidence concerning the evolution of matter in the Universe. The challenge of interpreting integrated spectra and/or colours of distant objects (galaxies and stellar clusters) in terms of stellar ages and chemical compositions was early gathered by several authors, approaching the problem of population synthesis both from a theoretical or an observational point of view (see, e.g., Larson 1974; Tinsley 1980; Searle, Wilkinson and Bagnuolo 1980; Renzini and Buzzoni 1986; Barbaro and Olivi 1986; Arimoto and Yoshii 1986, 1987; Rocca-Volmerange and Guiderdoni 1987). According to the relevance of the subject, population synthesis models have been continuously upgraded over the years (Worthey 1994; Bressan et al. 1994; Leitherer & Heckman 1995; Bruzual & Charlot GISSEL96 as quoted in Leitherer et al. 1996; Vazdekis et al. 1996) and a wide data base collecting the most recent results can be found in Leitherer et al. (1996). This scenario has been recently extended to HST photometric bands by Padua group (Chiosi et al. 1997).
As pointed out by Charlot et al. (1996), the adopted library of stellar evolutionary tracks is the basic assumption which determines the predicted integrated properties of a Simple Stellar Population, i.e., of a group of coeval and chemically homogeneous stellar objects (hereinafter SSP). In a previous work (Barbero et al. 1990) we collected evolutionary tracks from several papers in the literature to present an age calibration of integrated UV colours of young stellar clusters in the Large Magellanic Clouds. In that paper we found a rather satisfactory agreement between theoretical predictions and observation. On this basis we suggested the use of the UV two-colours diagram (C(1531) vs C(1828)) as a useful test for theories, to be calibrated in terms of cluster ages. After that paper, the Teramo-Pisa-Frascati (TPF) cooperation has progressively made available a homogeneous set of stellar evolutionary tracks which covers the main evolutionary phases expected in the stellar populations over a rather large range of assumed ages and chemical compositions. In this paper we will make use of this opportunity to revisit the problem of cluster integrated light by relying on such a self-consistent and improved theoretical scenario.
As already discussed in several papers (Brocato et al. 1994 and reference therein) TPF isochrones differ from similar computations based on Padua or Geneva library of stellar evolutionary models (see Leitherer et al. 1996 for the precise references of these tracks) mainly because in TPF stellar models the efficiency of overshooting from convective hydrogen burning cores is assumed negligible while both Padua and Geneva models adopt a relatively high efficiency, directly leading to different evolutionary times of the core H-burning phase. Since the actual amount of core overshooting is still far from being a settled question and since most of the population synthesis models are based on tracks computed by using Padua or Geneva tracks, it is obviously interesting to discuss the results of population synthesis as computed in the limit of no overshooting, at least to allow a comparison between alternative evaluations on that matter. In this context one has to notice that all the referred evolutionary computations rely on similar input physics, allowing a meaningful comparison among different results.
The main goal of this paper is to address some new approaches concerning the use of population synthesis results. As a first point, we will discuss in some details not only the uncertainties connected to the assumed Initial Mass Function (IMF) of cluster stars, but also the statistical fluctuations connected to the richness of the cluster in terms of abundance of luminous stars. We will show that these fluctuations can be easily put in dependence of the total integrated cluster light, thus providing a useful recipe to estimate the degree of reliability of observational data from SSP. As a further point, the Hubble Space Telescope (HST) is presently a fundamental source of high quality data for distant galaxies and stellar clusters. Since HST works in space, it can access the UV wavelength range, which has been already recognized as a fairly good indicators of the age of stellar populations (Barbero et al. 1990; Cassatella et al. 1996; Chiosi et al. 1997), at least in the range from 10 Myr to a few Gyr. According to such evidence, we will present predicted integrated colours based on HST filters as expected by simple stellar populations with and ages ranging from yr up to yr, the upper limit of ages being chosen in order to keep our simulations free from assumptions about the temperature distribution of Horizontal Branch (HB) stars. Thus theoretical predictions are primarily intended to investigate the integrated colours of not-too-old stellar clusters.
The next section is devoted to present the theoretical background and to discuss the choice of the selected filters. Integrated colours for a reference population are discussed in the following section. The influence of IMF and chemical composition on the synthetic integrated colours is then discussed in section 4. The comparison with previous models and with LMC clusters is given in section 5. The age calibration and the features of a UV colour-colour diagram are presented in section 6, where we approach the problem of deriving age and metallicity from integrated colours together with a tentative application of present results. Final remarks and conclusions close the paper.
2 The theoretical background
A major requirement for population synthesis models concerns the set of stellar evolutionary tracks adopted to predict the effective temperature and the luminosity of stars contributing to the total energy flux. Here we will rely on the extensive set of stellar models presented for high (Brocato & Castellani 1993), intermediate (Cassisi, Castellani & Straniero 1994) and low mass (Straniero & Chieffi 1991; Castellani, Chieffi & Straniero 1992) stars. This set provides an homogeneous and complete evolutionary scenario since all the computations have been performed with the same stellar evolutionary code and with similar physical assumptions. It covers a wide range of values of both stellar masses and/or chemical compositions. As an example, Fig. 1 shows the run of evolutionary tracks for Y0.27 and Z0.02.

The adopted grid of stellar evolutionary tracks has been already submitted to extensive comparisons with observations, which have shown a reasonable accuracy of the models in reproducing the behavior of real stars in terms of lifetimes, effective temperatures and luminosities for a large range of ages. Colour-Magnitude (CM) diagrams of stellar clusters as NGC 2004 ( yr: Bencivenni et al. 1991), NGC 1866 and NGC 1850 ( yr: Brocato et al. 1989 and Gilmozzi et al. 1994), M11 ( yr: Brocato, Castellani and Di Giorgio 1993), other open galactic clusters (Castellani, Chieffi and Straniero 1992) and NGC 188 (Caputo et al. 1990) all show to be in substantial agreement with the quoted theoretical models concerning magnitudes, colours and stellar counts in the various evolutionary phases.
To compute integrated colours we updated the population synthesis code presented by Brocato et al. (1990). The major changes are related to the new set of evolutionary tracks and to the relation adopted to derive magnitudes and colours from the theoretical data log(L/L⊙), log(Te). The input parameters are the age (t), helium content (Y), metallicity (Z) and total number of stars (N) and slope of the Initial Mass Function (IMF), assumed to be a power law. A value of corresponds to the classical Salpeter (1955) slope The original chemical composition (Y and Z) defines the set of tracks which is then used to compute the synthetic CM diagram. In all the models, we use a Monte Carlo simulation to generate the mass of each ’star’ according to the power law distribution, simulating in this way the stochastic behavior of the IMF. Finally, a simple sum of the flux of each star provides the integrated fluxes and colours. This procedure has the advantage of keeping under control the results of the simulations by showing the ’theoretical’ CM distribution of the simulated population that can be compared to the observed CM diagram of real stellar clusters for a further check. Moreover, the contribution of each evolutionary phase can be easily evaluated either in terms of contribution to the integrated bolometric magnitude or to the integrated magnitude in a given filter.
The choice of the filters has been based on the three following considerations:
1. the major age indicator in CM diagrams of young and intermediate age populations is the upper and hottest Termination of the Main Sequence (TMS). The stars located at the TMS are the most significant contributors to the integrated light for those populations. This means that the most efficient region of the spectral energy distribution to investigate the age is the UV side. Moreover, a not negligible aspect is that the MS phase is also the most populated evolutionary phase (thanks to the large H-burning timescales), making this indicator the best choice also for statistical reasons. Barbero et al. 1990 presented a two UV colour diagram (C(1531) vs C(1825)) based on the photometric bands explored by the ANS-satellite, showing a fair correlation with the age. More recently, Cassatella et al. (1996) proved that ages obtained with these integrated UV colours are consistent with ages derived by isochrone fittings for a sample of LMC clusters. A survey on the available HST filters discloses that F152M, F170M, F253M, F278M and F307M may represent a valid counterpart for the quoted ”ANS” filters.
2. The V filter is one of the most common filters and it has been extensively used also by HST observers. Moreover Dorman et al. (1993, 1995) have already shown that it could be very useful in investigating chemical composition when used in conjunction with UV filters.
3. Standard U, B, R, I, J, K, L and HST-WFPC2 F606W filters have been also selected because of their extended use with the Wide Field Planetary Camera2 and NICMOS on board HST as well as in ground-based observations of stellar systems. It is thus possible to compare population synthesis models with wide band observations of distant stellar objects. Integrating in such a way the evaluation already given by Chiosi et al. (1997) conserning the HST expectations.
According to these choices, our population synthesis code evaluate colours on the basis of stellar atmosphere model by Kurucz (1979ab : K79). This choice relies on the evidence that the mixing length parameter adopted in the computations connected to K79 gives a better (but not perfect) approximation of the observed colours of cool stars than new model atmospheres do (see the discussion in Brocato, Castellani & Piersimoni 1997). Adopting more recent model atmospheres (for example as given by Kurucz 1992) would only increase the discrepancy between predicted and observed magnitudes and colours.
In order to translate the theoretical isochrones from the HR diagram to the different colour–magnitude diagrams (CMDs), and to calculate the integrated colours by simply summing the contribution of all the stars, we used the standard HST synphot task running under the IRAF package. We computed the (Mi–V) colours, where the index stands for the various filters mentioned above, as expected from the Kurucz model atmospheres for a wide range of temperatures (3750K T50000K) and gravities (0.75log g5 in cgs units), covering the excursion of these quantities during the whole stellar life.
The adopted model grid has a lower mass limit of M0.6 M⊙. However, one already knows that lower masses should give a negligible contribution to the cluster light. As a test, we performed a set of numerical experiments implementing the grid of Reference Frame (RF) models (see next section for definition) with the stellar models of very low mass stars by Alexander et al. 1996, extending the lower mass limit down to 0.15 M⊙. The resulting integrated colours are, for all the ages, within the expected statistical fluctuations (see below) of the RF models. As expected, the larger difference is found for the VK colour (- mag), due to the very low temperature of the faint but numerous lower main sequence stars. However note that the lower portion of the MS should play a not negligible role when dealing with colours at even larger wavelengths, i.e., in the far IR.
3 Integrated colours for the Reference Population
To present and to discuss the results of theoretical simulations we will assume as a reference frame (RF) the results concerning a stellar population with solar composition (Y0.27, Z0.02) where a total number N30000 of stars is distributed according to a Salpeter IMF (2.35) between 0.6 and 25 M⊙. After discussing theoretical predictions concerning such a sample, we will refer to this ’archetype’ to investigate the influence of changing the assumptions either on the IMF or on the chemical composition.


To begin with, we present a selected sample (top-left panels of Fig. 2 - 5) of the theoretical logL/L⊙ vs log Teff diagrams as obtained adopting (for graphic reasons) N3000 and for four representative ages ( years). Bearing in mind that the ’stars’ plotted into theoretical diagrams represent the contributor to the total integrated flux of the population, the figure shows the well known occurrence for which young clusters are dominated by hot giants, whereas for larger ages the flux from Red Giant and Asymptotic Giant Branch stars begins dominating. Theoretical expectations about broad band colours can be better understood by looking at Fig. 2 to Fig. 5 where we compare, for each selected cluster age, the theoretical logL/L⊙ vs log Teff diagrams with similar diagrams but for selected photometric bands.
One should in particular notice the curious CMD of stellar populations of different ages, as seen by HST red leaked filters (see also Chiosi et al. 1997). One finds that in the UV CMD (F152MvsF152MF307M) the MS discloses an unusual turn back at F152MF307M which means that, in such filter system, faint cool MS stars have a colour very similar to the stars populating the upper portion of the MS. Note also that cool core He-burning stars have rather ’blue’ colours. Both these effects will strongly influence the expectations about cluster integrated light.
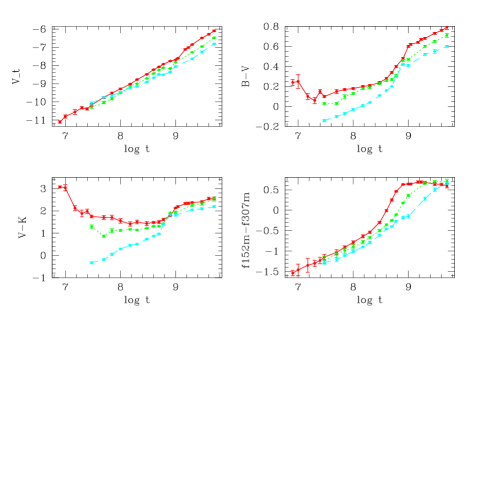
Bearing in mind such a scenario, we present in Fig. 6 (Table 1a,b) theoretical expectation about cluster integrated colours as obtained from cluster populated by 30000 stars between 0.6 and 25 M⊙. The labeled errors show the 1 dispersion of the results obtained in 100 independent simulations. One can note that all the HST UV colours disclose monotonic relationships with the age, up to yr, thanks to the fact that most of the flux emitted at these wavelengths is generated by the more luminous main sequence stars.

At the HST UV colours loose their sensitivity to variation in age and become roughly constant. This is not due to the variation in the UV flux of the population, but it is the result of the red leak of the HST filters which transmit the flux emitted by RGB stars and by the numerous low MS stars. This can be seen in Fig. 7, where the colour expected by HST filters is plotted against the colour obtained by theoretical filters centered at similar wavelengths and with a passband of 200Å, but without red leak. The red leak, then, acts in the way of simulating the presence of ’blue’ stars in the UV CMD. However, the hot stars of the MS termination are brighter than the ’redleaked’ cool stars up to . For this reason the relation HST UV integrated colours vs age shown in Fig. 2 holds up to this age and becomes almost flat for larger ages. In conclusion, the previous discussion indicates that the red leak plays a relevant role when interpreting HST UV integrated colours.

Coming back to Fig. 6, one finds that all the broad band colours show a relatively flat minimum, i.e. a bluer colour, at intermediate ages. This is due to the occurrence in the younger population of red supergiants experiencing their He-burning phase. In particular, very young populations ( yr) are expected to have even redder VK values than very old one () yr. This result will be further examined in discussing the effect of metallicity on present models. Another interesting feature of the broad band colours is the change of slope decreasing the age at due to the appearance of the Red Giant Branch which leads to redder colours.
Before closing this section, we notice that the total abundance of stars can play a significant role in determining the integrated colour of a stellar cluster. Poorly populated clusters should be affected by large statistical fluctuations in the distribution of luminous stars in the CM diagram, which in that case is no longer led by the evolutionary constraints, but governed by stochastic rules. We have already found that N30000 gives satisfactorily small fluctuations. However, to have more light on such an occurrence, we explored the behavior of the RF population at 10 Myr, 100 Myr and 1 Gyr and for different total numbers of stars (N100, 500, 1000, 3000, 7500, 10000, 30000, 45000) by computing a series of 100 models for each given age and N value. The top left panel in Fig. 8 shows, for each N value, the 1 dispersion of the expected cluster integrated V magnitude as computed for the three selected cluster ages. The other panels in the same figure show theoretical expectations about cluster integrated colour given as a function of the integrated V magnitude of the cluster through the relation depicted by the top left panel. As expected, for each given V magnitude, one finds that decreasing the cluster age integrated colours appear more and more affected by statistical fluctuations, as a consequence of the stochastic contribution from few giants stars in a rapid evolutionary phase.
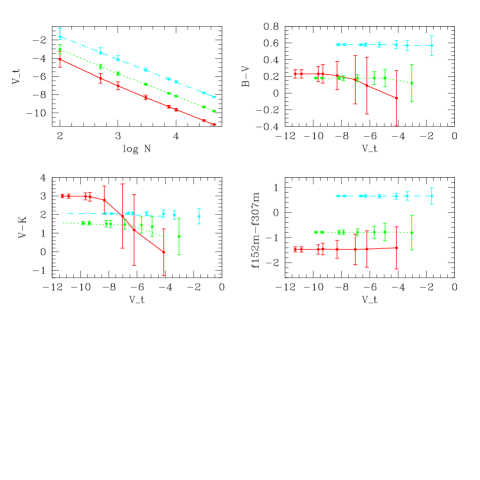
As an use result, one finds – e.g. – that for an age of 10 Myr the Johnson colours BV, VK (and VI) do not correlate with cluster evolutionary status unless the cluster is brighter than about V9. This is not the case for UV HST colour, which are much less affected by the stochastic occurrence of red giant stars. As a whole, data in Fig. 8 give a useful warning on the use of integrated colour of stellar clusters. Bearing in mind these results, in the following we will limit our study to populations for which the MS is ’dominated’ by the IMF law, discussing in all case the result obtained from cluster populated by 30000 stars between 0.6 and 25 M⊙.
4 IMF and chemical composition
To study the influence of the initial distribution of masses, we have repeated the simulations described above, this time varying the IMF power law exponent over a wide range of values. Fig. 9 shows synthetic colours for , corresponding to the extreme limit of a uniform mass distribution, , i.e. less than Salpeter’s value, and , corresponding to a distribution steeper than Salpeter’s one. At first glance, one would expect that decreasing the exponent the cluster becomes brighter, since a larger fraction of stars is pushed toward the more massive and, thus, more luminous stars. The upper left panel in Fig. 9 shows that is not always the case: for ages larger than, about, 1 Gyr the extreme case of a flat IMF results in fainter clusters, just because for such large ages the luminosity is produced by the now depopulated range of less massive stars.

The general trends of integrated colours do not appear dramatically affected by IMF: the HST UV colours maintain their monotonic behavior and broad band colours still show a minimum around . However, a large variation in the IMF slope can influence the absolute values of the integrated colours depending on the age and on the particular colour examined. In general, one finds that the variations are smaller than 0.2 mag and only in the case of the colours show larger fluctuations. However, for the colour vs age relations do not depend on the IMF slope any more, because the colours are dominated by RGB and post RGB stars, whose distribution is fixed by evolutionary timescales only. For younger ages the influence of the IMF on the integrated colour increases since a non negligible portion of the emitted flux comes from MS stars, according to their relatively long evolutionary timescales and, thus, according to their IMF distribution. As a relevant point, one finds that HST UV colours appear affected only in the extreme case of a very steep IMF (), showing to be – in this respect – a rather robust indicator of cluster age.
The influence of chemical composition has been investigated by computing selected models either keeping fixed the Helium content (Y0.27) while varying Z to selected values (Z) or changing Y (Y and Y) for a fixed Z (Z). As far as the metallicity is concerned (Fig. 10, Table 1–3), one finds the interesting feature for which decreasing the metallicity the relation between broad band colours and age becomes more and more monotonic. For young ages, the Z0.001 models show much bluer colour (even 3 mag of difference in VK colour) than the solar metallicity models. This is due to the difference in the evolution of intermediate mass stars in the phase following the exhaustion of H in the center. Solar metallicity models run to the red portion of HR diagram and set their He-burning phase at low temperature, near the Hayashi track, for at least half of their evolutionary time. On the other hand low metallicity stars (Z 0.001) do not reach this part of the HR diagram, but stay in the blue side during all the He-burning phase. We note that such a behavior is strongly dependent on the treatment of convection in the more massive models, so that colours of young population appear sensitively model dependent (see Brocato & Castellani 1993).
The behavior of HST UV colours discloses differences in their pattern according to the different metallicities . As well known, the RGB location in the HR diagram depends on metallicity, in the sense that cooler RGB are expected from stellar models of larger metallicity. For this reason the low metallicity population synthesis models have hotter RGB than RF models do. As a consequence, they are less affected by red leak and they maintain a monotonic behavior for the older ages presented here.

Finally, Fig. 11 (Table 3–4) shows that little variations are found for different assumptions on the Y value. In particular, variations in Y do not affect the HST UV colours and most of the large band colours (a small difference can be found in VK colour at intermediate ages) for the range of ages considered in the present work.
5 Comparison with previous models and to LMC clusters
As a first step, Fig. 12 compares the UV two-colours diagram (C(1531) vs C(1828)) presented in the already quoted paper by Barbero et al. (1990) with analogous results, but obtained from the present computations over the relevant range of ages (t 1 Gyr). The time evolution of the diagrams appear in rather good agreement, supporting the scenario discussed in that paper. However, a not negligible difference can be found in the absolute calibration of the age which is now revised according to Table 5. In the same figure we plot observational data for the sample of LMC stellar clusters presented by Barbero et al.(1990), implemented with more recent data by Cassatella et al. (1996).

Further comparisons can be made only for broad band colours, since HST filters, as presented in this work, up to now have been presented only by Yi, Demarque & Oemler (1995) but for older populations ( Gyr). One finds a general agreement with the behavior of UBVK colours given by Bruzual & Charlot (1993) for simple stellar populations. These authors adopted stellar evolution tracks by Maeder & Meynet (1989, 1991) in which a rather efficient core overshooting is assumed, thus predicting different (larger) evolutionary times. Our models predict the occurrence of red supergiants in moderately metal poor massive stars, not found by Maeder & Meynet because of the adoption of the Schwarzschild convective criterion (see, for a discussion on that matter Stothers & Chin 1992, Brocato & Castellani 1993 and references therein). Correspondingly, we predict redder colour for very young, moderately metal poor clusters.
To enter in more details, let us compare our results with the colours more recently presented by Bressan et al. (1994: B94) and by Bruzual and Charlot (GISSEL95 and GISSEL96 : Leitherer et al. 1996), again on the basis of stellar evolutionary models allowing for an efficient core overshooting. The comparison, as given in Fig. 13 for clusters with solar metallicity, discloses a remarkable agreement in both UB and BV colours. As expected, for a given UB colour B94 and GISSEL95/96 give larger ages. As a matter of fact, this colour is dominated by the luminous termination of the cluster MS, and overshooting gives (roughly) a similar termination but for larger ages than canonical computations do. This difference vanishes for the larger ages, perhaps – at least in part – because for less massive stars in the range 1.0 to 1.5 M⊙ B94 adopted a reduced amount of overshooting.

The comparison of BV colours deserves a bit more discussion. One finds a close similarity of results for log t 9, whereas for larger ages B94 predicts redder colours. This last occurrence can be taken as an evidence that for old cluster dominated by Red Giants B94 gives cooler Giant Branches than we do. Both computations use a mixing length l 1.6 Hp, and the above occurrence should be likely ascribed to the use by B94 of improved model atmosphere by Kurucz (1992) which give slightly redder colour for red giants. However, we have already discussed in the introduction the evidence that even our branches appear too red in comparison with actual clusters. Thus we can only conclude that predictions about red colour indexes should wait for evolutionary computations calibrated on the cluster giant branch rather than on the Sun. GISSEL95/96 are slightly bluer than B94 probably due to the different assumption on the model atmospheres, however more details can be found in Charlot, Worthey & Bressan (1996).
Finally, one finds that our, B94 and GISSEL95/96 VK colours appear reasonably similar only in a restricted range of ages, namely for 7 log t 8. For smaller age we predict more red giants and, thus, redder colours than B94 does. A possible explanation could be related to the fact that B94 models in this range of masses have been possibly interpolated between the 12 (which has a He-burning loop in the red side of the CMD) and the 30 (which has the He-burning phase at high temperature, i.e. low emission in the K band). Consequently their VK colours move to the blue following this interpolation.
The discrepancy at the larger age can be understood bearing in mind that this colour largely follows the occurrence of AGB stars (see, e.g., Ferraro et al. 1994). The results by B94 show a jump in the VK colour at due to the Phase Transition (Renzini & Buzzoni 1986) at . In our models we included the AGB phase when but neglecting the thermal pulses phase (TP-AGB). GISSEL95/96 models present a trend similar to our model even if they are sistematically redder than our of about 0.5 mag. This discrepancy is again related to the different treatment of the TP-AGB phase which foresee a different number of expected TP-AGB stars (see also Charlot, Worthey & Bressan 1996). However, we recall that the actual time extension of the TP-AGB is still a debated question (Blöcker & Schönberner 1991, Renzini 1992).

To shed light on this problem and, more generally, to test theoretical predictions Fig. 14 compares theoretical prediction with observational UB, BV and VK colours vs age relations for MC clusters with known age from isochrone fitting. The population synthesis models for each colour are plotted for both Z0.02 and Z0.006. The agreement is good for UB and BV, and the somewhat large uncertainties on age do not allow any discrimination about the efficiency of overshooting. The VK colour is much less clear, and – in particular – one finds clusters distributed on both the alternative predictions of curves in Fig. 14. The possible statistical fluctuations, which for VK colour can be larger than mag for clusters with , and the uncertainties in the age evaluation of MC stellar clusters could largely take into account the scatter of observational data, forbidding any conclusion on that matter.
Beyond such an uncertainty, let us notice that the fair agreement between our broad band UB and BV colours and those by B94 and by Bruzual & Charlot (GISSEL95/96) suggest that the results of population synthesis appear rather solid, given current uncertainties in the stellar evolution theories.
6 Discussion and Conclusions
To further explore the capability of HST filters to give information on the cluster ages Fig. 15 compares the (F152MF307MvsF170MF278M) two colour diagram for the RF model with a similar diagram but for filters without red-leak. One finds that for F152M-F307M values larger than 0.2 the red leak effect dominates, producing the small hook at F152M-F307M. This is the consequence of the fact, already shown in Fig. 7, that at F152MF307M HST colours saturate and their relation with the age is not reliable any more. It follows that HST filters can give cluster ages only for blue colours (F152MF307M ), i.e., for ages smaller than 1Gyr. As shown in the same figure, this should not be the case for the C(1531)vsC(1828) colours, which are not affected by any red leak.

The calibration of the two colours relation in terms of cluster ages can be derived from Table 6 for selected metallicity values. As discussed in section 4, the effects of the Y or IMF appear of minor relevance. A major uncertainty in the evaluation of the age is due to the metallicity, in the sense that for a given colour a low metallicity population would have older ages. However, we have already found that VK colours appear quite sensitive to the cluster metallicity. We suggest that UV integrated colours together with VK colours could be important tools to infer information on the age and metallicity of relatively young population in distant stellar systems. Although the present theoretical uncertainties shown in Fig. 13 still require precise and conclusive comparison between stellar evolutionary models of massive stars and young stellar clusters, we present two cases as an example of the potential application of firm theoretical constraints on integrated cluster colours. As a first approach to this problem, let us discuss HST observations of suspected young clusters in the field of the galaxies NGC 3921 (Schweizer et al. 1996) and NGC 1275 (Holtzman et al. 1992). The lower panels in Fig. 16 show the observed distribution of VI colour for clusters in NGC 3921 (left panel) and of VR colours for clusters in NGC 1275. The upper panels show the predicted time evolution of the corresponding colours (age on y axis) of three simple stellar populations with the labeled metallicities.

By adopting the present integrated colours prediction, one would derive that in NGC 3921 the bulk of clusters should be as old as, at least, years (or, alternatively as young as years if a solar metallicity is assumed). However, the occurrence of clusters at VI smaller than 0.2 mag should be interpreted as an evidence for these clusters being both much younger and metal poor. Similar consideration can be done for clusters in NGC 1275 VR 0.2. This colour is never reached by solar metallicity clusters so these stellar systems should have a lower metallicity and an age not exceeding years.
As a conclusion, we recall that in this paper we have presented theoretical HST and broad band colours from population synthesis models based on a homogeneous set of stellar evolutionary tracks as computed under canonical (no overshooting) assumptions, covering the range of cluster ages from t Myr to t Gyr for three different metallicities (Z0.02, 0.006, and 0.001). Statistic fluctuations in the cluster population have been investigated, assessing the expected standard fluctuations of the various colours as a function of the cluster integrated V absolute magnitude.
We show that the red leak in HST UV filters can deeply affect the expected fluxes and colours. However, we find that for F152M-F307M and for F170MF278M (which means ages lower than 1 Gyr) the HST UV colours can still be used to infer reliable indication on the age of distant clusters. Moreover, one finds that the age calibration of these colours is scarcely affected by the amount of original helium or by the assumed IMF. On this basis, we present a calibration of the HST UV two-colours (F152MF307MvsF170MF278M) diagrams in terms of cluster ages for the three above quoted metallicities.
Theoretical predictions for the time behavior of broad band colours (UBVK) appear in good agreement with data for LMC stellar clusters with known age, though with some open questions about the actual run of VK colours. We suggest that the combined use of HST UV colours and IR colours (VK in particular) should disentangle the metallicity-age effect in integrated colours of young stellar populations (). For this reason the NICMOS camera on board HST, particularly its F222M filter, is expected to be a powerful tool in interpreting the integrated colours of distant objects in term of age and metallicity.
An updated age calibration of C(1531) and C(1828) (Barbero et al. 1990) is also presented. The comparison with IUE data of LMC stellar clusters shows a very good agreement.
We note that MC stellar clusters represent a very fundamental test to check the reliability of population synthesis models. Unfortunately, age and metallicity determinations of single clusters available up to now are based, with few exceptions, on indirect calibrations. Thus, an extensive observational work with the goal of deriving accurate and precise CMD for a large sample of MC stellar cluster would be of invaluable help to check the reliability of population synthesis results.
- Acknowledgements.
We would like to thank Warren Hack at STScI for his help with FOC filters and for teaching us how to use the focsim package. This study has been financially supported by the Italian Ministery of University, Scientific Research and Technology (MURST) and the Italian Space Agency (ASI).
References
- Alexander D. R., Brocato E., Cassisi S., Castellani V., Ciacio F., Degl’Innocenti S., 1997, A&A 317, 90
- Arimoto N., Yoshii Y., 1986, A&A 164, 260
- Arimoto N., Yoshii Y., 1987, A&A 173, 23
- Barbaro G., Olivi F.M., 1986, in Spectral Evolution of Galaxies ed. Chiosi C., Renzini A., Reidel, p. 283
- Barbero J., Brocato E., Cassatella A., Castellani V., Geyer E. H.,1990, ApJ 351, 98
- Bencivenni D., Brocato E., Buonanno R., Castellani V., 1991 AJ, 102, 137
- Blöcker T., Schönberner G. 1991, A&A 244, L43
- Bressan A., Chiosi C., Fagotto F. 1994 ApJS 94, 64 (B94)
- Brocato E., Buonanno R., Castellani V., Walker A. R., 1989, ApJSS 71, 25
- Brocato E., Matteucci F., Mazzitelli I., Tornambè A., 1990, ApJ 349, 458
- Brocato E., Castellani V., 1993, ApJ 410, 99
- Brocato E., Castellani V., Di Giorgio A., 1993, AJ 105, 2192
- Brocato E., Castellani V. Piersimoni A., 1994 A&A 290, 59
- Brocato E., Castellani V. Piersimoni A., 1997, ApJ 491, 789
- Bruzual G.A., Charlot S., 1993, ApJ 405, 538
- Cassisi S., Castellani V., Straniero O., 1994, A&A 282, 753
- Caputo F., Chieffi A., Castellani V., Collados M., Martinez Roger C., 1990, AJ 99, 261
- Cassatella A., Barbero J., Brocato E., Castellani V., Geyer E.H. 1996 A&A 306, 125
- Castellani V., Chieffi A. Straniero O., 1992, ApJSS 78, 517
- Charlot S., Worthey G., Bressan A., 1996, ApJ 457, 625
- Chiosi C., Vallenari A., Bressan A., 1997, A&AS 121, 301
- Dorman B., Rood R.T., O’Connell R.W., 1993, ApJ 419, 596
- Dorman B., O’Connell R.W., Rood R.T., 1995, ApJ 442, 105
- Ferraro F.R., Fusi Pecci F., Testa V., Greggio L., Corsi C.E., Buonanno R., Terndrup D.M., Zinneker H., 1995, MNRAS 272, 391
- Gilmozzi R., Kinney E.K., Ewald S.P., Panagia N., Romaniello M., 1994, ApJ 435, L43
- Holtzman J. A., Faber S. M., Shaya E. J., et al., 1992, AJ, 103, 691
- Kurucz R.L. 1979a, ApJSS, 49, 1 (K79)
- Kurucz R.L. 1979b: in ”Problems of Calibration of Multicolour Photometric Systems”, ed. A.G. Davis Philip, Dudley Obs. Rep. No. 14, p. 363
- Kurucz R.L. 1992, in IAU Symposium 149 ”The Stellar Populations of Galaxies”, ed. B. Barbuy & A. Renzini (Dordrecht: Kluwer), 225
- Larson R.B. 1974, MNRAS 166, 585
- Leitherer C., Heckman T.M., 1995, ApJSS 96, 9
- Leitherer C., Alloin D., Alvensleben U., et al. 1996, PASP 108, 996
- Maeder A., Meynet G., 1989, A&A 210, 155
- Maeder A., Meynet G., 1991, A&AS 89, 451
- Renzini A., Buzzoni A. 1986, in Spectral Evolution of Galaxies eds. Chiosi C., Renzini A., Reidel, p. 195
- Renzini A. 1992, in The Stellar Population of Galaxies, ed. B. Barbuy and A. Renzini, Dordrecht: Kluwer, p. 325
- Rocca-Volmerange B., Guiderdoni B., 1987, A&A 175, 15
- Salpeter E. E., 1955, ApJ 121, 161
- Searle L., Wilkinson A., Bagnuolo W.G., 1980, ApJ 239, 803
- Straniero O., Chieffi A., 1991, ApJSS 76, 525
- Stothers R. B., Chin C., 1992, ApJ 390, 136
- Schweizer F., Miller B.W., Whitmore B. C., Fall S.M., 1996, AJ 112, 1839
- Tinsley B.M., 1980, ApJ 243, 41
- Vazdekis A., Casuso E., Peletier R., Beckman J.E., 1996, ApJSS 106,307
- Yi S., Demarque P., Oemler A. Jr., 1995, PASP 107, 273
- Worthey G., 1994, ApJSS 95, 107
| age (Myr) | MTO | Vtot | F152m-V | F170m-V | F253m-V | F278m-V | f307m-V | f480lp-V | f606w-V |
|---|---|---|---|---|---|---|---|---|---|
| 8 | 19.74 | -11.140.07 | -2.660.05 | -2.450.05 | -1.710.05 | -1.410.05 | -1.130.04 | -0.040.01 | -0.240.01 |
| 10 | 16.07 | -10.830.09 | -2.580.10 | -2.380.10 | -1.650.10 | -1.370.10 | -1.110.10 | -0.050.01 | -0.220.03 |
| 15 | 12.20 | -10.670.13 | -2.210.13 | -2.020.13 | -1.340.13 | -1.090.12 | -0.880.11 | -0.080.01 | -0.110.01 |
| 20 | 10.31 | -10.410.07 | -2.170.06 | -1.980.05 | -1.330.05 | -1.110.05 | -0.900.04 | -0.090.01 | -0.100.02 |
| 25 | 9.08 | -10.330.06 | -1.950.06 | -1.760.06 | -1.120.06 | -0.910.06 | -0.730.05 | -0.080.00 | -0.110.01 |
| 30 | 8.22 | -10.180.07 | -1.800.05 | -1.620.05 | -0.990.05 | -0.810.05 | -0.640.04 | -0.090.00 | -0.090.01 |
| 50 | 6.42 | -9.770.05 | -1.530.05 | -1.370.05 | -0.770.05 | -0.630.05 | -0.500.04 | -0.080.01 | -0.100.01 |
| 70 | 5.52 | -9.590.05 | -1.270.03 | -1.120.03 | -0.550.03 | -0.450.03 | -0.350.02 | -0.080.00 | -0.100.01 |
| 100 | 4.73 | -9.370.04 | -0.970.03 | -0.840.03 | -0.300.03 | -0.230.03 | -0.180.03 | -0.070.01 | -0.100.01 |
| 150 | 4.01 | -9.100.03 | -0.620.03 | -0.510.03 | -0.010.03 | 0.020.03 | 0.020.02 | -0.070.00 | -0.110.01 |
| 200 | 3.60 | -8.860.03 | -0.400.02 | -0.310.02 | 0.160.02 | 0.170.02 | 0.140.02 | -0.070.00 | -0.110.01 |
| 300 | 3.09 | -8.570.02 | 0.060.02 | 0.100.02 | 0.510.02 | 0.450.02 | 0.350.02 | -0.070.00 | -0.110.00 |
| 400 | 2.78 | -8.350.02 | 0.490.02 | 0.450.02 | 0.780.02 | 0.660.02 | 0.500.02 | -0.060.00 | -0.120.01 |
| 500 | 2.56 | -8.190.02 | 0.850.02 | 0.780.02 | 1.000.02 | 0.810.02 | 0.590.02 | -0.050.00 | -0.140.01 |
| 600 | 2.40 | -8.070.01 | 1.130.01 | 1.080.01 | 1.190.01 | 0.940.01 | 0.670.01 | -0.040.00 | -0.150.00 |
| 800 | 2.16 | -7.880.02 | 1.440.01 | 1.540.02 | 1.520.02 | 1.170.02 | 0.810.01 | -0.030.00 | -0.180.00 |
| 1000 | 2.00 | -7.820.02 | 1.630.01 | 1.930.02 | 1.870.02 | 1.430.02 | 0.980.01 | -0.010.01 | -0.220.00 |
| 1100 | 1.93 | -7.760.02 | 1.690.01 | 2.060.02 | 2.000.02 | 1.520.02 | 1.040.02 | -0.010.00 | -0.230.00 |
| 1500 | 1.74 | -7.360.03 | 1.740.02 | 2.250.02 | 2.170.03 | 1.580.03 | 1.040.02 | -0.010.00 | -0.240.00 |
| 1700 | 1.67 | -7.290.03 | 1.790.02 | 2.380.02 | 2.320.03 | 1.690.03 | 1.110.02 | -0.000.00 | -0.250.00 |
| 2000 | 1.58 | -7.120.02 | 1.840.01 | 2.510.01 | 2.480.02 | 1.790.02 | 1.170.02 | 0.000.00 | -0.250.00 |
| 3000 | 1.38 | -6.890.03 | 1.950.02 | 2.750.02 | 2.810.03 | 2.030.03 | 1.320.03 | 0.010.00 | -0.270.01 |
| 4000 | 1.27 | -6.680.03 | 2.000.02 | 2.850.02 | 2.950.03 | 2.130.03 | 1.380.02 | 0.020.00 | -0.280.01 |
| 5000 | 1.18 | -6.550.04 | 2.040.02 | 2.920.03 | 3.090.04 | 2.240.04 | 1.460.04 | 0.020.00 | -0.290.01 |
| age (Myr) | Vtot | U-V | B-V | V-R | V-I | V-J | V-K | V-L |
|---|---|---|---|---|---|---|---|---|
| 8 | -11.14 | -0.42 0.04 | 0.27 0.03 | 0.45 0.02 | 0.96 0.04 | 2.01 0.05 | 3.11 0.05 | 3.16 0.05 |
| 10 | -10.83 | -0.43 0.10 | 0.22 0.07 | 0.41 0.05 | 0.89 0.09 | 1.90 0.13 | 2.98 0.14 | 3.03 0.15 |
| 15 | -10.67 | -0.38 0.07 | 0.10 0.03 | 0.22 0.02 | 0.50 0.05 | 1.19 0.09 | 2.04 0.11 | 2.09 0.21 |
| 20 | -10.41 | -0.41 0.03 | 0.08 0.03 | 0.20 0.03 | 0.46 0.06 | 1.10 0.12 | 1.89 0.15 | 1.93 0.15 |
| 25 | -10.33 | -0.29 0.03 | 0.12 0.02 | 0.21 0.02 | 0.47 0.04 | 1.08 0.07 | 1.81 0.10 | 1.85 0.10 |
| 30 | -10.18 | -0.27 0.02 | 0.09 0.01 | 0.19 0.01 | 0.42 0.02 | 1.00 0.05 | 1.75 0.06 | 1.78 0.07 |
| 50 | -9.77 | -0.16 0.03 | 0.14 0.02 | 0.20 0.02 | 0.44 0.03 | 0.98 0.06 | 1.64 0.09 | 1.68 0.09 |
| 70 | -9.59 | -0.08 0.02 | 0.16 0.01 | 0.20 0.01 | 0.43 0.03 | 0.94 0.06 | 1.54 0.10 | 1.57 0.10 |
| 100 | -9.37 | 0.01 0.02 | 0.18 0.01 | 0.20 0.01 | 0.43 0.03 | 0.92 0.06 | 1.50 0.10 | 1.53 0.10 |
| 150 | -9.10 | 0.11 0.02 | 0.21 0.01 | 0.21 0.01 | 0.45 0.02 | 0.92 0.06 | 1.49 0.10 | 1.51 0.10 |
| 200 | -8.86 | 0.17 0.01 | 0.21 0.01 | 0.21 0.01 | 0.44 0.02 | 0.91 0.05 | 1.44 0.08 | 1.47 0.08 |
| 300 | -8.57 | 0.30 0.01 | 0.24 0.01 | 0.22 0.01 | 0.46 0.02 | 0.92 0.05 | 1.44 0.09 | 1.47 0.10 |
| 400 | -8.35 | 0.40 0.01 | 0.29 0.01 | 0.24 0.01 | 0.50 0.01 | 0.98 0.03 | 1.50 0.04 | 1.52 0.05 |
| 500 | -8.19 | 0.47 0.02 | 0.34 0.01 | 0.26 0.01 | 0.53 0.02 | 1.01 0.04 | 1.52 0.06 | 1.54 0.06 |
| 600 | -8.07 | 0.54 0.01 | 0.40 0.01 | 0.30 0.01 | 0.59 0.01 | 1.10 0.03 | 1.62 0.05 | 1.65 0.05 |
| 800 | -7.88 | 0.66 0.02 | 0.49 0.01 | 0.35 0.01 | 0.68 0.01 | 1.24 0.02 | 1.79 0.03 | 1.82 0.03 |
| 1000 | -7.82 | 0.82 0.01 | 0.58 0.01 | 0.41 0.01 | 0.79 0.01 | 1.43 0.02 | 2.07 0.02 | 2.10 0.02 |
| 1100 | -7.76 | 0.88 0.02 | 0.61 0.01 | 0.43 0.01 | 0.83 0.01 | 1.51 0.03 | 2.17 0.04 | 2.21 0.04 |
| 1500 | -7.36 | 0.88 0.02 | 0.63 0.01 | 0.45 0.01 | 0.86 0.02 | 1.55 0.03 | 2.26 0.05 | 2.29 0.05 |
| 1700 | -7.29 | 0.94 0.02 | 0.66 0.01 | 0.46 0.01 | 0.88 0.01 | 1.60 0.03 | 2.31 0.05 | 2.35 0.05 |
| 2000 | -7.12 | 0.99 0.01 | 0.69 0.01 | 0.47 0.00 | 0.90 0.01 | 1.63 0.02 | 2.35 0.04 | 2.38 0.04 |
| 3000 | -6.89 | 1.13 0.03 | 0.75 0.01 | 0.51 0.01 | 0.98 0.02 | 1.76 0.03 | 2.53 0.05 | 2.57 0.06 |
| 4000 | -6.68 | 1.19 0.02 | 0.78 0.01 | 0.53 0.01 | 1.00 0.02 | 1.80 0.04 | 2.59 0.06 | 2.63 0.06 |
| 5000 | -6.55 | 1.26 0.04 | 0.81 0.02 | 0.54 0.01 | 1.03 0.02 | 1.84 0.05 | 2.64 0.07 | 2.68 0.07 |
| age (Myr) | MTO | Vtot | F152m-V | F170m-V | F253m-V | F278m-V | f307m-V | f480lp-V | f606w-V |
|---|---|---|---|---|---|---|---|---|---|
| 30 | 7.91 | -10.33 0.08 | -1.96 0.07 | -1.77 0.07 | -1.13 0.06 | -0.94 0.06 | -0.76 0.05 | -0.10 0.01 | -0.05 0.01 |
| 50 | 6.05 | -10.06 0.07 | -1.57 0.06 | -1.39 0.06 | -0.78 0.05 | -0.63 0.05 | -0.49 0.04 | -0.10 0.00 | -0.05 0.00 |
| 70 | 5.15 | -9.83 0.07 | -1.34 0.05 | -1.17 0.05 | -0.59 0.05 | -0.45 0.05 | -0.34 0.04 | -0.09 0.00 | -0.06 0.01 |
| 100 | 4.39 | -9.54 0.04 | -1.14 0.04 | -0.99 0.04 | -0.43 0.04 | -0.32 0.04 | -0.24 0.03 | -0.09 0.00 | -0.08 0.00 |
| 150 | 3.69 | -9.24 0.04 | -0.88 0.03 | -0.74 0.03 | -0.22 0.03 | -0.15 0.03 | -0.10 0.03 | -0.08 0.01 | -0.10 0.01 |
| 200 | 3.27 | -9.06 0.02 | -0.66 0.02 | -0.52 0.01 | -0.04 0.01 | 0.00 0.01 | 0.01 0.01 | -0.07 0.00 | -0.10 0.00 |
| 300 | 2.77 | -8.76 0.01 | -0.34 0.02 | -0.22 0.02 | 0.22 0.02 | 0.21 0.02 | 0.17 0.02 | -0.07 0.00 | -0.10 0.01 |
| 400 | 2.47 | -8.53 0.01 | -0.08 0.02 | 0.02 0.02 | 0.41 0.02 | 0.37 0.02 | 0.29 0.01 | -0.06 0.01 | -0.11 0.00 |
| 500 | 2.27 | -8.37 0.01 | 0.15 0.01 | 0.23 0.01 | 0.58 0.02 | 0.51 0.01 | 0.39 0.01 | -0.06 0.00 | -0.12 0.00 |
| 600 | 2.12 | -8.31 0.02 | 0.38 0.01 | 0.43 0.01 | 0.75 0.01 | 0.64 0.01 | 0.48 0.01 | -0.05 0.00 | -0.13 0.00 |
| 800 | 1.90 | -8.31 0.01 | 0.93 0.01 | 0.96 0.01 | 1.19 0.01 | 1.00 0.01 | 0.75 0.00 | -0.03 0.00 | -0.18 0.00 |
| 1000 | 1.75 | -8.00 0.02 | 1.12 0.02 | 1.11 0.02 | 1.25 0.02 | 1.03 0.02 | 0.77 0.02 | -0.03 0.00 | -0.18 0.00 |
| 2000 | 1.38 | -7.47 0.03 | 1.58 0.02 | 1.79 0.03 | 1.71 0.04 | 1.31 0.03 | 0.92 0.03 | -0.01 0.00 | -0.22 0.00 |
| 3000 | 1.20 | -7.29 0.03 | 1.71 0.02 | 2.10 0.03 | 1.98 0.03 | 1.47 0.03 | 1.00 0.03 | -0.00 0.00 | -0.24 0.01 |
| 5000 | 1.05 | -7.03 0.04 | 1.82 0.03 | 2.41 0.03 | 2.28 0.04 | 1.66 0.04 | 1.11 0.04 | 0.01 0.01 | -0.26 0.01 |
| age (Myr) | Vtot | U-V | B-V | V-R | V-I | V-J | V-K | V-L |
|---|---|---|---|---|---|---|---|---|
| 30 | -10.33 | -0.400.02 | 0.010.01 | 0.100.01 | 0.230.02 | 0.600.05 | 1.150.08 | 1.180.08 |
| 50 | -10.06 | -0.240.02 | 0.050.01 | 0.110.01 | 0.250.02 | 0.580.04 | 1.040.05 | 1.060.06 |
| 70 | -9.83 | -0.130.03 | 0.090.02 | 0.130.01 | 0.290.03 | 0.630.06 | 1.060.09 | 1.090.09 |
| 100 | -9.54 | -0.050.02 | 0.130.01 | 0.150.00 | 0.330.01 | 0.690.03 | 1.120.04 | 1.140.04 |
| 150 | -9.24 | 0.050.02 | 0.190.01 | 0.190.01 | 0.400.01 | 0.790.02 | 1.220.03 | 1.240.03 |
| 200 | -9.06 | 0.100.01 | 0.200.01 | 0.190.01 | 0.400.01 | 0.790.01 | 1.190.02 | 1.210.02 |
| 300 | -8.76 | 0.190.01 | 0.230.01 | 0.210.01 | 0.430.01 | 0.830.02 | 1.240.02 | 1.250.02 |
| 400 | -8.53 | 0.270.01 | 0.250.01 | 0.220.00 | 0.450.01 | 0.870.01 | 1.290.02 | 1.310.02 |
| 500 | -8.37 | 0.340.01 | 0.280.01 | 0.230.00 | 0.480.01 | 0.920.01 | 1.360.01 | 1.380.01 |
| 600 | -8.31 | 0.410.01 | 0.310.01 | 0.250.00 | 0.520.01 | 0.990.01 | 1.460.01 | 1.480.01 |
| 800 | -8.31 | 0.630.01 | 0.450.01 | 0.340.00 | 0.690.00 | 1.290.01 | 1.890.01 | 1.920.01 |
| 1000 | -8.00 | 0.650.02 | 0.470.01 | 0.360.01 | 0.720.02 | 1.350.03 | 1.980.05 | 2.010.05 |
| 2000 | -7.47 | 0.790.02 | 0.600.01 | 0.420.01 | 0.830.02 | 1.530.04 | 2.220.06 | 2.250.06 |
| 3000 | -7.29 | 0.870.03 | 0.650.01 | 0.450.01 | 0.880.02 | 1.600.05 | 2.310.07 | 2.350.07 |
| 5000 | -7.03 | 0.970.04 | 0.700.02 | 0.480.01 | 0.940.03 | 1.700.06 | 2.450.09 | 2.490.09 |
| age (Myr) | MTO | Vtot | F152m-V | F170m-V | F253m-V | F278m-V | f307m-V | f480lp-V | f606w-V |
|---|---|---|---|---|---|---|---|---|---|
| 30 | 7.61 | -10.040.07 | -2.530.04 | -2.340.04 | -1.680.03 | -1.450.03 | -1.230.02 | -0.140.00 | 0.020.00 |
| 50 | 5.78 | -9.810.06 | -2.190.04 | -2.000.04 | -1.370.04 | -1.170.03 | -0.980.03 | -0.130.00 | 0.010.00 |
| 70 | 4.89 | -9.680.04 | -1.900.02 | -1.740.02 | -1.130.02 | -0.950.02 | -0.790.01 | -0.120.00 | -0.000.00 |
| 100 | 4.13 | -9.520.04 | -1.620.02 | -1.460.02 | -0.890.02 | -0.740.02 | -0.600.02 | -0.120.00 | -0.010.00 |
| 150 | 3.44 | -9.320.04 | -1.280.02 | -1.130.01 | -0.610.02 | -0.490.01 | -0.380.01 | -0.110.00 | -0.020.00 |
| 200 | 3.02 | -9.210.03 | -0.990.02 | -0.860.02 | -0.370.02 | -0.280.02 | -0.200.02 | -0.100.00 | -0.030.00 |
| 300 | 2.53 | -8.970.02 | -0.600.02 | -0.500.01 | -0.080.02 | -0.030.01 | 0.000.01 | -0.090.00 | -0.050.00 |
| 400 | 2.25 | -8.770.02 | -0.350.01 | -0.250.01 | 0.120.01 | 0.140.01 | 0.120.01 | -0.080.00 | -0.070.00 |
| 500 | 2.06 | -8.640.02 | -0.150.01 | -0.030.01 | 0.290.01 | 0.270.01 | 0.220.01 | -0.070.00 | -0.090.00 |
| 600 | 1.92 | -8.660.02 | 0.080.01 | 0.220.02 | 0.520.01 | 0.450.01 | 0.350.01 | -0.060.00 | -0.120.00 |
| 800 | 1.73 | -8.470.03 | 0.350.02 | 0.500.03 | 0.810.03 | 0.710.03 | 0.550.02 | -0.040.00 | -0.160.01 |
| 1000 | 1.60 | -8.200.04 | 0.430.03 | 0.560.04 | 0.840.04 | 0.740.03 | 0.580.03 | -0.040.00 | -0.160.01 |
| 2000 | 1.27 | -7.790.04 | 1.020.03 | 1.110.03 | 1.210.03 | 1.000.03 | 0.750.02 | -0.030.00 | -0.190.00 |
| 3000 | 1.15 | -7.630.05 | 1.320.03 | 1.410.05 | 1.400.05 | 1.120.04 | 0.830.03 | -0.020.00 | -0.210.01 |
| 5000 | 0.99 | -7.410.03 | 1.540.02 | 1.770.03 | 1.620.03 | 1.240.03 | 0.870.02 | -0.010.00 | -0.220.00 |
| age (Myr) | Vtot | U-V | B-V | V-R | V-I | V-J | V-K | V-L |
|---|---|---|---|---|---|---|---|---|
| 30 | -10.04 | -0.730.01 | -0.140.01 | -0.050.00 | -0.110.01 | -0.270.02 | -0.310.04 | -0.350.05 |
| 50 | -9.81 | -0.580.02 | -0.100.01 | -0.030.01 | -0.070.01 | -0.170.03 | -0.170.04 | -0.190.04 |
| 70 | -9.68 | -0.460.01 | -0.060.01 | -0.000.01 | 0.000.01 | 0.010.03 | 0.120.05 | 0.110.05 |
| 100 | -9.52 | -0.350.01 | -0.030.01 | 0.020.01 | 0.050.01 | 0.100.03 | 0.240.04 | 0.230.05 |
| 150 | -9.32 | -0.220.01 | 0.000.01 | 0.040.01 | 0.100.01 | 0.220.02 | 0.400.04 | 0.410.04 |
| 200 | -9.21 | -0.110.01 | 0.040.00 | 0.070.00 | 0.150.01 | 0.320.02 | 0.530.02 | 0.540.02 |
| 300 | -8.97 | 0.030.00 | 0.100.00 | 0.110.00 | 0.230.01 | 0.450.01 | 0.700.02 | 0.710.02 |
| 400 | -8.77 | 0.100.01 | 0.150.00 | 0.140.00 | 0.290.01 | 0.550.01 | 0.820.02 | 0.840.02 |
| 500 | -8.64 | 0.170.01 | 0.210.00 | 0.180.00 | 0.380.01 | 0.700.01 | 1.010.02 | 1.030.02 |
| 600 | -8.66 | 0.290.01 | 0.290.01 | 0.240.00 | 0.500.01 | 0.930.02 | 1.350.03 | 1.370.03 |
| 800 | -8.47 | 0.470.02 | 0.400.01 | 0.320.01 | 0.650.02 | 1.220.03 | 1.760.04 | 1.790.05 |
| 1000 | -8.20 | 0.490.02 | 0.400.01 | 0.320.01 | 0.650.02 | 1.220.03 | 1.780.05 | 1.810.05 |
| 2000 | -7.79 | 0.630.02 | 0.490.01 | 0.370.01 | 0.740.01 | 1.360.03 | 1.960.03 | 1.990.03 |
| 3000 | -7.63 | 0.690.03 | 0.550.02 | 0.400.01 | 0.790.02 | 1.440.04 | 2.080.05 | 2.110.05 |
| 5000 | -7.41 | 0.730.02 | 0.590.01 | 0.420.01 | 0.830.02 | 1.500.03 | 2.150.04 | 2.180.04 |
| age (Myr) | MTO | Vtot | F152m-V | F170m-V | F253m-V | F278m-V | f307m-V | f480lp-V | f606w-V |
|---|---|---|---|---|---|---|---|---|---|
| 30 | 8.35 | -9.910.08 | -2.580.04 | -2.390.04 | -1.720.04 | -1.490.03 | -1.270.03 | -0.140.00 | 0.020.00 |
| 50 | 6.30 | -9.790.05 | -2.170.03 | -1.980.03 | -1.340.03 | -1.140.03 | -0.950.03 | -0.120.00 | -0.000.01 |
| 70 | 5.32 | -9.650.05 | -1.900.02 | -1.730.02 | -1.120.01 | -0.940.01 | -0.770.01 | -0.120.00 | -0.010.01 |
| 100 | 4.49 | -9.480.04 | -1.620.02 | -1.460.03 | -0.890.02 | -0.730.02 | -0.590.02 | -0.110.00 | -0.020.01 |
| 150 | 3.72 | -9.300.04 | -1.280.03 | -1.140.02 | -0.610.02 | -0.490.02 | -0.380.02 | -0.100.01 | -0.040.01 |
| 200 | 3.27 | -9.160.03 | -1.030.02 | -0.890.02 | -0.400.01 | -0.300.01 | -0.220.01 | -0.100.00 | -0.050.01 |
| 300 | 2.75 | -8.920.03 | -0.650.03 | -0.540.03 | -0.100.02 | -0.040.02 | -0.000.02 | -0.090.00 | -0.060.00 |
| 400 | 2.44 | -8.730.03 | -0.410.03 | -0.300.02 | 0.090.02 | 0.110.02 | 0.110.02 | -0.080.00 | -0.080.01 |
| 500 | 2.23 | -8.590.02 | -0.210.02 | -0.110.02 | 0.230.02 | 0.220.02 | 0.190.01 | -0.080.01 | -0.090.00 |
| 600 | 2.07 | -8.560.03 | -0.010.02 | 0.110.02 | 0.410.02 | 0.360.02 | 0.280.01 | -0.070.00 | -0.110.00 |
| 800 | 1.86 | -8.380.02 | 0.270.02 | 0.410.02 | 0.710.02 | 0.620.01 | 0.490.01 | -0.040.00 | -0.150.01 |
| 1000 | 1.71 | -8.180.03 | 0.410.02 | 0.540.02 | 0.820.03 | 0.710.02 | 0.560.02 | -0.040.00 | -0.160.00 |
| 2000 | 1.35 | -7.690.04 | 0.950.03 | 1.020.04 | 1.130.04 | 0.930.03 | 0.700.03 | -0.030.00 | -0.180.01 |
| 3000 | 1.22 | -7.510.04 | 1.280.02 | 1.350.03 | 1.310.03 | 1.040.03 | 0.760.02 | -0.020.00 | -0.200.01 |
| 5000 | 1.07 | -7.210.04 | 1.510.02 | 1.710.03 | 1.540.03 | 1.160.03 | 0.810.02 | -0.010.00 | -0.220.01 |
| age (Myr) | Vtot | U-V | B-V | V-R | V-I | V-J | V-K | V-L |
|---|---|---|---|---|---|---|---|---|
| 30 | -9.91 | -0.750.02 | -0.140.01 | -0.050.01 | -0.120.01 | -0.290.01 | -0.330.02 | -0.380.02 |
| 50 | -9.79 | -0.550.02 | -0.080.01 | -0.000.01 | -0.000.02 | 0.020.06 | 0.190.13 | 0.180.13 |
| 70 | -9.65 | -0.440.01 | -0.050.01 | 0.020.01 | 0.050.02 | 0.130.06 | 0.340.12 | 0.340.12 |
| 100 | -9.48 | -0.320.02 | -0.010.01 | 0.040.01 | 0.110.03 | 0.260.07 | 0.540.11 | 0.550.12 |
| 150 | -9.30 | -0.200.01 | 0.030.01 | 0.070.01 | 0.160.02 | 0.360.05 | 0.650.08 | 0.670.09 |
| 200 | -9.16 | -0.100.01 | 0.060.01 | 0.090.01 | 0.210.01 | 0.450.02 | 0.780.03 | 0.800.03 |
| 300 | -8.92 | 0.040.01 | 0.120.01 | 0.130.01 | 0.280.01 | 0.590.03 | 0.960.04 | 0.980.04 |
| 400 | -8.73 | 0.120.01 | 0.160.01 | 0.150.01 | 0.330.01 | 0.660.03 | 1.030.06 | 1.050.06 |
| 500 | -8.59 | 0.170.01 | 0.190.01 | 0.170.01 | 0.370.01 | 0.700.03 | 1.070.05 | 1.090.05 |
| 600 | -8.56 | 0.240.01 | 0.250.01 | 0.220.01 | 0.440.01 | 0.830.02 | 1.230.03 | 1.250.04 |
| 800 | -8.38 | 0.420.01 | 0.370.01 | 0.300.01 | 0.620.01 | 1.150.02 | 1.690.02 | 1.720.02 |
| 1000 | -8.18 | 0.490.02 | 0.400.01 | 0.320.01 | 0.650.01 | 1.220.02 | 1.780.04 | 1.820.04 |
| 2000 | -7.69 | 0.590.02 | 0.470.01 | 0.350.01 | 0.710.02 | 1.320.04 | 1.920.05 | 1.960.05 |
| 3000 | -7.51 | 0.630.02 | 0.520.01 | 0.380.01 | 0.750.02 | 1.380.03 | 1.990.05 | 2.020.05 |
| 5000 | -7.21 | 0.690.02 | 0.570.01 | 0.410.01 | 0.810.01 | 1.450.03 | 2.080.04 | 2.110.04 |
| age (Myr) | 1531 | 1828 |
|---|---|---|
| 8 | -1.97 | -1.26 |
| 10 | -1.90 | -1.21 |
| 15 | -1.78 | -1.12 |
| 20 | -1.70 | -1.07 |
| 25 | -1.64 | -1.04 |
| 30 | -1.55 | -1.00 |
| 50 | -1.40 | -0.91 |
| 70 | -1.25 | -0.84 |
| 100 | -1.08 | -0.76 |
| 150 | -0.86 | -0.67 |
| 200 | -0.68 | -0.60 |
| 300 | -0.21 | -0.43 |
| 400 | 0.47 | -0.25 |
| 500 | 1.59 | 0.01 |
| 600 | 2.53 | 0.19 |
| 800 | 4.74 | 0.71 |
| 1000 | 6.54 | 1.18 |
| 1100 | 7.21 | 1.38 |
| 1500 | 8.84 | 2.12 |
| 1700 | 9.45 | 2.51 |
| 2000 | 10.11 | 3.03 |
| 3000 | 10.71 | 3.59 |
| 4000 | 11.71 | 4.35 |
| 5000 | 12.12 | 4.70 |
| Z | Z | Z | ||||
|---|---|---|---|---|---|---|
| age (Myr) | C1111C1 is the F152MF307M HST colour | C2222C2 is the F170MF278M HST colour | C | C | C | |
| 8 | -1.53 | -1.05 | ||||
| 10 | -1.47 | -1.00 | ||||
| 15 | -1.34 | -0.92 | ||||
| 20 | -1.26 | -0.88 | ||||
| 25 | -1.21 | -0.85 | ||||
| 30 | -1.15 | -0.81 | -1.20 | -0.84 | -1.29 | -0.89 |
| 50 | -1.02 | -0.74 | -1.08 | -0.77 | -1.21 | -0.84 |
| 70 | -0.92 | -0.68 | -1.00 | -0.72 | -1.12 | -0.78 |
| 100 | -0.79 | -0.61 | -0.90 | -0.66 | -1.01 | -0.72 |
| 150 | -0.64 | -0.53 | -0.78 | -0.59 | -0.90 | -0.65 |
| 200 | -0.54 | -0.48 | -0.67 | -0.52 | -0.79 | -0.58 |
| 300 | -0.29 | -0.34 | -0.50 | -0.43 | -0.60 | -0.47 |
| 400 | -0.01 | -0.21 | -0.37 | -0.35 | -0.47 | -0.38 |
| 500 | 0.26 | -0.03 | -0.24 | -0.28 | -0.37 | -0.30 |
| 600 | 0.45 | 0.14 | -0.10 | -0.20 | -0.27 | -0.24 |
| 800 | 0.63 | 0.37 | 0.18 | -0.03 | -0.20 | -0.21 |
| 1000 | 0.65 | 0.50 | 0.36 | 0.09 | -0.14 | -0.17 |
| 1100 | 0.65 | 0.54 | ||||
| 1500 | 0.70 | 0.67 | ||||
| 1700 | 0.69 | 0.70 | ||||
| 2000 | 0.67 | 0.72 | 0.67 | 0.48 | 0.27 | 0.11 |
| 3000 | 0.63 | 0.72 | 0.71 | 0.63 | 0.49 | 0.29 |
| 4000 | 0.61 | 0.72 | ||||
| 5000 | 0.58 | 0.69 | 0.71 | 0.75 | 0.67 | 0.54 |