Faint star counts with HST
Abstract
We describe a program of star counts in the range made with the WFPC cameras aboard the Hubble Space Telescope. Red () stars at these magnitudes are primarily disk and spheroid M dwarfs. The stars are found both on dedicated images as part of the parallel program and by using appropriate archive data. We measure the faint end of the luminosity functions of the disk and spheroid (i.e. stellar halo). We measure the low mass end of the mass function and show that M dwarfs do not dominate the total disk or spheroid mass. We place strong band constraints on the amount of halo dark matter in the form of low mass stars (such as M dwarfs or cool white dwarfs). The disk and spheroid contribute only a minor amount of optical depth toward the Magellanic clouds.
Tuorla Observatory, Piikkiö, Finland
Department of Physics and Astronomy, Ohio State University, Columbus, USA
Institute for Advanced Study, Princeton, USA
1. Introduction
The Hubble Space Telescope (HST) has revitalised the classical field of star counting, since it allows us to separate stars from galaxies more than four magnitudes deeper than is possible from the ground. We have used HST to search for faint red stars. There are four topics we address in searching for such stars. 1) how much mass do M stars contribute to the disk and spheroid? 2) does the Mass Function of the disk or spheroid rise at the faintest measurable magnitude, possibly indicating large numbers of brown dwarfs beyond the Hydrogen burning limit? 3) is the putative Galactic dark halo composed of faint M dwarfs or cool white dwarfs? 4) how much do faint disk and spheroid M dwarfs contribute to the microlensing signal seen toward the Magallenic clouds?
2. Observations
Our stars our found on WFPC/WFPC2 images taken with HST in the F606W and F814W filters. Part of the data is obtained under the Guaranteed Time Observer (GTO) “low latitude parallel program” for which Ed Groth is Principal Investigator. The remainder is obtained by searching the Hubble Archived Exposures Catalog (AEC111http://stdatu.stsci.edu/aec.html) for fields for which there are at least 2 exposures in both filters F606W and F814W. At present (Oct 1998) our database consists of 17 fields obtained under the parallel program, the Hubble Deep Field (HDF), the “Groth Strip” (28 contiguous fields) and 106 randomly collected fields from the Archive. Our data base is increasing by a field every two or three weeks. The distribution of the fields in Galactic coordinates is shown in figure 1. We only use fields above 18 degrees Galactic latitude to avoid the uncertainties of reddening corrections at lower latitude. The fields cover 4.4 square arc-minutes each at a scale of 0.1 arcsec/pixel. Fields near globular clusters, clusters of galaxies, dwarf satellites of the Milky Way and the LMC/SMC are not used.

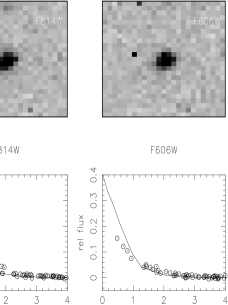
The images are stacked and cleaned of the large number of cosmic rays, using a technique which treats each pixel individually, since HST’s pointing and tracking accuracy is very precise (Bahcall et al 1994). Although two images in a filter are sufficient to remove most cosmics, three images or more is best. In a small number of cases cosmics hitting the same pixel on both images can conspire to produce a stellar like object in the cleaned image, but such cases are removed by comparison of the cleaned and the original images. A typical star (, ) is shown in figure 2. At high Galactic latitude () there are only a few stars per field, so they must be separated from the very numerous galaxies carefully. The canonical stellar profile was found by determining the mean radial profile of over 30 stars found on a very low latitude () image which is dominated by stars. Tests showed that the stellar profile is not dependent on location on the chips, so a mean profile was adopted for comparison.
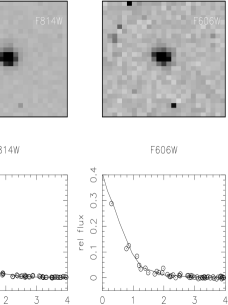
A typical compact galaxy () is seen in figure 3. This is a particularly compact example; most of the galaxies are considerably larger. A small number of almost unresolved sources turned up, in particular in the HDF. These were invariably blue (), and so had no impact on our search for red stars. However, their nature remains unclear: they may be small (less than 1 kpc sized) star-burst regions (Elson, Santiago and Gilmore 1997).
Aperture photometry was performed on the stars, and F606W and F814W magnitudes were transformed to and magnitudes. The transformations to and were determined by convolving the filter responses of F606W, F814W, , and individual chip response curves to stars in the library of Gunn and Stryker (1983), since no empirical calibrations were available. A similar technique due to Holtzman et al (1995, 1998) yielded similar, although not identical transformations. A source of concern was that the reddest stars in the library were giants and not dwarfs. Fortunately, an empirical transformation has become available very recently (Salim and Gould 1998), who obtained ground based and colours of red stars in the Groth strip. Both the Bahcall et al and the Holtzman et al calibrations were found to need systematic corrections at the 0.1 magnitude level, depending somewhat on colour. This impacts in a minor way our early results for the luminosity and mass functions of M stars.
Binaries are essentially unresolved in this program, since the stars are typically 2 kpc distant. Binaries would be detected only for separations of greater than 600 pc, at most a few percent of systems.
We selected stars for which the signal to noise (S/N) based on counts in an aperture of radius 4 pixels. At S/N , sources clearly become too noisy to separate into stars and galaxies. For fitting the mass and luminosities functions we further restricted ourselves to stars 0.3 magnitudes brighter than the magnitude limit set for each field by the S/N = 12.0 criterion. Our stellar/galaxian separation has been tested externally, at least for the brighter sources, by Keck spectroscopy of 100 sources in the HDF. We predicted the 4 stars and 96 galaxies in this sample correctly, as part of the Caltech Redshift Challenge (Hogg et al 1998). The S/N of these “bright” () stars was very high, however, well above the HDF magnitude limit at .
3. I band limits on baryonic dark matter candidates
The Hubble Deep Field (HDF) was a superbly useful field for star counting. Three groups found the same 18 stars in the HDF (Flynn, Gould and Bahcall, 1996; Elson, Santiago and Gilmore 1996; Mendez et al 1996). Flynn, Gould and Bahcall (1996) analysed the colour distribution of these 18 stars – no stars were found redder than within 1.67 magnitudes of the magnitude limit at . This places strong limits on the band luminosity of stellar objects which could form all or part of the Galactic dark halo. In particular, less than 1% of the dark halo could be composed of M dwarfs if they have the same band luminosity as disk M dwarfs of the same colour/mass. Even stronger limits (i.e. much less than 1%) can be placed if the dwarfs are assumed to have band luminosities typical of theoretical models of metal poor stars (Graff and Freese 1996). Although less attractive than M dwarfs, another candidate for the halo dark matter is old, cool white dwarfs, in particular because the microlensing searches indicate a typical lens mass of about 0.5 . Such old white dwarfs might lie along a linear extrapolation of the sequence of old disk white dwarfs in the versus CMD (see e.g. Monet et al 1992) If so, then they would have to be at least two magnitudes fainter than the faintest () disk white dwarfs in order not to be seen in large numbers in the HDF. Such white dwarfs may not be red at all in which case they could actually be seen but unrecognised in HDF (Hansen 1998). More generally, Flynn, Gould and Bahcall (1996) develop an band limit to the amount of baryonic matter in the form of red () stars – see their Eqn 4.2.
HDF star counts can also be used to constrain the density of “intracluster” stars in the Local Group, i.e. outside the galaxies. Intracluster stars of this type have recently been identified in the Virgo cluster as Planetary Nebulae (Feldmeier, Ciardullo & Jacoby 1998). Local Group giants and subgiants and could be seen in HDF to a distance Mpc. In HDF there are no more than 2 such stars in the the outer 90% of the observed volume implying that their number density must be less than pc-3 at the 95% confidence level. This constrains the ratio of the densities of Local Group to Galactic spheroid stars to be less than 1/3000, about an order of magnitude lower than the limits obtained by Richstone et al. (1992).
4. Disk Luminosity Function and Mass Function
A useful field for illustrating our techniques in measuring the faint end of the luminosity function is the “Groth Strip”, a sequence of 28 contiguous fields at , (Rhodes et al 1997), for which star/galaxy separation was possible in the range . These fields were primarily taken for studying galaxy clustering, but their stellar content is particularly useful because we obtain a large number of red stars at a single position on the sky. In figure 4 we show the absolute magnitude versus vertical distance modulus of the stars, assuming that each star lies on the empirically well calibrated disk main sequence for M dwarfs of Monet et al (1992), .

These data are unique in constraining the total disk column of M dwarfs rigorously, since HST’s star/galaxy separation allows us to see all the M dwarfs along any line-of-sight well out into the Galactic spheroid, beyond the “top” of the disk, as a result of which Malmquist bias corrections are remarkably small. The disadvantage is that binaries are not resolved, so that the binary correction to the observed LF must be made on the basis of binary fractions in nearby M dwarfs. The results of an analysis of the Groth strip and 25 other fields (Gould et al 1997) show that the observed LF drops rapidly after peaking at . Vertical density distributions were fit to the M dwarf counts within 1 kpc, with a best description being a combination of a shorter scale height sech “thin disk” and larger scale height exp “intermediate component”, where pc and pc with relative fractions locally of 0.78 and 0.22 respectively. We note that these scale heights have no particular physical significance, since their relative normalisations and the scale heights are strongly anti-correlated. The important point is that the derived LF is insensitive to the model of the vertical distribution of the stars.
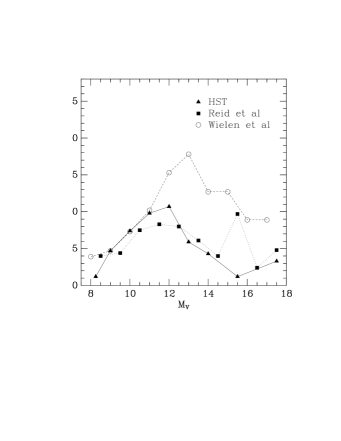
The observed LF drops rapidly below . We compare our LF with other (ground based) measurements of the LF in figure 5. These are all measured locally, whereas we see M dwarfs at distances of typically 2 kpc. Our LF is marginally inconsistent with the ground based LFs of Wielen et al (1983) and Reid et al (1995). Part of the difference is certainly due to a correction to the faint part of our LF for missing binaries. M dwarfs in the disk have about 10% binarity at the peak of the LF and about 50 % binarity at the faint end (Reid et al 1995, Gould et al 1995). Correcting with these numbers raises the falling part of the LF, although not by enough to make it flat at the faint end (Gould et al 1997).
The LF can be converted into a mass function. In the case of disk M dwarfs, this is relatively straight forward because good empirical mass-luminosity relations exist (Henry and McCarthy 1993). We find a falling MF in the range (Gould, Bahcall and Flynn 1997, figure 3). Although the binary correction at the faint end of the MF may be enough to raise the falling section so that it becomes flat, the evidence appears to be against the MF rising into the regime below the Hydrogen burning limit, suggesting that there are not a large number of brown dwarfs still to be found in the local disk. This is consistent with recent studies which have finally turned up the long sought free floating brown dwarfs in the nearby disk, although they are unlikely to dominate the disk mass (Fuchs, Jahreiß and Flynn 1998). We estimate from our MF the total contribution of M dwarfs to the disk mass as 12 pc-2: M dwarfs contribute only modestly to the total observed disk column density of 40 pc-2, of which about 13 pc-2 is in gas and 15 pc-2 is in non-M dwarf stars (Gould, Bahcall and Flynn 1996). As a result of the low number of M dwarfs a marginal discrepancy still remains between the observed (visible) mass and the kinematically determined mass of the disk, estimates of which range from (Kuijken and Gilmore 1989) and pc-2 (Flynn and Fuchs 1994) to pc-2 (Bahcall et al 1992).
5. Spheroid Luminosity Function and Mass Function
We have measured the LF of the spheroid (i.e. stellar halo) from our most distant dwarfs. While most of our M dwarfs are within a few kpc of the Galactic disk, a significant number are at large distances, up to 30 kpc. Distances to all our dwarfs are assigned on the basis of the colour-luminosity relation for (metal rich) disk M dwarfs.
We select a sample of spheroid M dwarfs by taking all objects which would be higher than 8 kpc above the Galactic disk, if they were disk M dwarfs. At such high heights we do not expect to see any disk stars at all (the scale heights of the disk dwarfs were pc and pc from the previous section). These must therefore be spheroid dwarfs, subluminous and hence actually closer than they appear. We model the spheroid stellar density distribution as a power law
where are the Galactic coordinates, is the distance of the sun from the Galactic center, is the spheroid flattening and is the slope of the power law.
Since we do not know the metallicity and hence luminosity of any given M dwarf, we assign density distributions to each object along the line-of-sight based on an assumed metallicity distribution of the spheroid and adopted metallicity dependent colour-magnitude relations (CMR). The CMR relies primarily on the CMD of 43 high velocity M subdwarfs (tangential speeds greater than 260 km s-1) kindly made available to us in advance of publication by C. Dahn (itself an update of Dahn et al 1995). There are unfortunately not quite enough of these stars to sample the CMD densely enough to empirically calibrate the CMR, and we rely to some extent on the theoretical isochrones of Baraffe et al 1997 in order to interpolate within the CMR. Metallicities are not yet available for the M subdwarfs in sufficient number to be completely sure that there are not still systematic offsets between the data and the isochrones, however for our purposes this is secondary because the isochrones are only used to interpolate between the data points.
The spheroid LF is recovered via maximum-likelihood techniques from the star counts. There are 166 spheroid M dwarfs in 53 fields. Our best fitting Galactic parameters are and , where we have set kpc. Our LF is shown in figure 6 where it is compared with spheroid LFs determined using a number of ground based techniques, by Dahn et al (1995 — DLHG) and by Bahcall and Casertano (BC — 1986). A less than desirable feature of the LF determination is that neighbouring bins have correlation coefficients of about , which physically corresponds to the fact that stars could almost equally well be attributed to the bin on either side of their assigned luminosity bin. This is a physical consequence of the range of metallicity and hence absolute magnitude amongst spheroid stars, and cannot be circumvented without individual metallicity or luminosity estimates for the stars (e.g. via multiband photometry).

We note briefly that the comparison LFs of DLHG and BC have both been corrected by us (Gould et al 1998) for incompleteness factors arising as a consequence of the kinematic (proper motion limited) selection of their spheroid samples and consideration of an “intermediate component” (Casertano, Ratnatunga and Bahcall 1990).
The HST and ground based (DLHG) LFs appear different. Is the difference significant? Solving for the best fitting LF which minimises for both samples, where the anti-correlation in the bins in the HST sample is carefully taken into account, we find that the LFs differ at the level. Nevertheless, we hesitate to conclude that the LFs are different. We consider it likely that as samples of M subdwarfs with individually determined abundances become available, systematic corrections to both the ground based and HST LFs may emerge, and it would only take small systematic errors to reduce the discrepancy between the LFs. The difference may be real, and a possible explanation is that the locally determined spheroid LFs sample part of a quite flattened spheroidal component to which we would not be sensitive at large distances from the plane (Hartwick 1987, Sommer-Larsen and Zehn 1990).
Having noted potential pitfalls in the determination of the spheroid LF, we now boldly proceed to the spheroid mass function (MF). Converting the LF to an MF for the spheroid is considerably more difficult than for the disk, because we now must rely on theoretical calculations of the mass-luminosity relation rather than the excellent empirical relation available for the disk. As a consequence, any systematic errors in the theoretical isochrones will propagate into the determination of the MF.
We cannot simply convert the spheroid LF to an MF, because the observables for our spheroid sample are colour and apparent magnitude rather than luminosity, and the spheroid is composed of a wide range of metallicity and hence mass at a given colour. Formally, we use the same maximum likelihood technique as is used to recover the LF from the star counts, using colour-mass relations rather than colour-luminosity relations.
In brief, over the mass range , we find no obvious signs of structure in the mass function, and find that it can be characterised by a power law, , with . This mass function is not corrected for binaries. A steepening (decrease in the power law exponent) of the low mass part () of the MF for the disk of can be expected in the presence of binaries. The binary fraction in the spheroid is as yet unknown, but assuming that the binary fraction is the same as in the disk, the spheroid MF would be approximately flat () or slightly rising for .
Our measurement of the spheroid MF almost down to the Hydrogen burning limit allows us to estimate the mass density of the spheroid. The major uncertainty in such an estimate is the amount of material that is trapped in stellar remnants (white dwarfs) and the amount of sub-stellar matter, neither of which are yet well constrained by observations. We can extrapolate the power-law to zero mass in order to estimate the amount of matter in low mass () objects. Ignoring the binary correction, this yields a local spheroid matter density of pc-3, while adopting a correction for binaries based on the binary fraction in the disk yields a mass density of pc-3, a 25% increase. Fuchs and Jahreiß (1998) have determined a lower limit to the halo mass density by isolating spheroid stars within 25 pc using Hipparcos parallaxes. After selecting stars in the mass range from their Table 1 and using only high tangential velocity stars ( km s-1) with an appropriate correction factor for incompleteness, their lower limit to the density is pc-3, quite similar to our estimate.
6. Contributions of disk and spheroid to the microlensing
The Microlensing discovered towards the Magallenic clouds in the last few years is a major step forward in dark matter studies. A significant fraction of the putative dark matter may be in the form of compact objects of order 0.5 (Alcock et al 1997). Our studies of the disk and spheroid MF allow us to estimate the amount to which directly detected stars within these structures contribute to the observed optical depth towards the LMC.
For the disk, the total visible column density is 40 pc-2 (where 12 pc-2 is in M dwarfs). We characterise the density distribution of the M dwarfs by a sum of a sech2 and an exponential (see section 4). The amount of optical depth along a line-of-sight at Galactic latitude for stars with density distribution is given by where is the vertical height above the disk. We estimate an optical depth toward the LMC due to disk stars of . The latest measurement of the optical depth toward the LMC is (Alcock et al 1997); hence the disk contributes approximately 4% to the microlensing signal.
For the spheroid, we derived in section 5 a local mass density in low mass stars of pc-3, whereas the local density of the dark halo is of order pc-3 (e.g. Bahcall 1984). Hence the spheroid contributes less than 1% of the microlensing signal.
7. Future prospects
The luminosity and mass functions reported here for the disk and spheroid are based on stars detected in about 40 fields. We currently have almost 100 more fields which are under analysis, with additional fields being added at the rate of about 2 dozen per year. While the major trends are clear, these new data will allow us to beat down the Poisson noise, particularly at the faint end of the LF. Colours of the stars, previously transformed to and based on stellar spectra and band passes, have now been calibrated from the ground — this will lead to small changes in our derived LFs and MFs. A few years have elapsed since the Groth Strip images were taken: reimaging all or part of the Groth Strip (or HDF) would allow us to measure proper motions for a large number of faint M dwarfs, giving kinematic information and allowing a better accounting of the fractions contributed by the disk and the spheroid. Near-IR imaging of the Groth Strip would allow a measurement of metallicities of the M dwarfs, which is possible using JHK photometry (Leggett 1992). Very deep low latitude images () would better constrain the faint end of the disk LF, as at present most of our very deep images are at high Galactic latitude. Star counts with HST could also be used to constrain models of the warp/flare of the outer disk, recently proposed as an alternative explanation of the microlensing (Evans et al 1998).
Acknowledgments.
We have benefitted greatly from discussions with Neill Reid and Conard Dahn. Isabelle Baraffe and Gilles Chabrier helped clarify several issues related to theoretical isochrones. Conard Dahn and Isabelle Baraffe kindly made available some of their work in advance of publication. Ed Groth kindly gave us access to his HST parallel data in advance of publication. Dante Minniti suggested to us following up proper motions in the Groth Strip. AG was supported by NSF grant AST 97-27520 and in part by NASA grant NAG 5-3111. JNB was supported by NASA grant NAG 5-1618. CF thanks the IAS for a travel grant and support during several stays in Princeton and Columbus. The work is based in large part on observations with the NASA/ESA Hubble Space Telescope, obtained at the Space Telescope Science Institute, which is operated by the Association of Universities for Research in Astronomy, Inc. (AURA), under NASA contract NAS5-26555. Important supplementary observations were made at KPNO and CTIP operated by AURA.
References
Alcock, C., et al. 1997, ApJ, 486, 697
Bahcall, J. N. 1984, ApJ, 276, 169
Bahcall, J. N. & Casertano, S., 1986, ApJ, 308, 347 (BC)
Bahcall, J. N., Flynn, C., & Gould, A. 1992, ApJ, 389, 234
Bahcall, J. N., Flynn, C., Gould, A., & Kirhakos, S. 1994, ApJ, 435, L51
Baraffe, I., Chabrier, G., Allard, F., & Hauschildt, P. H. 1997, A&A, 327, 1054
Casertano, S., Ratnatunga, K. U., & Bahcall, J. N. 1990, ApJ, 357, 435
Dahn, C. C., Liebert, J. W., Harris, H., & Guetter, H. C. 1995, ESO Workshop on: the Bottom of the Main Sequence and Beyond, ed. C. G. Tinney (Heidelberg: Springer), 239 (DLHG)
Elson, R. A.W., Santiago, B. X., & Gilmore, G. F. 1996, New Astronomy, 1, 1
Evans, N. W., Gyuk, G., Turner, M. S., & Binney, J. 1998, ApJ, 501, L45
Feldmeier, J. J., Ciardullo, R., & Jacoby, G. H. 1998, ApJ, 503, 109
Flynn, C., Gould, A., & Bahcall, J. N. 1996, ApJ, 466, L55
Flynn, C. & Fuchs, B. 1994, MNRAS, 270, 471
Fuchs, B., Jahreiss, H. & Flynn, C. 1998, A&A, 339, 405
Fuchs, B., & Jahreiss, H. 1998, A&A, 329, 81
Gould, A., Bahcall, J. N., & Flynn, C. 1996, ApJ, 465, 759
Gould, A., Bahcall, J. N., & Flynn, C. 1997, ApJ, 482, 913
Gould, A., Bahcall, J. N., Maoz, D., & Yanny, B. 1995, ApJ, 441, 200
Gould, A., Flynn, C., & Bahcall, J. N. 1998, ApJ, 503, 798
Graff, D. S., & Freese, K. 1996, ApJ, 456, L49
Gunn, J.E., & Stryker, L.L., 1983, ApJS, 52, 121
Hansen, B., 1998, Nature, 394, 860
Hartwick, R. D. A. 1987, in The Galaxy, ed. G. Gilmore & B. Carswell (Dordrecht: Reidel), p281
Henry, T. J., & McCarthy, D. W., Jr. 1993, AJ, 106, 773
Hogg, D., et al 1998, AJ, 115, 1418
Holtzman, J.A. et al 1995, PASP, 107, 1065
Holtzman, J. A., Watson, A. M., Baum, W. A., Grillmair, C. J., Groth, E. J., Light, R. M., Lynds, R., & O’Neil, E. J. 1998, AJ, in press
Kuijken, K. & Gilmore, G, 1989, MNRAS, 239, 605
Leggett, S. K. 1992, ApJS, 82, 351
Mendez, R. A., Minniti, D., De Marchi, G., Baker, A., & Couch, W. J. 1996, MNRAS, 283, 666
Monet, D. G., Dahn, C. C., Vrba, F. J., Harris, H. C., Pier, J. R., Luginbuhl, C. B., & Ables, H. D. 1992, AJ, 103, 638
Rhodes, J., Groth, E., & Wfpc1 Id Team 1997, American Astronomical Society Meeting, 191, 0301
Reid, I. N., Hawley, S. L., & Gizis, J. E. 1995, AJ, 110, 1838
Richstone, D., Gould, A., Guhathakurta, P., & Flynn, C. 1992, ApJ, 388, 354
Salim, S. & Gould, A. 1998, astro-ph/9809391
Sommer-Larsen, J., & Zhen, C. 1990, MNRAS, 242, 10
Wielen, R., Jahreiss, H., & Kruger, R. 1983, IAU Colloq. 76: Nearby Stars and the Stellar Luminosity Function, 163