RR Lyrae Variables in the Globular Cluster M55.
The First
Evidence for Non Radial Pulsations in RR Lyr Stars.
Abstract
We present the results of a photometric study of RR Lyrae variables in the field of the globular cluster M55. We have discovered nine new RR Lyrae stars, increasing the number of known variables in this cluster to 15 objects. Five of the newly discovered variables belong to Bailey type RRc and two to type RRab. Two background RRab stars are probable members of the Sagittarius dwarf galaxy. Fourier decomposition of the light curves was used to derive basic properties of the present sample of RR Lyrae variables. From an analysis of the RRc variables we obtain a mean mass of , luminosity , effective temperature K, and helium abundance . Based on the colors, periods and metallicities of the RRab stars we estimate the value of the color excess for M55 to be equal to . Using this value we derive the colors of the blue and red edges of the instability strip in M55. The blue edge lies at mag and the red edge lies at mag. We estimate the values of the visual apparent and dereddened distance moduli to be and , respectively. The light curves of three of the RRc variables exhibit changes in amplitude of over 0.1 mag on the time scale of less than a week, rather short for the Blazhko effect, but with no evidence for another radial pulsational frequency. However we do detect other periodicities which are clearly visible in the light curve after removing variations with the first overtone radial frequency. This is strong evidence for the presence of non-radial pulsations, a behavior common for Scuti stars but not yet observed among RR Lyr variables.
1 Introduction
M55 (=NGC 6809, =C1936-310) is a metal-poor halo globular cluster that is rich and at the same time relatively easy to study owing to its proximity and relative openness. Its reddening and apparent distance moduli are estimated at and (Harris 1996). The cluster was selected as one of the targets in an ongoing survey for eclipsing binaries in globular clusters (eg. Kaluzny, Thompson & Krzeminski 1997). As a side result of that survey we obtained extensive time-series photometry for several RR Lyr stars belonging to M55. More than half of these variables are new discoveries. This contribution is devoted exclusively to the presentation and analysis of photometry of M55 RR Lyr variables from the cluster field. Results obtained for other variables will be published elsewhere (Thompson et al., in preparation).
2 Observations and Data Reduction
Time-series photometry of M55 was obtained during the interval 1997 May 09 – September 17 with the 1.0-m Swope telescope at Las Campanas Observatory. The CCD camera used for the observations has a field of view of with a scale of 0.435 arcsec/pixel. More than 700 -band frames and 65 -band frames were obtained with exposure times ranging from 150 to 300 seconds for the filter and 200 to 360 seconds for the filter depending on the seeing. Instrumental photometry was measured using DoPHOT (Schechter, Mateo & Saha 1993) and the transformation to the standard system was based on observations of several Landolt fields (Landolt 1992). A more detailed description of the observations and reductions can be found in a complementary paper presenting results for eclipsing binaries and SX Phe stars identified in M55 (Thompson et al., in preparation).
3 Results
This search for variable stars in M55 has identified 15 RR Lyrae variables. Six of them (stars V1–V6) were previously known (Bailey 1902, King 1951, King and Bruzual 1976). Of the remaining nine newly discovered variables, 5 are type RRc and 4 are type RRab.
The periods, intensity averaged brightnesses, amplitudes, colors and equatorial coordinates of the 15 RR Lyr variables are listed in Table 1. A color-magnitude diagram of M55 derived from our observations of M55 is presented in Fig. 1. Open circles denote the RRc stars and filled circles correspond to the RRab variables belonging to M55. The filled triangles correspond to two RRab stars that are more distant than M55 by about 3.5 magnitudes. These two variables are most likely members of the Sagittarius dwarf galaxy (Ibata et al. 1994). The presence of a noticeable population of stars belonging to the Sagittarius dwarf in the field of M55 has been noted by Mateo & Mirabel (1996) and Fahlman et al. (1996). Moreover the first authors reported identification of three RR Lyr stars from the Sagittarius dwarf in their survey for variables in M55. It is likely that the two distant RRab stars discovered by us are among the variables already noted by Mateo & Mirabel (1996). The periods of the cluster RRc stars are between 0.310 and 0.406 days with a mean period of 0.36 days. The periods of the cluster RRab variables are between 0.580 and 0.722 days with a mean value of 0.66 days. These properties clearly place M55 among the Oosterhoff type II clusters.
We have fit our -band light curves to Fourier series with the form:
| (1) |
where and is the pulsation period of the star. A method developed by Schwarzenberg-Czerny (1997) was used to determine values of , and . Although the formal errors of our periods from a least squares fit are quite small, we estimate their actual value to be as large as 0.000010. This is caused by correlations of residuals not accounted for in the least squares solution. Our estimate for the errors in the derived periods corresponds to a phase uncertainty of over the entire length of the observations, a reasonable value given the quality of our light curves. Its magnitude is in agreement with the scatter of periods obtained by fitting Fourier series with different numbers of harmonics.
In Figs. 2, 3 and 4 we show , and light curves of the M55 RRab stars, the M55 RRc stars, and the RRab stars from the Sagittarius dwarf galaxy, respectively. The colors of each star were derived from equation (1) by calculating the brightness at the epoch of each of the observations.
The values of the peak to peak amplitudes presented in Table 1 are used to plot the period-amplitude diagram shown in Fig. 5. Again open circles denote RRc stars, filled circles RRab stars, and filled triangles the two Sagittarius dwarf RRab stars identified in the field of M55. The solid line represents a linear fit to RRab variables in M3 (Kaluzny et al 1998). The data presented in Fig. 5 agree with the well established fact that metallicity of M55 is lower than the metallicity of M3. At the same time the metallicities of the two RRab stars from the Sagittarius dwarf are likely to be slightly higher than the metallicity of M3.
3.1 A Fourier analysis of the RRc variables
In a series of papers Simon and Teays (1982), Simon (1989) and Simon and Clement (1993) have presented a method of estimating the masses, luminosities, effective temperatures and the helium abundance of RRc stars based only on a Fourier decomposition of the -band light curves. The equations of Simon and Clement (1993) are:
| (2) |
| (3) |
| (4) |
| (5) |
where is the mass of the star in solar units, is the first overtone pulsation period in days, is the luminosity in solar units, the effective temperature in Kelvins and (cf. equation 1).
Using the above equations we computed the masses, luminosities and effective temperatures of the RRc stars in our sample. These are presented in Table 2 together with the values of , and . The errors presented in Table 2 are calculated from the error propagation law. Due to the fact that Simon and Clement (1993) used a cosine Fourier series the values of in Table 2 differ from their typical values by .
We exclude from our sample variables V9, V10 and V12 due to their irregular light curves (see subsection 3.2 for a detailed discussion). We also omit variable V11 due to the low accuracy of the estimation of . The mean values of the mass, luminosity, effective temperature, and helium abundance for the remaining 5 RRc variables are , , = K, and , respectively. These values are broadly consistent with those for the RRc variables in the sequence of globular clusters discussed by Kaluzny et al (1998) (cf. their Table 4). In particular we conclude that M55 is similar to NGC 2298. The mean and for this cluster are 1.75 and 7200 K, respectively, with a helium abundance of = 0.26.
Previous determinations of the metallicity of M55 vary between (Bica and Pastoriza 1983, Pilachowski 1984, Smith 1984) and (Zinn 1980, Richtler 1988). The lower estimates agree with those of Suntzeff et al (1991) who obtained and McWilliam et al (1992) who obtained . Considering that the values of , and obtained from the RRc stars are consistent with the sequence from Kaluzny et al (1998), we conclude that this analysis supports the more metal-poor determinations of [Fe/H] for M55.
However, the Fourier analysis suggests a mean mass for the M55 RRc stars that is discrepant with the Kaluzny et al (1998) sequence. Our mean value is . It places M55 between globular clusters such as NGC 6171 ([Fe/H]=, and =7447 K) and M5 ([Fe/H]=, and =7388 K), these values disagree markedly with the values determined in this present work.
We must take into account that the Simon, Teays and Clement formulae for estimates of , , and are all linear functions of and . Let us assume for simplicity that the distributions of and in the cluster are independent, with standard deviations of 0.04 and 0.6, respectively.
Then by propagation of errors rule one can calculate the covariance matrix of , , and . The resulting correlation coefficients are all above 0.9, except for for the correlation of and . This may suggest that the Simon, Teays and Clement formulae do not effectively use all of the information contained in and . For this reason it may be preferable to consider physical similarities between different clusters directly on the and plane. For our sample of the RRc variables in M55 these values are and , respectively.
In Fig. 6 we show a plot of against mean . The solid lines have a slope of 0.4 and are separated by 0.04 in , which represents the uncertainty in the values of computed from and . It is clear that our points do not lie between these lines. But the accuracy in the estimates for the masses, the temperatures and the luminosities does not come from the experimental errors in the measurements of the periods and the values of , but probably in the systematic errors in the Simon and Clement (1993) analysis.
3.2 The non radial pulsation of RRc stars.
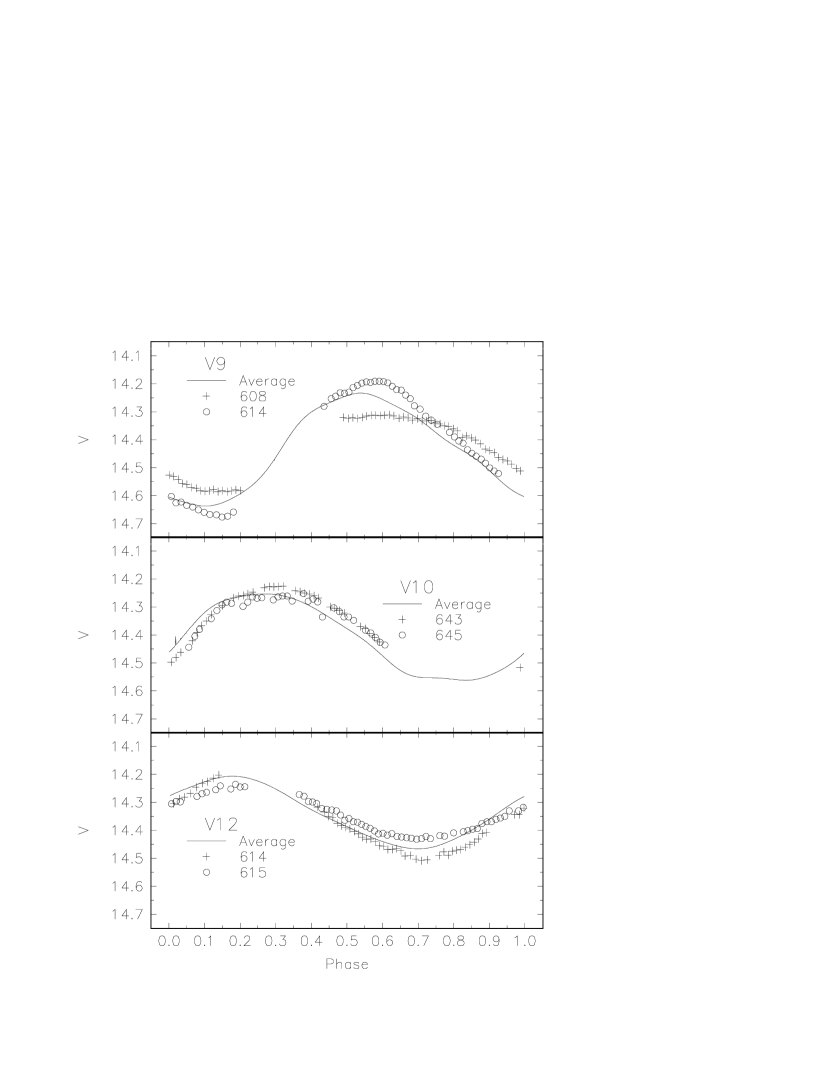
Three of the RRc variables presented in Fig. 3, namely V9, V10 and V12 display a modulation of their light curves. On certain occasions the amplitudes of the light curves change on the time scale of days. This is shown in Fig. 7, where we present average light curves with selected light curves from individual nights. Such behavior is not typical for stars exhibiting the Blazhko effect (Blazhko 1907; see also the discussion in Smith 1995). In particular, in a sample of 46 stars for which Blazhko periods have been determined, the shortest period is 10.9 days. We find no statistically significant periods for V9, V10, and V12 in the range 5 days to 60 days.
This behavior is common in bimodal pulsators (RR Lyr type RRd). To clarify the nature of this modulation we performed a period analysis of the light curves. Power spectra, CLEAN (Roberts et al. 1987) and multi-harmonic periodograms of raw light curves reveal no radial periods other than those listed in Table 1 and their harmonics and aliases. However, the periods of all 3 stars are very close to 1/3 of a day so that the same portions of the light curves are observed over several weeks. In order to judge the magnitude of any effects of aliasing, we simulated -band observations of a bimodal pulsating star with from Table 1 and overtone-to-fundamental period ratio = 0.745, typical for RRd variables (Smith 1995), using the formula:
where denotes a Gaussian noise component with standard deviation 0.025 mag. Synthetic light curves were constructed for each of V9, V10 and V12, with the sampling corresponding to the times of real observations. The amplitudes were selected to closely mimic the light curves observed in Fig. 3. The fundamental period was not detected in power spectra of any of the simulated light curves. Next we prewhitened our real and synthetic light curves by removing a sinusoid with the main period. In all of the power spectra of the prewhitened synthetic light curves, the fundamental period and its aliases were prominent. No periods close to were detected in any of the prewhitened observed light curves, excluding the possibility of double mode radial pulsations in these three variables.
The upper panel in Fig. 8 shows the power spectrum of the observations of variable V9 generated with CLEAN software (Roberts et al. 1987). The most prominent peak is the radial frequency with period . The arrow marks the position of the fundamental period, assuming = 0.745. A second, smaller peak is apparent in the vicinity of the larger peak. To check on the reality of this secondary peak we prewhitened our observed light curves removing a sinusoid with the main period and its two harmonics. The power spectrum of the prewhitened light curve of V9 is presented in the second panel of Fig. 8. The highest peak now corresponds to the frequency of the secondary peak in the first panel, with a period of . The prewhitened observed light curve, phased with this period, is presented in the lower panel of Fig. 8.
We performed a similar analysis for variables V10 and V12. In the power spectrum of V10 we again found two very close peaks (upper panel of Fig. 9). After prewhitening of the observations, the highest peak in the power spectrum corresponds to a period of (middle panel of Fig. 9). The lower panel of Fig. 9 shows the observations phased with this period. Variable V12 also shows multiperiodic behavior (the upper panel of Fig. 10). After prewhitenning of the observations the most dominant period is (the middle panel of Fig. 10). The lower panel of Fig. 10 shows the observations phased with this period.
Non-radial oscillations with many frequencies are common in Scuti variables (main sequence stars in the instability strip) but have not yet been observed in RR Lyr stars. The theoretical calculations performed by Van Hoolst et al (1998) clearly show that low-degree non-radial modes can be excited in RR Lyr stars. In their model, a large number of unstable low-degree () modes in the vicinity of the radial modes are partially trapped and therefore have the largest growth rate and as a result are presumably most likely to be excited (see their Fig. 1). We propose that this is exactly what we observe for variables V9, V10, and V12 in M55.
The -Scuti stars have periods about 10 times shorter than RR Lyr stars. Data sets consisting of observations over a few consecutive nights cover many tens of cycles of variability with good phase coverage, with the result that the complex period structure can be well determined. Observations of RR Lyr light curves are usually not so extensive, with a typical light curve containing 100-200 measurements. Our data are significantly more detailed in both phase coverage and number of observations, with the light curves of our variables V9, V10 and V12 containing over 700 points collected during four months. We conclude that other RR Lyr variables may also pulsate with non-radial modes but that one needs excellent photometric coverage in order to detect these non-radial frequencies.
3.3 RRab variables
Recently Jurcsik and Kovacs (1996), Kovacs and Jurcsik (1996), Kovacs and Jurcsik (1997), and Jurcsik (1998) have extended the work of Clement, Simon and Teays, developing methods for obtaining the metallicity, absolute magnitudes, intrinsic colors and temperatures of RRab stars basing on a Fourier decomposition of -band light curves. Their formulae are:
| (6) |
| (7) |
| (8) |
| (9) |
where (cf. equation 1).
The above equations are valid only for RRab stars with regular light curves, i.e. variables with a deviation parameter smaller than 3 (see Jurcsik and Kovacs 1996). In our sample, only variable V1 satisfies this condition. In order to increase the sample size, we include RRab variables with , a condition satisfied by all of the RRab stars in Table 1 belonging to M55. The results are listed in Table 3 which contains values and errors of , , , , , [Fe/H], and . The errors of , , and come from the least squares fitting (cf. equation 1) and the errors of and [Fe/H] are computed from formulae given by Jurcsik and Kovacs (1996) and Kovacs and Jurcsik (1996).
In Fig. 11 we plot - versus , where is the mean magnitude for the variables. The horizontal line is a fit to the data, giving an apparent distance modulus of , comparable to the value of 13.76 listed by Harris (1996).
As discussed in Section 3.1, previous determinations of the metallicity of M55 vary between and . The Fourier analysis of the RRab stars is consistent with this range, with only variable V8 indicating a larger value of [Fe/H]. However, this star has the largest value of in the present sample of M55 RRab stars. Our determinations of [Fe/H] based on a Fourier decomposition of the light curves of RRab variables are consistent with the period-amplitude diagram presented in Fig. 5.
The reddening of RRab stars can be calculated from the metallicity, expressed in terms of (Preston 1959). From Blanco (1992) we have the relation
| (10) |
where is the observed mean color in the 0.5–0.8 phase interval.
Based on the globular cluster metallicity scale adopted by Zinn and West (1984) and Zinn (1985), Suntzeff et al. (1991) derived the following –[Fe/H] relation:
| (11) |
Using above formulae and adopting a metallicity for M55 of (Zinn and West 1984) we obtain .
The average value of calculated in this way for our four M55 RRab stars is . The reddening in Blanco’s analysis is fairly independent of the metallicity over the quoted range. Using a metallicity of (Smith 1984) we derive . A similar calculation for the reddening of the RRab star in Sagittarius with a well defined light curve (V14 with = 1.40) gives , accepting the value of determined from the Fourier analysis for this star.
These values are slightly larger than previous determinations of between 0.06 and 0.08 mag (Lee 1977, Reed et al. 1988). Recently Schlegel et al. (1998) have published a new all-sky reddening map based on the COBE/DIRBE and IRAS/ISSA maps. Their value of at the position of M55 = 0.135 mag, consistent with our estimate.
Adopting a value of we estimate the absolute distance modulus to be .
3.4 The instability strip
The red and blue edges of the RR Lyrae zone on the horizontal branch compiled by Smith (1995) vary in color between 0.155 and 0.19 mag for the blue edge and between 0.38 and 0.44 mag for the red edge. This corresponds to ranges in effective temperature of 7600–7400 K and 6250–6100 K, respectively. In our case the instability strip lies between and mag. Using a color excess of mag, we obtain and mag for the edges of the instability strip, consistent within the errors with estimates made for other globular clusters (Smith 1995).
4 Conclusions
We have identified nine new RR Lyr variables in the field of the globular cluster M55. Two of these variables are probable members of the Sagittarius dwarf galaxy. The number of known RR Lyr variables in M55 is now thirteen, four RRab stars and nine RRc stars. The periods of the variables indicate that M55 is an Oosterhoff type II cluster.
Three of our nine RRc variables exhibit marked amplitude modulation on a time scale of less than a week. We excluded the hypothesis that such behavior is caused by the Blazhko effect or double mode radial pulsations. A detailed analysis of the power spectra showed other clear frequencies in the vicinity of the main peak. These frequencies are too close to the main period to be radial pulsations. We conclude that we have detected non-radial pulsation in these RRc stars.
We used Fourier decomposition of the -band light curves of the RR Lyr variables to measure luminosities, effective temperatures, metallicities and masses of these variables. The mean mass of the RRc stars in M55 is equal to , the mean , and the mean effective temperature K. The helium abundance of M55 is . The blue edge of the instability strip lays at 0.20 mag and the red edge at 0.38 mag.
The values of obtained from the Fourier decomposition of the light curves of the RRc stars and the period-amplitude measurements presented in Fig. 5 both indicate a metallicity of for M55, consistent with the measurements of Suntzeff et al (1991), McWilliam et al (1992), among others.
A similar analysis for the RRab stars suggests a metallicity of . This value is based only on one star with a deviation parameter smaller than 3.0, and as a result is likely of low accuracy.
Using the Blanco (1992) dependence of the color excess upon the mean color at minimum light of RRab stars, the pulsation period of the star, and spectroscopic parameter we obtained a color excess for M55 of for an adopted metallicity of . We also estimated the values of the visual apparent and dereddened distance moduli to be equal to and , respectively.
We identified in the M55 field two RRab variables belonging most probably to the Sagittarius dwarf galaxy. From the analysis of light curves we obtained for both of them . This result is consistent with earlier determinations of metallicity for RR Lyr variables in the Sagittarius dwarf (Sarajednini and Layden 1995, Mateo et al. 1995, Marconi et al. 1998).
References
- (1) Bailey, S.I., 1902, Harv. Coll. Observ. Annals, 38, 1
- (2) Bica, E.L., Pastoriza, M.G., 1983, Ap&SS, 91, 99
- (3) Blanco, V., 1992, AJ, 104, 734
- (4) Blazhko, S., 1907, Astron. Nachr., 175, 325
- (5) Fahlman, G.G., Mandushev, G., Richer, H.B., Thompson, I.B., and Sivaramakrishnan, A., 1996, ApJL, 459, L65.
- (6) Harris, W.E. 1996, AJ, 112, 1487
- (7) Ibata, R.A., Gilmore, G., and Irwin, M.J., 1994, Nature 370, 194
- (8) Jurcsik J., 1998, A&A, 333, 571.
- (9) Jurcsik J., Kovacs G., 1996, A&A, 312, 111
- (10) Kaluzny, J., Thompson, I., Krzeminski, W. 1997, AJ, 113, 2219
- (11) Kaluzny, J., Hilditch, R.W., Clement, C., and Rucinski, S.M., 1998, MNRAS, 296, 347
- (12) King, I. 1951, Harvard College Obs. Bull., 920, 16
- (13) King, I., Bruzual G.A., 1976, A&A, 50, 459
- (14) Kovacs G., Jurcsik J., 1996, ApJL, 466, L17
- (15) Kovacs G., Jurcsik J., 1997, A&A, 322, 218
- (16) Landolt, A. 1992, AJ, 104, 340
- (17) Lee, Y.-W., 1977, A&A,S 29, 1
- (18) Marconi, G., Buonauno, R., Castellani, M., Iannicola, G., Molaro, P., Pasquini, L., and Pulone, L., 1998, A&A, 330, 453.
- (19) Mateo, M., Udalski, A., Szymański, M., Kaluzny, J., Kubiak, M., and Krzemiński W., 1995, AJ, 109, 588.
- (20) Mateo, M., and Mirabel, N., 1996, in The Origins, Evolution and Destinies of Binary Stars in Clusters, eds. E.F. Milone and J.C. Mermilliod, Vol. 90, p. 87.
- (21) McWilliam, A., Geisler, D., and Rich, R.M., 1992, PASP, 104, 1193
- (22) Pilachowski, C.A., 1984, ApJ, 281, 614
- (23) Preston, G.W., 1959, ApJ, 130, 507
- (24) Reed, B.C., Hesser, J.E., and Shawl, S.J., 1988, PASP, 100, 545
- (25) Richtler, T. 1988, A&A, 204, 101
- (26) Roberts, D.H., Lehar, J., Dreher, J.W., 1987, AJ, 93, 968.
- (27) Sarajednini, A., Layden, A., 1995, AJ, 109, 1089.
- (28) Schechter, P.L., Mateo, M., Saha, A. 1993, PASP, 105, 1342
- (29) Schlegel, D.J., Finkbeiner, D.P., and Davis, M., 1998, ApJ, in press (astro-ph/9710327)
- (30) Schwarzenberg-Czerny, A., 1997, ApJ, 489, 941
- (31) Simon N.R., Teays T.J., 1982, ApJ, 261, 586
- (32) Simon N.R., 1989, ApJL, 343, L17
- (33) Simon N.R., Clement C.M., 1993, ApJ, 410, 526
- (34) Smith, H.A., 1984, ApJ, 281, 148
- (35) Smith, H.A., 1995, RR Lyrae Stars, Cambridge University Press, Cambridge
- (36) Suntzeff, N.B., Kinman, T.D., and Kraft, R.P., 1991, ApJ, 367, 528
- (37) Van Hoolst, T., Dziembowski, W.A., and Kawaler, S.D., 1998, MNRAS, 297, 536
- (38) Zinn, R., 1980, ApJS, 42, 19
- (39) Zinn, R., 1985, ApJ, 293, 424
- (40) Zinn, R., and West, M.J., 1984, ApJS, 55, 45
Table 1: Elements of the RR Lyrae variables in M55
| Star | RA(2000) | Decl.(2000) | P[days] | Type | ||||
|---|---|---|---|---|---|---|---|---|
| V1 | 19:40:22.45 | -30:58:24.28 | 0.579978 | 14.38 | 0.36 | 1.28 | 0.438 | RRab |
| V2 | 19:39:42.24 | -30:57:57.47 | 0.406147 | 14.41 | 0.39 | 0.44 | 0.228 | RRc |
| V3 | 19:40:05.27 | -31:02:34.50 | 0.661987 | 14.28 | 0.40 | 0.85 | 0.358 | RRab |
| V4 | 19:40:07.43 | -30:56:32.11 | 0.384164 | 14.33 | 0.39 | 0.40 | 0.203 | RRc |
| V5 | 19:39:55.89 | -30:58:44.42 | 0.376146 | 14.32 | 0.37 | 0.43 | 0.223 | RRc |
| V6 | 19:40:07.69 | -30:57:49.96 | 0.388821 | 14.38 | 0.39 | 0.47 | 0.234 | RRc |
| V7 | 19:39:59.89 | -30:57:33.08 | 0.682573 | 14.26 | 0.46 | 1.03 | 0.346 | RRab |
| V8 | 19:40:02.08 | -30:58:58.43 | 0.721961 | 14.37 | 0.49 | 0.62 | 0.248 | RRab |
| V9 | 19:40:27.38 | -30:57:59.07 | 0.316307 | 14.43 | 0.31 | 0.41 | 0.198 | RRc |
| V10 | 19:40:08.51 | -30:54:49.04 | 0.331763 | 14.41 | 0.32 | 0.31 | 0.163 | RRc |
| V11 | 19:40:12.02 | -30:56:14.06 | 0.309954 | 14.42 | 0.31 | 0.21 | 0.105 | RRc |
| V12 | 19:39:59.80 | -30:58:02.73 | 0.325864 | 14.34 | 0.32 | 0.26 | 0.125 | RRc |
| V13 | 19:39:53.08 | -30:50:30.57 | 0.397841 | 14.44 | 0.34 | 0.39 | 0.195 | RRc |
| V14 | 19:39:54.76 | -30:50:10.17 | 0.521616 | 17.97 | 0.43 | 1.03 | 0.353 | RRab Sgr |
| V15 | 19:39:43.95 | -31:00:36.33 | 0.637286 | 18.33 | 0.42 | 0.40 | 0.164 | RRab Sgr |
Table 2: Parameters for the RRc variables in M55.
| Star | ||||||
|---|---|---|---|---|---|---|
| V2 | 14.418 | 0.228 | 4.089 | 0.545 | 1.766 | 7150 |
| 0.000 | 0.001 | 0.039 | 0.005 | 0.002 | 3 | |
| V4 | 14.342 | 0.203 | 4.216 | 0.513 | 1.733 | 7220 |
| 0.001 | 0.001 | 0.049 | 0.006 | 0.003 | 4 | |
| V5 | 14.335 | 0.223 | 3.947 | 0.543 | 1.739 | 7217 |
| 0.000 | 0.001 | 0.042 | 0.006 | 0.002 | 3 | |
| V6 | 14.363 | 0.234 | 3.847 | 0.567 | 1.760 | 7173 |
| 0.001 | 0.001 | 0.074 | 0.011 | 0.004 | 6 | |
| V11 | 14.423 | 0.105 | 3.448 | 0.557 | 1.681 | 7375 |
| 0.000 | 0.000 | 0.306 | 0.043 | 0.018 | 28 | |
| V13 | 14.445 | 0.195 | 4.448 | 0.493 | 1.736 | 7205 |
| 0.001 | 0.001 | 0.059 | 0.007 | 0.003 | 5 |
Table 3: Parameters for the RRab variables in M55.
| Star | P[days] | [Fe/H] | |||||||
|---|---|---|---|---|---|---|---|---|---|
| V1 | 0.579978 | 14.447 | 0.438 | 4.967 | 1.272 | 0.719 | -1.486 | 6461 | 2.62 |
| 0.000 | 0.001 | 0.005 | 0.007 | 0.084 | 0.022 | ||||
| V3 | 0.661987 | 14.316 | 0.358 | 5.013 | 1.494 | 0.647 | -1.867 | 6270 | 4.72 |
| 0.000 | 0.001 | 0.012 | 0.022 | 0.089 | 0.032 | ||||
| V7 | 0.682573 | 14.304 | 0.346 | 5.301 | 2.017 | 0.654 | -1.590 | 6267 | 4.44 |
| 0.001 | 0.001 | 0.008 | 0.013 | 0.094 | 0.034 | ||||
| V8 | 0.721961 | 14.383 | 0.248 | 5.663 | 2.271 | 0.684 | -1.316 | 6243 | 5.12 |
| 0.001 | 0.001 | 0.016 | 0.038 | 0.102 | 0.047 | ||||
| V14 | 0.521616 | 18.014 | 0.353 | 4.996 | 1.457 | 0.844 | -1.132 | 6520 | 1.40 |
| 0.001 | 0.001 | 0.011 | 0.017 | 0.085 | 0.024 | ||||
| V15 | 0.637286 | 18.341 | 0.164 | 5.457 | 2.602 | 0.821 | -1.135 | 6258 | 18.46 |
| 0.001 | 0.001 | 0.045 | 0.093 | 0.097 | 0.067 |