Intergalactic Extinction of High Energy Gamma-Rays
Abstract
We discuss the determination of the intergalactic pair-production absorption coefficient as derived by Stecker and De Jager by making use of a new empirically based calculation of the spectral energy distribution of the intergalactic infrared radiation field as given by Malkan and Stecker. We show that the results of the Malkan and Stecker calculation agree well with recent data on the infrared background. We then show that previous spectral data from observations of Mrk 421 and Mrk 501 are consistent with the amount of intergalactic absorption predicted by Stecker and De Jager and that the new HEGRA observations of the flaring spectrum of Mrk 501 presented at this conference actually appear to show the amount of intergalactic absorption which we predict. As a further test for intergalactic absorption, we give a predicted spectrum, with absorption included, for PKS 2155-304. This XBL lies at a redshift of 0.12, the highest redshift source yet observed at an energy above 0.3 TeV. This source should have its spectrum steepened by in its spectral index between and TeV and should show an absorption cutoff above TeV. We also discuss the determination of the -ray opacity at higher redshifts (out to ), following the treatment of Salamon and Stecker.
keywords:
gamma-rays; BL Lac objects; gamma-ray bursts; background radiation; infrared1 Introduction
Very high energy -ray beams from blazars can be used to measure the intergalactic infrared radiation field, since pair-production interactions of -rays with intergalactic IR photons will attenuate the high-energy ends of blazar spectra [1]. In recent years, this concept has been used successfully to place upper limits on the the intergalactic IR field (IIRF) [2] - [6]. Determining the (IIRF), in turn, allows us to model the evolution of the galaxies which produce it. As energy thresholds are lowered in both existing and planned ground-based air Cherenkov light detectors [7], cutoffs in the -ray spectra of more distant blazars are expected, owing to extinction by the IIRF. These can be used to explore the redshift dependence of the IIRF [8], [9].
There are now 66 “grazars” (-ray blazars) which have been detected by the EGRET team [11]. These sources, optically violent variable quasars and BL Lac objects, have been detected out to a redshift greater that 2. Of all of the blazars detected by EGRET, only the low-redshift BL Lac, Mrk 421 (), has been seen by the Whipple telescope [12]. The fact that the Whipple team did not detect the much brighter EGRET source, 3C279, at TeV energies [13], [14] is consistent with the predictions of a cutoff for a source at its much higher redshift of 0.54 [1]. So too are the further detections of three other close BL Lacs (), viz., Mrk 501 () [15], 1ES2344+514 ()[16], and PKS 2155-304 () [17] which were too faint at GeV energies to be seen by EGRET111PKS 2155-304 was seen in one observing period by EGRET as reported in the Third EGRET Catalogue [11].
2 The Opacity of Intergalactic Space Owing to the IIRF
The formulae relevant to absorption calculations involving pair-production are given and discussed in Ref. [1]. For -rays in the TeV energy range, the pair-production cross section is maximized when the soft photon energy is in the infrared range:
| (1) |
where is the Compton wavelength of the electron. For a 1 TeV -ray, this corresponds to a soft photon having a wavelength near the K-band (2.2m). (Pair-production interactions actually take place with photons over a range of wavelengths around the optimal value as determined by the energy dependence of the cross section; see eq. (6)).) If the emission spectrum of an extragalactic source extends beyond 20 TeV, then the extragalactic infrared field should cut off the observed spectrum between GeV and TeV, depending on the redshift of the source [8], [9].
3 Absorption of Gamma-Rays at Low Redshifts
Stecker and De Jager [10] (hereafter SD98) have recalculated the absorption coefficient of intergalactic space using a new, empirically based calculation of the spectral energy distribution (SED) of intergalactic low energy photons by Malkan and Stecker [18] (hereafter MS98) obtained by integrating luminosity dependent infrared spectra of galaxies over their luminosity and redshift distributions. After giving their results on the -ray optical depth as a function of energy and redshift out to a redshift of 0.3, SD98 applied their calculations by comparing their results with the spectral data on Mrk 421 [19] and spectral data on Mrk 501 [20].
SD98 make the reasonable simplifying assumption that the IIRF is basically in place at a redshifts 0.3, having been produced primarily at higher redshifts [8], [9], [21]. Therefore SD98 limited their calculations to . (The calculation of -ray opacity at higher redshifts [8],[9] will be discussed in the next section.)

SD98 assumed for the IIRF, two of the SEDs given in MS98 [18] (shown in Figure 1). The lower curve in Figure 1 (adapted from MS98) assumes evolution out to , whereas the upper curve assumes evolution out to . Evolution in stellar emissivity is expected to level off or decrease at redshifts greater than [21]-[24] so that the two curves in Fig. 1 may be considered to be lower and upper limits, bounding the expected IR flux. Using these two SEDs for the IIRF, SD98 obtained parametric expressions for for , taking a Hubble constant of km s-1Mpc-1 [30].
The results of MS98 [18] generally agree well with very recent COBE data.222The derived COBE point at 140 m appears to be inconsistent with all calculated IIRF SEDs. It is also inconsistent with the spectrum of Mrk 501 (Konopelko, these proceedings), since it would imply a -ray optical depth at 20 TeV. and with lower limits from galaxy counts and other considerations [25] - [29]. The results of MS are also in agreement with upper limits obtained from TeV -ray studies [2] - [6]. This agreement is illustrated in Figure 2 which shows the upper SED curve from MS98 in comparison with various data and limits.

The double-peaked form of the SED of the IIRF requires a 3rd order polynomial to approximate the opacity in a parametric form. SD98 give the following approximation:
| (2) |
where the z-dependent coefficients are given by
| (3) |
Table 1 gives the numerical values for , with , and . The numbers before the brackets are obtained using the lower IIRF SED shown in Figure 1; The numbers in the brackets are obtained using the higher IIRF SED. Equation (2) approximates to within 10% for all values of z and E considered.
| Table 1: Polynomial coefficients | ||||
|---|---|---|---|---|
| 0 | 1.11(1.46) | -0.26( 0.10) | 1.17(0.42) | -0.24( 0.07) |
| 1 | 1.15(1.46) | -1.24(-1.03) | 2.28(1.66) | -0.88(-0.56) |
| 2 | 0.00(0.15) | -0.41(-0.35) | 0.78(0.58) | -0.31(-0.20) |
Figure 3 shows the results of the SD98 calculations of the optical depth for various energies and redshifts up to 0.3.
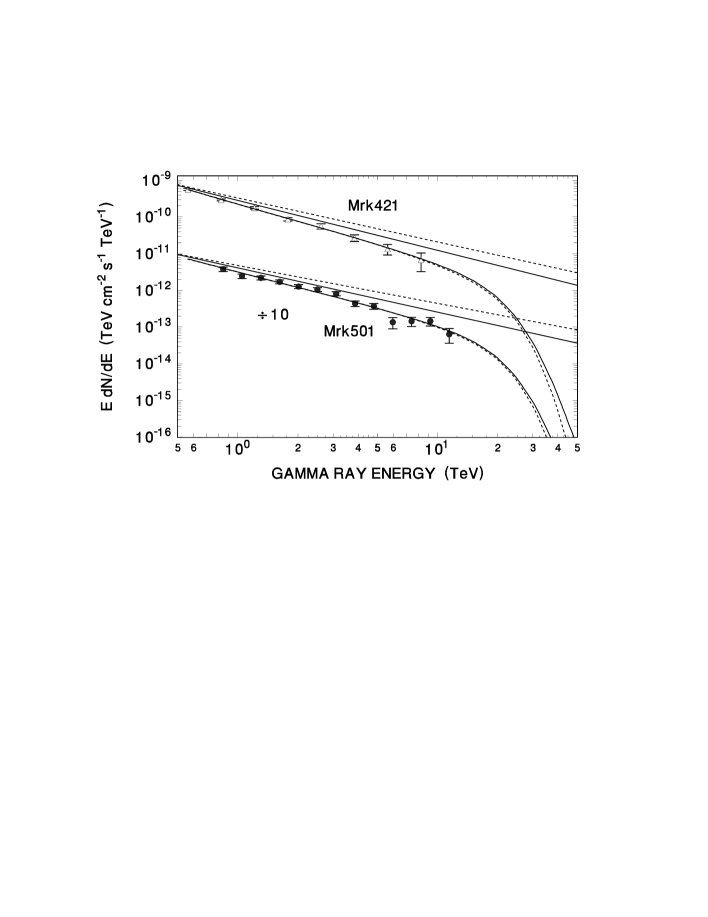
Figure 4 shows observed spectra for Mrk 421 [19] and Mrk 501 [20] in the flaring phase, compared with best-fit spectra of the form , with given by the two appropriate curves shown in Figure 3. Because for , TeV, there is no obvious curvature in the differential spectra below this energy; rather, we obtain a slight steepening in the power-law spectra of the sources as a result of the weak absorption. This result implies that the intrinsic spectra of the sources should be harder by 0.25 in the lower IRRF case, and 0.45 in the higher IIRF case.

The SD98 results for the absorption coefficient as a function of energy do not differ dramatically from those obtained previously [31], [32]; however, they are more reliable because they are based on the empirically derived IIRF given by MS98, whereas all previous calculations of TeV -ray absorption were based on theoretical modeling of the IIRF. The MS98 calculation was based on data from nearly 3000 IRAS galaxies. These data included (1) the luminosity dependent infrared SEDs of galaxies, (2) the 60m luminosity function of galaxies and, (3) the redshift distribution of galaxies.
The advantage of using empirical data to construct the SED of the IIRF, as done in MS98, is particularly indicated in the mid IR range. In this region of the spectrum, galaxy observations indicate more flux from warm dust in galaxies than that taken account of in more theoretically oriented models (e,g, Primack, et al., these proceedings). As a consequence, the mid-IR “valley” between the cold dust peak in the far IR and cool star peak in the near IR is filled in more in the MS98 results and is not as pronounced as in previously derived models of the IR background SED. Such other derived SEDs are in conflict with recent lower limits in the mid-IR derived from galaxy counts (see Figure 2).
The SD98 calculations predict that intergalactic absorption should only slightly steepen the spectra of Mrk 421 and Mrk 501 below 10 TeV, which is consistent with the data already in the published literature (see Figure 4). The SD98 calculations further predict that intergalactic absorption should turn over the spectra of these sources at energies greater than 20 TeV (see Figure 4). Observations of these objects at large zenith angles, which give large effective threshold energies, may thus demonstrate the effect of intergalactic absorption.
The observed spectrum of Mrk 501 in the flaring phase has been newly extended to an energy of 24 TeV by observations of the HEGRA group. (These new data are not shown in Figure 4 but are given in the paper of Konopelko in these proceedings.) The new HEGRA data are well fitted by a source spectrum power-law of spectral index steepened at energies above a few TeV by intergalactic absorption with the optical depth calculated by SD98 (Konopelko, private communication).
Finally, we consider the source PKS 2155-304, an XBL located at a moderate redshift of 0.117, which has been reported by the Durham group to have a flux above 0.3 TeV of cm-2 s-1 [17], close to that predicted by a simple SSC model [33]. Using the SD98 absorption results for the higher IR SED in Figure 1 and assuming an source spectrum, we predict an absorbed (observed) spectrum as shown in Figure 5. As indicated in the figure, we find that this source should have its spectrum steepened by 1 in its spectral index between and TeV and should show an absorption turnover above TeV. Observations of the spectrum of this source should provide a further test for intergalactic absorption.

4 Absorption of Gamma-Rays at High Redshifts
We now discuss the absorption of 10 to 500 GeV -rays at high redshifts. In order to calculate such high-redshift absorption properly, it is necessary to determine the spectral distribution of the intergalactic low energy photon background radiation as a function of redshift as realistically as possible out to frequncies beyond the Lyman limit. This calculation, in turn, requires observationally based information on the evolution of the spectral energy distributions (SEDs) of IR through UV starlight from galaxies, particularly at high redshifts.
Conversely, observations of high-energy cutoffs in the -ray spectra of blazars as a function of redshift, which may enable one to separate out intergalactic absorption from redshift-independent cutoff effects, could add to our knowledge of galaxy formation and early galaxy evolution. In this regard, it should be noted that the study of blazar spectra in the 10 to 300 GeV range is one of the primary goals of a next generation space-based -ray telescope GLAST (Gamma-ray Large Area Space Telescope) (Ref. [34] and Gehrels, these proceedings) as well as VERITAS and other future ground based -ray telescopes.
Salamon and Stecker [9] (hereafter SS98) have calculated the -ray opacity as a function of both energy and redshift for redshifts as high as 3 by taking account of the evolution of both the SED and emissivity of galaxies with redshift (see section 4.2). In order to accomplish this, they adopted the recent analysis of Fall, et al. [23] and also included the effects of metallicity evolution on galactic SEDs. They then gave predicted -ray spectra for selected blazars and extend our calculations of the extragalactic -ray background from blazars to an energy of 500 GeV with absorption effects included (see section 4.3). Their results indicate that the extragalactic -ray background spectrum from blazars should steepen significantly above 20 GeV, owing to extragalactic absorption. Future observations of such a steepening would thus provide a test of the blazar origin hypothesis for the -ray background radiation. The results of the SS98 absorption calculations can be used to place limits on the redshifts of -ray bursts (see section 4.4). We describe and discuss these results in the following subsections.
4.1 Redshift Dependence of the Intergalactic Low Energy SED
The opacity of intergalactic space to high energy -rays as a function of redshift depends upon the number density of soft target photons (IR to UV) as a function of redshift, photons whose production is dominated by stellar emission. To evaluate the SED of the IR-UV intergalactic radiation field we must integrate the total stellar emissivity over time. This requires an estimate of the dependence of stellar emissivity on redshift. Previous calculations of -ray opacity have either assumed that essentially all of the background was in place at high redshifts, corresponding to a burst of star formation at the initial redshift [35], [36], [31] or strong evolution [37], or that there is no evolution [37].
Pei and Fall [38] have devised a method for calculating stellar emissivity which bypasses the uncertainties associated with estimates of poorly defined luminosity distributions of evolving galaxies. The core idea of their approach is to relate the star formation rate directly to the evolution of the neutral gas density in damped Ly systems, and then to use stellar population synthesis models to estimate the mean co-moving stellar emissivity of the universe as a function of frequency and redshift [23]. The SS98 calculation of stellar emissivity closely follows this elegant analysis, with minor modifications.
Damped Ly systems are high-redshift clouds of gas whose neutral hydrogen surface density is large enough ( cm-2) to generate saturated Ly absorption lines in the spectra of background quasars that happen to lie along and behind common lines of sight to these clouds. These gas systems are believed to be either precursors to galaxies or young galaxies themselves, since their neutral hydrogen (HI) surface densities are comparable to those of spiral galaxies today, and their co-moving number densities are consistent with those of present-day galaxies [39], [40]. It is in these systems that initial star formation presumably took place, so there is a relationship between the mass content of stars and of gas in these clouds; if there is no infall or outflow of gas in these systems, the systems are “closed”, so that the formation of stars must be accompanied by a reduction in the neutral gas content. Such a variation in the HI surface densities of Ly systems with redshift is seen, and is used by Pei and Fall [38] to estimate the mean cosmological rate of star formation back to redshifts as large as .
Pei and Fall [38] estimated the neutral (HI plus HeI) co-moving gas density in damped Ly systems from observations of the redshift evolution of these systems by Lanzetta, et al. [41] . Lanzetta, et al. have observed that while the number density of damped Ly systems appears to be relatively constant over redshift, the fraction of higher density absorption systems within this class of objects decreases steadily with decreasing redshift. They attribute this to a reduction in gas density with time, roughly of the form , where is the current gas density in galaxies. Pei and Fall have taken account of self-biasing effects to obtain a corrected value of . SS98 [9] have reproduced their calculations to obtain under the assumptions that the asymptotic, high redshift value of the neutral gas mass density is , where /(100 km s-1Mpc-1). In a “closed galaxy” model, the change in co-moving stellar mass density , since the gas mass density is being converted into stars. This determines the star formation rate and consequent stellar emissivity. The rate of metal production, , is related to star formation rate by , where is the metallicity yield averaged over the initial stellar mass function, with being the solar metallicity [38]. This gives a metallicity evolution .
In order to determine the mean stellar emissivity from the star formation rate, an initial mass function (IMF) must be assumed for the distribution of stellar masses in a freshly synthesized stellar population. To further specify the luminosities of these stars as a function of mass and age , Fall, Charlot, and Pei [23] use the Bruzual-Charlot (BC) population synthesis models for the spectral evolution of stellar populations [42], [43]. In these population synthesis models, the specific luminosity , of a star of mass and age is integrated over a specified IMF to obtain a total specific luminosity per unit mass for an entire population, in which all stellar members are produced simultaneously (). Following Fall, Charlot, and Pei [23], SS98 used the BC model corresponding to a Salpeter IMF, , where . The mean co-moving emissivity was then obtained by convolving over time the specific luminosity with the mean co-moving mass rate of star formation. SS98 also obtained metallicity correction factors for stellar radiation at various wavelengths. Increased metallicity gives a redder population spectrum [44], [45].
SS98 calculated stellar emissivity as a function of redshift at 0.28 m, 0.44 m, and 1.00 m, both with and without a metallicity correction. Their results agree well with the emissivity obtained by the Canada-French Redshift Survey [46] over the redshift range of the observations ().
The stellar emissivity in the universe is found to peak at , dropping off steeply at lower reshifts and more slowly at higher redshifts. Indeed, Madau, et al. [21] have used observational data from the Hubble Deep Field to show that metal production has a similar redshift distribution, such production being a direct measure of the star formation rate. (See also Ref. [24]).
The co-moving radiation energy density is the time integral of the co-moving emissivity ,
| (4) |
where and is the redshift corresponding to initial galaxy formation. The extinction term accounts for the absorption of ionizing photons by the clumpy intergalactic medium (IGM) that lies between the source and observer. Although the IGM is effectively transparent to non-ionizing photons, the absorption of photons by HI, HeI and HeII can be considerable [47].
4.2 The Gamma-Ray Opacity at High Redshifts
With the co-moving energy density evaluated [9] (SS98), the optical depth for -rays owing to electron-positron pair production interactions with photons of the stellar radiation background can be determined from the expression [1]
| (5) |
where , is the observed -ray energy at redshift zero, is the frequency at redshift , is the redshift of the -ray source, , being the angle between the -rayand the soft background photon, is Planck’s constant, and the pair production cross section is zero for center-of-mass energy , being the electron mass. Above this threshold,
| (6) |
where .
Figure 6 shows the opacity for the energy range 10 to 500 GeV, calculated by SD98 both with and without a metallicity correction. Extinction of -rays is negligible below 10 GeV.

The weak redshift dependence of the opacity at the higher redshifts as shown in Figure 6 indicates that the opacity is not very sensitive to the initial epoch of galaxy formation, contrary to the speculation of MacMinn and Primack [31]. In fact, the uncertainty in the metallicity correction (see Figure 6) would obscure any dependence on even further.
4.3 The Effect of Absorption on the Spectra of Blazars and the Gamma-Ray Background
With the -ray opacity calculated out to , the cutoffs in blazar -ray spectra caused by extragalactic pair production interactions with stellar photons can be predicted. The left graph in Figure 7 from Ref. [9] (SS98) shows the effect of the intergalactic radiation background on a few of the grazars observed by EGRET, viz., 1633+382, 3C279, 3C273, and Mrk 421, assuming that the mean spectral indices obtained for these sources by EGRET extrapolate out to higher energies attenuated only by intergalactic absorption. Observed cutoffs in grazar spectra may be intrinsic cutoffs in -rayproduction in the source, or may be caused by intrinsic -ray absorption within the source itself.

The right hand graph in Figure 7 shows the background spectrum predicted from unresolved blazars [48], [9] compared with the EGRET data [49]. Note that the predicted spectrum steepens above 20 GeV, owing to extragalactic absorption by pair-production interactions with radiation from external galaxies, particularly at high redshifts. Above 10 GeV, blazars may have natural cutoffs in their source spectra [33] and intrinsic absorption may also be important in some sources [50]. Thus, above 10 GeV the calculated background flux from unresolved blazars shown in Figure 7 may actually be an upper limit. Whether cutoffs in grazar spectra are primarily caused by intergalactic absorption can be determined by observing whether the grazar cutoff energies have the type of redshift dependence predicted here.
4.4 Constraints on Gamma-ray Bursts
The discovery of optical and X-ray afterglows of -ray bursts and the identification of host galaxies with measured redshifts, i.e. , [51], [52], has lead the accumulation of evidence that these bursts are highly relativistic fireballs originating at cosmological distances [53] and may be associated primarily with early star formation [54].
As indicated in Figure 6 -rays above an energy of 15 GeV will be attenuated if they at emitted at a redshift of 3. On 17 February 1994, the EGRET telescope observed a -ray burst which contained a photon of energy 20 GeV [55]. As an example, if one adopts the opacity results which include the metallicity correction, the highest energy photon in this burst would be constrained probably to have originated at a redshift less than 2. Future detectors such as GLAST (Ref. [34], also Gehrels, these proceedings) may be able to place better redshift constraints on bursts observed at higher energies. Such constraints may further help to identify the host galaxies of -ray bursts.
5 Acknowledgment
I wish to acknowledge that the work presented here was a result of extensive collaboration with O.C. De Jager, M.A. Malkan, and M.H. Salamon, as indicated in the references cited. I also wish to thank Okkie De Jager for helping with the manuscript.
References
- [1] F. W. Stecker, O.C. De Jager and M.H. Salamon Astrophys. J. (Lett.) 390 (1992) L49.
- [2] F.W. Stecker, O.C. De Jager, Astrophys. J. (Lett.) 415 (1993) L71.
- [3] E. Dwek, J. Slavin, Astrophys. J. 436 (1994) 696.
- [4] F.W. Stecker, O.C. De Jager, in Proc. Kruger National Park Conference on TeV Gamma Ray Astrophysics, Berg-en-Dal, South Africa ed. O.C. De Jager (1998) p. 39.
- [5] T. Stanev, A. Franceschini, Astrophys. J. (Lett.) 494 (1998) L159.
- [6] S. Biller, et al. , Phys. Rev. Letters 80 (1998) 2992.
- [7] O.C. De Jager, Proc. Kruger National Park Conference on TeV Gamma Ray Astrophysics, Berg-en-Dal, South Africa (1998).
- [8] F.W. Stecker, M.H. Salamon, Proc. 25th Internat. Cosmic Ray Conf. , Durban 3 (1997) 317.
- [9] M.H. Salamon, F.W.Stecker, Astrophys. J. 493 (1998) 547 (SS98).
- [10] F.W. Stecker, O.C. De Jager, Astron. and Astr. 334 (1998) L85 (SD98).
- [11] Hartman, R.C., et al. , Astrophys. J. Suppl., (1999) in press.
- [12] M. Punch, et al. , Nature 358 (1992) 477.
- [13] G. Vacanti, et al. , Proc. 21st Internat. Cosmic Ray Conf. 2 (1990) 329.
- [14] Kerrick, A.D. et al. , Proc. 23rd Int’l. Cosmic Ray Conf., U. Calgary Press, Calgary, 1 (1993) 405.
- [15] J. Quinn, et al. , Astrophys. J. (Lett.) 456 (1996) L83. 3 (1997) 277.
- [16] M. Catanese, et al. , Astrophys. J. 501 (1998) 616.
- [17] P.M. Chadwick, et al. , e-print astro-ph/9810209, Astrophys. J., in press (see also these proceedings).
- [18] M.A. Malkan and F.W. Stecker, Astrophys. J. 496 (1998) 13 (MS98).
- [19] J.E. McEnery, et al. , Proc. 25th Internat. Cosmic Ray Conf. , Durban 3 (1997) 257.
- [20] F. Aharonian, et al. , Astron. and Astr. 327 (1997) L5.
- [21] P. Madau, P. 1996, in Star Formation Near and Far, ed. S.S. Holt and L.G. Mundy, AIP Symp. Proc. No. 393 (New York: Amer. Inst. Phys.), 481.
- [22] E. Bertin, M. Dennefeld and M. Moshir, Astron. and Astr. 323 (1997) 685.
- [23] S.M. Fall, S. Charlot and Y.C. Pei, Astrophys. J. (Lett.) , 464 (1996) L43.
- [24] C.C. Steidel, et al. , e-print astro-ph/9812167.
- [25] J.L. Puget, et al. , Astron. and Astr. 308, L5.
- [26] M. G. Hauser, et al. , Astrophys. J. 508 (1998) 25.
- [27] E. Dwek, et al. , Astrophys. J. 508 (1998) 106.
- [28] D.J. Fixen, et al. Astrophys. J. 508 (1998) 123.
- [29] E. Dwek, R.G. Arendt, Astrophys. J. 508 (1998) L9.
- [30] R.G. Gratton, et al. , Publ. Astr. Soc. Pac. 402 (1997) 651.
- [31] D. MacMinn, J.R. Primack, Space Sci. Rev. 75 (1996) 413.
- [32] F.W. Stecker, O.C. De Jager, Astrophys. J. 476 (1997) 712.
- [33] F.W. Stecker, O.C. De Jager, M.H. Salamon, M.H., Astrophys. J. (Lett.) 473 (1996) L75.
- [34] E.D. Bloom, E.D., Space Sci. Rev. 75 (1996) 109.
- [35] F.W. Stecker Unveiling the Cosmic Infrared Background (AIP Conf. Proc. 348), (Amer. Inst. of Physics, New York), p. 181 (1996).
- [36] F.W. Stecker, O.C. de Jager, Space Sci. Rev., 75 (1996) 413.
- [37] P. Madau, E.S. Phinney, Astrophys. J. 456 (1996) 124.
- [38] Y.C. Pei, S.M. Fall, Astrophys. J. 454 (1995) 69.
- [39] A.M. Wolfe, Phil. Trans. Royal Soc. London, A, 320 (1986) 503.
- [40] M. Pettini M., et al. , Astrophys. J. 426 (1994) 79.
- [41] K.M. Lanzetta, A.M. Wolfe, D.A. Turnshek, D.A., Astrophys. J., 440 (1995) 435.
- [42] A.G. Bruzual, S. Charlot, S., Astrophys. J. 405 (1993) 538.
- [43] S. Charlot, A.G. Bruzual A.,G., Astrophys. J. 457 (1991) 625.
- [44] G. Worthey, Astrophys. J. Supp. 95 (1994) 107.
- [45] G. Bertelli, et al. , Astron. and Astr. Suppl. 106 (1994) 275.
- [46] S.J. Lilly, et al. , Astrophys. J. (Lett.) 460 (1996) L1.
- [47] P. Madau, Astrophys. J. 441 (1995) 18.
- [48] F.W. Stecker, M.H. Salamon, Astrophys. J. 464 (1996) 600.
- [49] P. Sreekumar, et al. , Astrophys. J. 494 (1998) 523.
- [50] R. Protheroe, P.L. Biermann, Astropart. Phys. 6 (1996) 45.
- [51] M. Metzger, et al. , Nature 387 (1997) 878.
- [52] S.R. Kulkarni, et al. , Nature 393 (1998) 35.
- [53] M. Livio, et al. , Proc. 4th Huntsville Symp. on Gamma Ray Bursts, ed. C.A. Meegan, et al. , (New York: Amer. Inst. Phys.) p. 483 (1998).
- [54] S.G. Djorgovski, S.R. Kulkarni, J.S. Bloom, e-print astro-ph/9808188.
- [55] K. Hurley, et al. , Nature, 372 (1994) 652.