ESO Imaging Survey
Abstract
This paper presents ground-based data obtained from deep optical and infrared observations carried out at the ESO 3.5 New Technology Telescope (NTT) of a field selected for its low HI content for deep observations with AXAF. These data were taken as part of the ESO Imaging Survey (EIS) program, a public survey conducted in preparation for the first year of operation of the VLT. Deep CCD images are available for five optical passbands, reaching limiting magnitudes of 27.0, 27, 26.5, 26.5 and 26. An area of square arcmin is covered by observations, and 30 square arcmin also in . The infrared observations cover a total area of 83 square arcmin, reaching and 23.5. This paper describes the observations and data reduction. It also presents images of the surveyed region and lists the optical and infrared photometric parameters of the objects detected on the co-added images of each passband, as well as multicolor optical and infrared catalogs. These catalogs together with the astrometrically and photometrically calibrated co-added images are public and can be retrieved from the URL “http://www.eso.org/eis”. This data set completes the ESO Imaging Survey program sixteen months after it began in July 1997.
Key Words.:
catalogs – surveys – stars:general – galaxies:general – cosmology:observations1 Introduction
One of the main goals of the ESO Imaging Survey (EIS, Renzini & da Costa 1997) has been to carry out deep, multicolor observations in the optical and infrared passbands over a relatively large area ( 200 square arcmin) to produce faint galaxy samples (EIS-DEEP). The primary objective is to use the color information to estimate photometric redshifts, and identify galaxies likely to be in the poorly sampled redshift interval or Lyman-break candidates at , all of which are interesting targets for follow-up spectroscopic observations with the VLT.
The first part of EIS-DEEP consisted of optical and infrared observations of the Hubble Deep Field South (HDF-S). The results have recently been reported and the data made public world-wide (da Costa et al. 1998, hereafter paper I). However, as pointed out in that paper, EIS-DEEP observations were also carried out over a region (hereafter the AXAF field) around and selected for its low HI column density and where deep X-ray observations will be conducted with AXAF (Giacconi 1998). This field, in contrast to HDF-S, is remarkably devoid of bright stars and therefore particularly suitable for deep ground-based imaging. The aim was to cover about 100 square arcmin in five optical () and two infrared passbands () to similar depth of the HDF-S observations, thereby providing another field from which targets can be selected and observed in a different period of the year.
In the present paper the data from the AXAF field observations are reported. In section 2, the observations and data reduction are discussed, and co-added images for the different fields and passbands are presented. In section 3, the basic photometric parameters of sources detected in each passband are listed as well as optical, infrared and optical-infrared multicolor catalogs. Using these catalogs the characteristics of the data are explored in section 4. Finally, a preliminary list of high-z galaxy candidates is selected. A brief summary is presented in section 5.
2 Observations and Data Reduction
The original goal of the EIS-DEEP observations of the AXAF field was to observe four adjacent and contiguous regions centered on the nominal position selected for the X-ray observations, where the sensitivity and image quality of the X-ray images are expected to be the best. Therefore, the pointings of the optical and infrared cameras were chosen in such a way as to have the X-ray center in a region where the sensitivity of the mosaic, built from different pointings from the ground-based observations, is highest, taking into account both the physical characteristics of the optical and infrared cameras used and the overlap between the images. The pointings adopted in the construction of the optical and infrared mosaics are listed in Table LABEL:tab:pointings. As discussed below, while the infrared mosaic is essentially complete in and , the optical is only half-way complete due to time and weather constraints.
| Field | ||||
|---|---|---|---|---|
| AXAF1 | 03:32:16.7 | -27:46:00.0 | 03:32:17.5 | -27:46:10.0 |
| AXAF2 | 03:32:38.0 | -27:46:00.0 | 03:32:37.5 | -27:46:10.0 |
| AXAF3 | - | - | 03:32:17.5 | -27:50:35.0 |
| AXAF4 | - | - | 03:32:37.5 | -27:50:35.0 |
The optical observations were carried out using the SUSI2 camera (D’Odorico et al. 1998) at the f/11 Nasmyth focus A of the New Technology Telescope (NTT). The camera consists of two thinned, anti-reflection coated, , pixel EEV CCDs (ESO #45, and #46), with the long side aligned in the north-south direction, leading to a field of view of square arcmin. The observations were carried out using a binning, yielding a scale of arcsec per pixel. The gap separating the two CCDs corresponds to arcsec on the sky. To minimize the effect of the inter-chip gap. the observations were carried out using the same dithering pattern as described in paper I.
The optical observations were carried out in the period August-November 1998, using broad-band filters (ESO # 810, 811, 812, 825, and 814, see SUSI2 web page). With exception of the filter, these are the same filters used in the HDF-S observations. A total of 12 nights were allocated for optical EIS-DEEP observations which were split between the HDF-S and AXAF fields. However, because of poor weather conditions it was not possible to complete the program as originally envisioned. Complete observations in all optical passbands are available for AXAF1, while for AXAF2 -band data are missing.
Table 2 summarizes the observations, listing for each field and passband the total integration time, the number of exposures, the range of seeing as measured on individual exposures, the full-width at half-maximum (FWHM) of the point spread function (PSF) in the final co-added image, and the estimated limiting isophote within a 1 square arcsec area. Single exposures ranged from 800 sec () to 250 sec ().
| Filter | seeing | FWHM1 | |||
|---|---|---|---|---|---|
| range | |||||
| (sec) | (arcsec) | (arcsec) | (mag arcsec-2) | ||
| AXAF1 | |||||
| 17000 | 21 | 0.8-1.0 | 0.90 | 27.81 | |
| 6600 | 22 | 0.7-1.0 | 1.10 | 28.76 | |
| 5500 | 22 | 1.0-1.2 | 0.88 | 28.46 | |
| 5500 | 22 | 0.7-1.0 | 0.89 | 28.06 | |
| 12600 | 21 | 0.8-1.4 | 1.31 | 27.51 | |
| AXAF2 | |||||
| 13000 | 16 | 0.7-1.2 | 0.90 | 27.81 | |
| 5400 | 18 | 1.0-1.2 | 1.10 | 28.76 | |
| 5500 | 22 | 0.7-1.1 | 0.88 | 28.46 | |
| 5500 | 22 | 0.7-1.1 | 0.89 | 28.06 |
1 Values determined from AXAF1+2 mosaic.
As described in paper I, analysis of the Landolt standards yields the following estimates for the accuracy of the zero-points: 0.1 mag in ; 0.03 mag in ; 0.03 mag in ; 0.04 mag in ; and 0.05 mag in . These results apply to both chips, with the relative zero-point difference between the chips being smaller than their estimated errors. Only for the and filters there are significant color terms relative to the Johnson system. The photometric accuracy of the EIS-DEEP data was evaluated in paper I by comparing them with those available from other independent observations of the HDF-S field. As described in paper I the agreement is excellent with the scatter being fully accounted for by the measurement errors estimated from SExtractor.

The measured magnitudes were corrected for galactic absorption, using as derived from Schlegel, Finkbeiner & Davis (1998), yielding mag, =0.03 mag, =0.02 mag, =0.02 mag and =0.01 mag. To facilitate the comparison with other authors, all magnitudes given below have been converted to the system using the following relations: and , unless specified otherwise.
A total of 180 science frames were obtained for the AXAF field and reduced using standard IRAF tasks. A complete description of the various reduction steps can be found in paper I. After the frames were corrected for all instrumental effects, an eye-inspection was carried out to mask out features such as satellite tracks.

Infrared observations were obtained using the SOFI camera (Moorwood, Cuby & Lidman 1998) also at the NTT. SOFI is equipped with a Rockwell 10242 detector that, when used together with its large field objective, provides images with a pixel scale of 0.29 arcsec, and a field of view of about square arcmin. The infrared pointings, listed in Table LABEL:tab:pointings were chosen so as to take into account the smaller field of view of SOFI and produce a contiguous mosaic slightly smaller than that in the optical. The final infrared mosaic has an area of square arcmin. The jittering pattern used was the same as described in paper I. Individual observations comprised sixty one-minute exposures, with each exposure being the average of six ten-second sub-exposures.
| Filter | seeing | FWHM1 | |||
|---|---|---|---|---|---|
| range | |||||
| (sec) | (arcsec) | (arcsec) | (mag arcsec-2) | ||
| AXAF1 | |||||
| 10800 | 180 | 0.8-1.2 | 0.99 | 25.32 | |
| 10800 | 180 | 0.8-1.1 | 0.95 | 23.83 | |
| AXAF2 | |||||
| 10800 | 180 | 0.7-0.9 | 0.99 | 25.32 | |
| 10800 | 180 | 0.8-1.0 | 0.95 | 23.83 | |
| AXAF3 | |||||
| 10800 | 180 | 0.7-0.9 | 0.99 | 25.32 | |
| 10800 | 180 | 0.8-1.3 | 0.95 | 23.83 | |
| AXAF4 | |||||
| 10800 | 180 | 0.7-0.8 | 0.99 | 25.32 | |
| 7200 | 120 | 0.7-1.0 | 0.95 | 23.83 |
1 Values determined from combined AXAF1-4 mosaic.
Infrared observations in the and bands were obtained during the same period as the optical data. Total integration times, the number of frames, the seeing range, the FWHM measured on the co-added images, and the estimated limiting isophote within one square arcsec are given in Table 3.
During all nights infrared standards taken from Persson (1997) were observed. From the photometric solutions the errors in the absolute photometric zero-points are found to be: 0.05 mag in and 0.05 mag in . These magnitudes were also converted to the system, using: and .
A total of 1380 SOFI science frames in the AXAF field were reduced, as detailed in paper I, utilizing the program jitter from the astronomical data-reduction package eclipse, written by N. Devillard (Devillard, 1998).
After removing all the instrumental signatures, both optical and infrared images were input to the EIS pipeline for astrometric calibration using the USNO-A V1.0 catalog as reference. In the case of SUSI2, independent astrometric solutions were found for the two chips. Before the astrometric calibration, images were processed by SExtractor using a high detection threshold to measure the size of the PSF of each frame, to create weight maps for co-addition and to flag cosmic rays and defects. Images in the same passband were then co-added using the ”drizzle” method, originally created to handle HST images (Fruchter & Hook 1998), at the same resolution as the original images. In the process of co-addition, images taken in photometric nights were used as reference and all other images were corrected to have the same instrumental magnitudes after extinction correction. Finally, the absolute zero-point was determined and stored in the header of the co-added image. In addition, in order to allow the production of optical-infrared multi-color catalogs based on a single detection image (-image), a co-added image of the optical data matching the infrared image resolution was also created over the area they overlap.

The resulting optical and infrared mosaics in each passband are shown in Figures 1 and 2. Note that there are no -band data for AXAF2. Figure 7 is a true-color image of the optical mosaic of the AXAF field with the blue channel represented by the +image, the green and red channels by the and images, respectively. Figure 8 shows a true-color image of the region of overlap of SOFI and SUSI2 observations with the blue channel represented by the + image, the green channel by the + image, and the red channel by the + image. All the co-added images, including the corresponding weights and masks, are public and may be requested from the URL ”http://www.eso.org/eis”.
3 Object Catalogs
The above images were used to produce an array of source catalogs. These include: co-added single passband, multi-passband optical and optical-infrared catalogs of sources extracted from the image mosaics. As in paper I, the technique (Szalay, Connolly & Szolokov 1998) was used in the production of the multi-color catalogs. These catalogs have the same format as those of paper I and ASCII versions can be found at the URL “http://www.eso.org/eis”. An overview of the available catalogs is presented in Table LABEL:tab:summary. Note that the number of sources in the single band catalog is smaller, because this band only includes data from AXAF1. In the multi-color catalogs -band magnitudes for sources not covered by AXAF1 are given a value of -99.9, as opposed to 99.9 for sources that were observed and detected in the image, but not measurable in the individual band. The coding adopted for the multi-color catalogs in the case of no detections is described in paper I.
| Single Band | Area | |
| [arcmin2] | ||
| 3271 | 55.85 | |
| 3716 | 55.85 | |
| 3460 | 55.85 | |
| 4137 | 55.85 | |
| 1569 | 29.60 | |
| 3150 | 83.26 | |
| 3015 | 83.26 | |
| Multi-Color | ||
| AXAF Optical | 6875 | 55.851 |
| AXAF OIR2 | 3990 | 42.68 |
| AXAF IR | 4583 | 83.26 |
1 see text
2 OIR = optical-infrared
4 Characteristics of the Data
4.1 Point-Sources


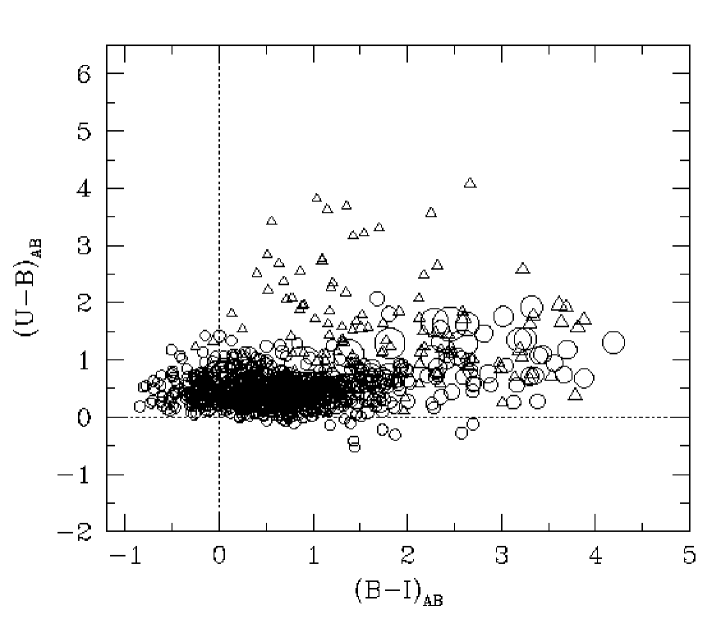
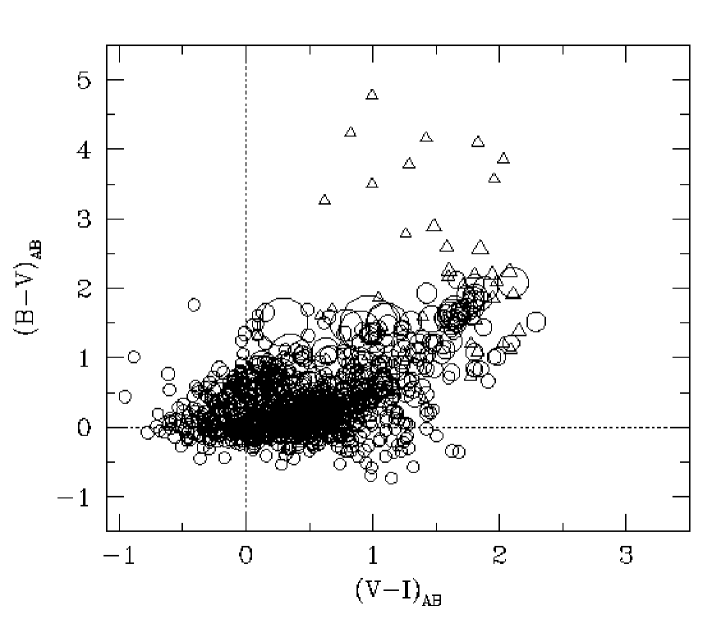
To facilitate comparisons with other data sets, throughout this section magnitudes are expressed in the Johnson-Cousins system. Objects with stellarity index in the -band (chosen because the seeing was best in this band), and V, are defined to be stars. The number of stars in the AXAF field is small, , and is in good agreement with model predictions from Haywood, Robin & Creze (1997, see also Paper I). A good check for the adopted zeropoints is provided by the stellar color-color diagrams. Optical color-color diagrams are presented in Figure 3, showing examples involving all the optical passbands used. All the colors have been corrected for reddening and the and colors have been corrected for the color term derived in paper I. Only detections, in all passbands, are included in these diagrams. For comparison, the empirical relations compiled by Caldwell et al. (1993) and, whenever available, the theoretical isochrone taken from Baraffe et al. (1997) are used. The theoretical model assumes a 10 Gyr, [M/H] population, typical for halo stars, and is fine-tuned to model low-mass main sequence stars. As can be seen, in all cases the EIS-DEEP data are in good agreement with the empirical and/or model sequences.
4.2 Galaxies
To evaluate the performance and depth of the galaxy catalogs produced in the different optical and infrared passbands, the number counts obtained within the AXAF region are compared with those obtained in paper I. For this comparison, the multi-color optical and infrared catalogs, as detected from the image and properly normalized to the same area, have been used. These counts are shown in Figures 4 and 5. As can be seen, there is a remarkable agreement between the EIS-DEEP galaxy counts of the AXAF and the HDF-S region. The agreement of the EIS-DEEP galaxy counts in the HDF-S region with those obtained by other authors was already established in Paper 1.
Since one of the primary goals of the survey has been to identify candidate galaxies at high-z for follow-up spectroscopic observations with the VLT, the color information available in , , , and has been used to identify preliminary Lyman-break candidates. Extensive work has been done to tune the color-selection criteria for different sets of filters (e.g., Steidel & Hamilton 1993. Madau et al. 1996) and to identify regions in the color-color diagrams populated by Lyman-break galaxies in different redshift ranges. Unfortunately, differences in the passbands between the SUSI2 filters and those previously used, prevent adopting the same color criteria. However, given the great interest in finding likely candidates at high-z a simple approach has been adopted here for a first cut analysis. This was done by considering the tracks most likely to trace the evolutionary sequence of galaxies of different types in color-color diagrams appropriate for the SUSI2 filters (Arnouts 1998, see also Fontana et al. 1998). Based on these results conservative regions in and diagrams, shown in Figure 6, were defined. The criteria adopted were and in the diagram and and . Based on the model predictions these regions should be populated by galaxies. A more precise selection will require a more detailed analysis using the color information to assign photometric redshifts. This will certainly be pursued by several groups using the public data.
The galaxies shown in Figure 6 are detections (, as measured in a 3 arcsec diameter aperture) obtained from the optical -image, thus allowing for the identification of objects that may be undetected in one or more passbands. The objects shown in the color-color diagrams follow several constraints. First, they have to be detections at least in and for the diagram shown in the left panel and and for that in the right panel. If the object is less than a detection in the bluest passband, it is represented by a triangle, otherwise by a circle. For blue dropouts the magnitude measured by SExtractor was used regardless of its error. If the magnitude is not measurable (m=99.9), the 2 limiting magnitude is assigned to the object.
Adopting the color selection criteria described above, galaxies in the AXAF1 field were selected. All candidates were visually inspected and 29 -dropout and 13 -dropout galaxies remained. These are listed in Tables 5 and 6, which provide the following information: in columns (1) and (2) right ascension and declination (J2000.0); in column (3) the magnitude measured in an aperture of 3 arcsec. The remaining columns give the colors and their respective errors. Whenever, an object is not measurable in a given passband or the the error in the color involving this filter is set to -1. Even though the selection criteria adopted are admittedly crude, inspection of the selected objects indicates that they are by and large promising.
| # | |||||||
|---|---|---|---|---|---|---|---|
| 1 | 03:32:05.84 | :48:15.9 | |||||
| 2 | 03:32:18.29 | :47:22.8 | |||||
| 3 | 03:32:15.15 | :47:54.5 | |||||
| 4 | 03:32:17.25 | :47:54.3 | |||||
| 5 | 03:32:09.60 | :47:39.8 | |||||
| 6 | 03:32:19.43 | :47:28.3 | |||||
| 7 | 03:32:03.53 | :47:21.0 | |||||
| 8 | 03:32:13.53 | :47:19.6 | |||||
| 9 | 03:32:18.30 | :47:14.5 | |||||
| 10 | 03:32:22.72 | :46:37.6 | |||||
| 11 | 03:32:15.47 | :46:31.4 | |||||
| 12 | 03:32:04.40 | :46:03.2 | |||||
| 13 | 03:32:17.93 | :45:36.1 | |||||
| 14 | 03:32:09.07 | :45:35.2 | |||||
| 15 | 03:32:16.63 | :45:20.1 | |||||
| 16 | 03:32:03.31 | :45:18.7 | |||||
| 17 | 03:32:13.79 | :45:12.9 | |||||
| 18 | 03:32:15.70 | :45:15.2 | |||||
| 19 | 03:32:09.62 | :45:14.5 | |||||
| 20 | 03:32:22.48 | :44:38.2 | |||||
| 21 | 03:32:05.01 | :44:31.6 | |||||
| 22 | 03:32:28.26 | :44:03.4 | |||||
| 23 | 03:32:14.49 | :44:05.6 | |||||
| 24 | 03:32:18.23 | :44:21.9 | |||||
| 25 | 03:32:03.85 | :44:05.4 | |||||
| 26 | 03:32:08.51 | :43:58.2 | |||||
| 27 | 03:32:26.39 | :43:46.5 | |||||
| 28 | 03:32:03.58 | :43:40.5 | |||||
| 29 | 03:32:16.15 | :44:01.6 |
| # | |||||||
|---|---|---|---|---|---|---|---|
| 1 | 03:32:14.37 | :48:31.2 | |||||
| 2 | 03:32:06.62 | :47:47.5 | |||||
| 3 | 03:32:16.21 | :47:36.6 | |||||
| 4 | 03:32:13.53 | :47:19.6 | |||||
| 5 | 03:32:20.31 | :47:18.1 | |||||
| 6 | 03:32:09.19 | :46:52.7 | |||||
| 7 | 03:32:05.08 | :46:12.3 | |||||
| 8 | 03:32:12.30 | :45:24.7 | |||||
| 9 | 03:32:18.94 | :45:23.6 | |||||
| 10 | 03:32:06.24 | :45:01.8 | |||||
| 11 | 03:32:25.82 | :44:34.6 | |||||
| 12 | 03:32:10.14 | :44:09.7 | |||||
| 13 | 03:32:17.75 | :43:40.1 |
5 Summary
This paper presents the results of deep optical ( 56 square arcmin) and infrared ( 83 square arcmin) imaging of a region in the southern hemisphere of very low HI column density. An area of 48 square arcmin has been observed in at least six passbands, two of which are infrared. The observations were carried out as part of the EIS public survey. In addition, single-passband catalogs have been prepared as well as multi-color optical, infrared and optical-infrared catalogs. The latter were produced using the technique, which has proven to yield robust detections of very faint galaxies. The color information has been used to find possible high-z galaxies for follow-up observations with the VLT.
The released data represent the last set of the second part of the EIS program, involving deep imaging (EIS-DEEP). The project, as originally envisoned, has been completed. Sixteen months after the beginning of observations, it has produced a large volume of data from a moderately deep, large solid angle survey (EIS-WIDE) and multi-band deep observations of specific areas of interest. The data have been completely reduced, source catalogs have been extracted, and preliminary lists of potentially interesting targets have been produced. All the data presented here and in previous papers of the series, in the form of images, source catalogs and selected targets, are public and can be requested at ”http://www.eso.org/eis”.
Acknowledgements.
We thank all the people directly or indirectly involved in the ESO Imaging Survey effort. In particular, all the members of the EIS Working Group (S. Charlot, G. Chincarini, S. Cristiani, J. Krautter, K. Kuijken, K. Meisenheimer, D. Mera, Y. Mellier, M. Ramella, H. Röttering, R. Saglia and P. Schneider) for the innumerable suggestions and criticisms, the ESO OPC, the NTT team, in particular the night assistants, the ESO Archive Groups and ECF. We would also like to thank S. Arnouts, J. Caldwell, N. Devillard, A. Fontana, P. Rosati and R. Fosbury for their help and assistance. Special thanks to Riccardo Giacconi for making this effort possible.References
- (1) Arnouts S., D’Odorico S., Cristiani S., Zaggia S., Fontana A., & Giallongo E., 1999, A&A, in press
- (2) Baraffe I., Chabrier G., Allard F., & Hauschildt P. H., 1998, A&A, in press
- (3) Bertin, A. & Arnouts, S., 1996, A&AS, 117, 393
- (4) Caldwell, J., Cousins A., Ahlers C., van Wamelen, & Maritz E., 1993, SAAO Circulars, 15, 1
- (5) da Costa et al. , 1998, A&A, submitted, (astroph-9812125)
- (6) Devillard, N., 1998, Eclipse Data Analysis Software Package (ESO: Garching)
- (7) D’Odorico, S. et al. , 1998, Proceedings of SPIE 3355, p. 507
- (8) Fruchter, A.S.& Hook, R. N., 1998, PASP, submitted (astro-ph/9808087)
- (9) Giacconi, R., 1998, in “Highlights in X-ray Astronomy “, in press
- (10) Haywood, M., Robin, A.C., & Creze, M., 1997, A&A, 320, 440
- (11) Landolt, A.U., 1992, AJ, 104, 340
- (12) Madau, P., Ferguson, H. C., Dickinson, M. E., Giavalisco, M., Steidel, C. C., & Fruchter, A. 1996, MNRAS, 283, 1388
- (13) Moorwood, A., Cuby, J.G. & Lidman, C., 1998, The Messenger, 91, 9
- (14) Persson, 1997, private communication
- (15) Schlegel, D. J., Finkbeiner, D. P., & Davis, M. 1998, ApJ, 500, 525
- (16) Steidel, C.S. & Hamilton D., 1993, AJ, 105, 2017.
- (17) Szalay, A., Connolly, A. & Szokoly, G. P. 1998, astro-ph/9811086

