Small Scale Structure at High Redshift:
I. Glimpses of the Interstellar Medium at Redshift
11affiliation: The observations were made at the W.M. Keck Observatory
which is operated as a scientific partnership between the California
Institute of Technology and the University of California; it was made
possible by the generous support of the W.M. Keck Foundation.
Abstract
We have obtained high resolution (FWHM = 4.4 kms-1) Keck HIRES spectra of images A and C of the gravitationally lensed QSO Q1422+231 (zem = 3.628). The images are separated by 1.3” on the sky. In an absorption system at zabs = 3.538 gas column density variations by an order of magnitude and velocity shear on the order of 10 kms-1 are observed in the low ionization (SiII, CII) lines. The transverse separation in the absorbing cloud is estimated to be as small as 26h parsec, corresponding to an effective angular resolution of 4 milliarcseconds as seen from the Earth. In contrast, the high ionization (CIV) gas appears mostly featureless and thus must be considerably more extended. The abundances of the elements carbon, silicon and oxygen appear to be close to the solar values. The observation provides the first spatially and kinematically resolved probe of the interstellar medium at high redshift on scales small enough to be influenced by individual stars or star clusters. The mass associated with the low ionization ”cloudlets” is likely to be less than about 3000 and possibly less than 1 M⊙. The velocity shear seen across the lines of sight is too large to be caused by galactic bulk motion, so the velocity field of the low ionization gas must be strongly influenced by small scale local gasdynamics. While it cannot presently be excluded that the disturbances of the gas are due to high velocity outflows from the background QSO, the observed velocity and density structure of the z=3.538 system is consistent with our line of sight running through an expanding shell of gas, possibly a supernova bubble or a stellar wind.
Subject Headings: galaxies: kinematics and dynamics — galaxies: structure — interstellar medium — quasars: absorption lines
accepted for publication by the Astrophysical Journal
1 Introduction
Observations of intervening absorption in multiple, gravitational lensed QSO images (e.g., Young et al., 1981; Weymann & Foltz 1983; Foltz et al. 1984; Smette et al. 1993,1995; Bechtold & Yee 1995; Zuo et al. 1997; Michalitsianos et al. 1997, Rauch 1998, Petry et al. 1998, Lopez et al 1998) provide a very useful tool for investigating the distribution of matter at high redshift. For example, the typical sizes of various types of high redshift cosmic structures can be measured in a statistical sense from the numbers of coincident and anticoincident absorption systems in both lines-of-sight (LOS); depending on the amount of spectroscopic detail available, additional inferences can be drawn about the baryonic density and velocity fields and their spatial variations. Lensing by an intervening galaxy enlarges - like a magnifying glass - any structures on spatial scales from virtually zero extent (down to the size of the QSO continuum emission region) up to the maximum beam separation (tens of kpcs, at the redshift position of the lensing galaxy) by opening the projected angle between the separate QSO images to a few arcsecs, where they can be spatially resolved with ground-based telescopes.
Unfortunately, gravitationally lensed images of a given object tend to have very different brightnesses among each other. Accordingly, the observation of at least two images sufficiently bright to be observed while simultaneously resolving the absorption lines had to wait for the light-gathering power of the new generation of large optical telescopes (Rauch 1998; Rauch, Sargent and Barlow, in prep.).
In the first of a series of papers on the small scale properties of high redshift (z) structures we report here on spectra obtained with the HIRES instrument (Vogt et al. 1994) at the Keck I telescope. The A (V=16.7) and C (V=17.3) images of the QSO 1422+231 (=3.628, Patnaik et al. 1992) have been observed during three runs in the spring of 1998, with total exposure times of 19600 (33200) seconds for the A image (C image). As the angular separation between the images is only about 1.3 arcseconds, only spectra obtained when the seeing was less than 0.6” were included, a condition which was satisfied at the end of a few nights when the seeing sometimes dropped below 0.5”. A arcsecond wide decker (giving a spectral resolution FWHM=4.4 kms-1) was placed separately on each image, with the position angle set such as to minimize contamination from the other images. When the seeing threatened to deteriorate the slit was shifted slightly off the center of an image away from the other images. We estimate the contamination of our exposures of the A and C images by each other to be at most a few percent. The absence of significant contamination can also be judged from the fact that strong differences are observed between the LOS in the appearance of some absorption systems.
The redshift of the lens is believed to be zl=0.338 (see Kundic et al 1997, Tonry 1997). Combined with the small angular splitting, this low redshift leads to transverse beam separations of less than 100 pc as far as 10 Mpc or more away from the QSO where any intervening matter is less likely to be dynamically influenced by the quasar.
2 The z=3.538 Metal Absorption System
2.1 Description
Most of the absorption lines in the spectra of the A and C images look very similar because of their small separation (see also Bechtold & Yee 1995, Petry et al. 1998, Rauch 1998). However, striking differences are found in the appearances of some low ionization metal absorption systems. In particular, a strong system at z=3.538 for which both low (OI, SiII, CII) and high (CIV, SiIV) ionization lines can be observed appears to hold clues as to the small scale properties of the absorbing gas clouds (Fig. 1). The origin of the (proper) velocity scale in the figure has been arbitrarily set to coincide with redshift z=3.53792. The beam separation here is only 26h pc, corresponding to an effective angular resolution of 3.8 milliarcsecs (for =0.5). The system is blueshifted with respect to the QSO’s (CIV) emission line by about 6000 kms-1 in the rest frame of the QSO. The actual velocity difference is likely to be even somewhat larger because of the blueshift commonly observed between broad and narrow (”systemic”) emission lines (Espey 1993, and references therein). It is not a priori clear whether the absorbing gas clouds are being ejected from the QSO (in which case all or a part of the redshift difference would be due to the velocity and the gas could be very close to the QSO), or whether they belong to a separate galaxy, a question we will discuss below. If independent from the QSO, the absorbing clouds are at a proper luminosity distance of 11.6 h Mpc from the QSO, if we adopt zem = 3.628 as the emission redshift, consistent with an origin in an intervening galaxy unrelated to the QSO.
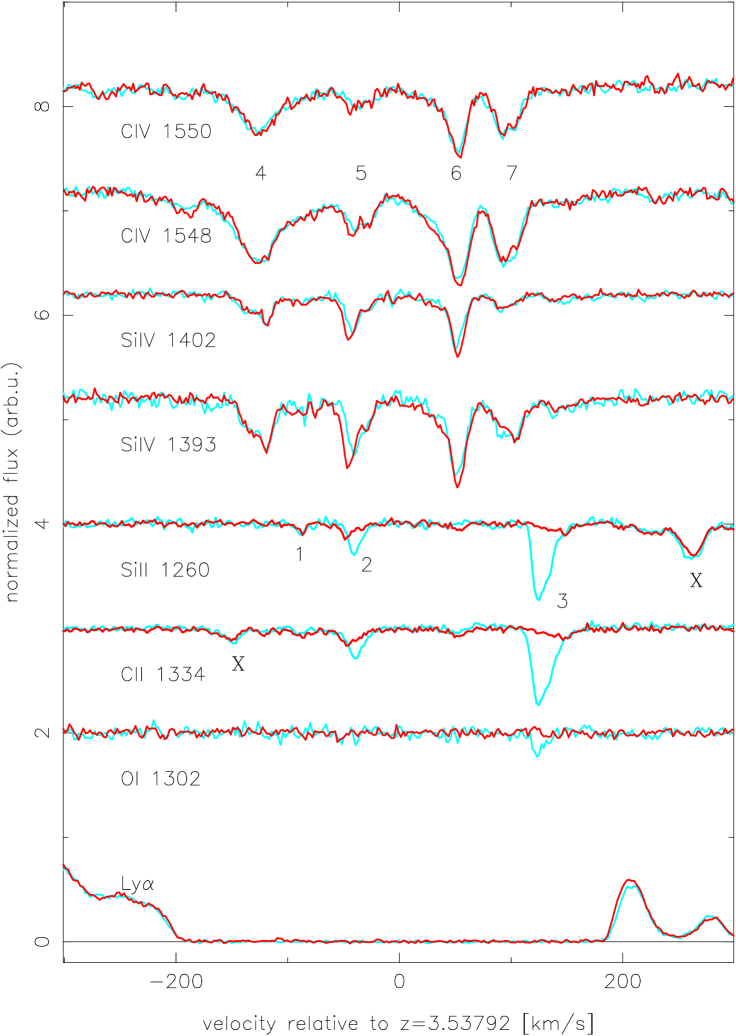
Figure 1. shows the absorption complex as it appears (going from top to bottom) in the CIV doublet, SiIV doublet, SiII, CII, OI and Ly. In each case, the solid line is the spectrum of the C image, the grey line that of the A image. For further reference we have numbered the strongest low ionization (1 – 3) and high ionization (4 – 7) components.
For this particular system the high and low ionization lines exhibit very different component structures. While the total velocity extent is similar ( kms-1) in both cases, only component 2 appears to be clearly present in all ions. It is further interesting that the CIV components in the two images seem to be identical within the errors. This lack of structure indicates that the typical gas cloud giving rise to CIV lines is larger than a few tens of parsecs. From more widely separated lines of sight (Rauch 1998; Rauch, Sargent and Barlow 1998) we also know that the structures producing individual CIV lines differ in column density by 50 % or more over a few hundred parsecs to a kiloparsec, so this range appears to be characteristic of the typical sizes of CIV “cloudlets”. The SiIV absorption patterns are also very similar between the two LOS, except for some slight but significant differences in the column density and/or velocity structure of component 2. The observed differences can be interpreted as a shift in column density weighted velocity by = kms-1 between the two lines of sight. A similar shift is also visible in SiII 1260 and CII 1334 ( kms-1 for component 2, kms-1 for component 3. However, the most striking difference is found between the low ionization column densities across the LOS (see table 1). Component 2 has a SiII (CII) column 2.1 (2.4) times larger in the A image; the strongest low ionization component 3 is even 10.5 (10.0) times stronger in the A than in the C image.
2.2 Physical State and Mass11affiliation: Unless other components are mentioned explicitly the analysis below will be focussed on the strongest low ionization component (# 3) in the A image.
Constraints on the ionization parameter, metallicity and density of the absorbing gas can be obtained by using observations of several ions (e.g., Bergeron & Stasinska 1986, Chaffee et al. 1986, Steidel 1990, Donahue & Shull 1991). First, we note that the system #3 is apparently optically thin to ionizing radiation, which is somewhat surprising given the strength of the low ionization lines SiII and CII. From a direct Voigt profile fit to several lines of the Lyman series (up to Ly 7) we get (HI)=16.050.15 (with measured in units of cm-2) for component # 3, in LOS A; the error gives only the uncertainty of the fit. For most of the Lyman series except Ly there may be additional systematic uncertainties in both the continuum and zero level placement, and the systematic error may be considerably larger than that quoted above. Unfortunately the spectra are quite noisy in the blue and they do not cover the Lyman limit of the system. Thus the HI column density is not very precisely known, although trials (assuming the same Doppler parameter = 21 kms-1) show that a column density of =16.5 is clearly too high. Accordingly, unless the Doppler parameter is much smaller and the line is unresolved even at our resolution, the aforementioned value is a conservative upper limit. (The system in question has been detected in earlier observations of Q1422+231 by ourselves and independently by Songaila & Cowie (1996) who find a total HI column density (HI)=2.3 cm-2. However, these older spectra were not taken for the purpose of splitting the contributions from separate images.) A comparison of the absorption line strength between low and high ionization species shows immediately that the gas of component 3 must be of rather low ionization. We have used the results of the photoionization calculations of Donahue & Shull (1991; hereinafter DS) summarized in their figure 7 (they used a typical QSO spectrum after Matthews & Ferland (1987), and a metallicity = 0.1 , assuming solar relative abundances). Our observed column density ratios of neutral oxygen to singly ionized carbon,
| (1) |
imply an ionization parameter
| (2) |
in agreement with the upper limit from the SiII/SiIV ratio
| (3) |
The total H density , again according to DS, is then
| (4) |
respectively, for the two values where is the intensity of the radiation field at the Lyman limit averaged over steradians,in units of ergs cm-2 Hz-1 s-1 sr-1.
In spite of its low HI column density the neutral fraction of the gas must be as large as 0.15 (0.014) for = –4.4 (–3.4). For = 10-21 ergs cm-2 s-1 Hz-1 sr-1, and using the inferred H density, HI column density, and neutral fraction we get a size estimate along the line of sight,
| (5) |
It is important to bear in mind that these derivations are assuming thermal photoionization equilibrium with a QSO radiation field, which may not be very realistic.
An independent upper limit on the density can be obtained from the absence of the (J=) fine structure transitions in CII*() and SiII*() (Bahcall & Wolf 1968; York & Kinahan 1979). Here CII* gives a somewhat tighter upper limit than SiII*. We observe
| (6) |
from which we get an approximate upper limit on the electron density of
| (7) |
(valid for temperatures above a few hundred Kelvin). Assuming that most of the gas is ionized, , an upper limit close to the maximum density allowed by the DS photoionization models is obtained, implying that the density must be somewhere in the range
| (8) |
We know that the transverse size of the clouds (i.e., the distance over which the column density decreases by a factor 10) is on the order of 26 pc. The gas mass associated with the cloud can then be estimated very crudely to lie between that of a homogeneous, cylindrical slab of size L (assuming the smallest value for L and a radius ) on one hand, and (ignoring the photoionization size estimates) a spherical cloud with a radius and the high density limit on the other:
| (9) |
The assumption of homogeneity is of course questionable. In any case, the scale indicates that, for the first time we are resolving structure on scales relevant to individual star clusters or even single stars in a high redshift galaxy.
The remaining absorption components visible in CII and SiII appear to have less extreme ionization states. Component 2 appears in all ions except OI. The ionization parameter (in LOS A) is measured to be
| (10) |
typical for stronger high ionization systems when both SiIV and CIV are detected. In deriving U it is assumed that the singly ionized and triply ionized gas clouds have the same spatial extent. In general, this is not true as can be seen directly from the larger sizes inferred for most CIV systems. However, for this particular component the CIV (and SiIV) both seem to trace the shift in the velocity between the LOS seen in the low ions reasonably well, so most of the CIV here may indeed occupy a similar volume as the CII.
The other high ionization components 4, 6 and 7 are unexceptional in that there are hardly any column density or velocity differences between the LOS, and the ionization level is consistent with the observed range of CIV systems. For example, for component 6, –2.5. This is in spite of the relative proximity of the QSO; one would expect a higher degree of ionization if the QSO’s radiation field dominates over the metagalactic background. We have tried to detect NV absorption, a characteristic sign of gas associated with the large ionizing intensity near the QSO, at the positions of the known CIV components, weighted by the model CIV column density ratios. Only an upper limit of (NV) 12.25 (1-) for the total NV column of the z=3.538 system was found. Compared with the total CIV column (CIV) = 14.34 this leads to an upper limit on the averaged ionization parameter –3.2. This is somewhat less than the U values measured for the individual high ionization components from other ion ratios (see above) and it may imply that either the nitrogen abundance is lower than solar relative to C or Si, or that there is a lack of high energy photons capable of ionizing NIV, as is indeed expected for a radiation field dominated by starlight.
2.3 Temperatures
In the case of the high ionization component 4, the absorption line can be modelled as three relatively broad components. Even the apparently narrow ”Gaussian core” of the line requires a component with b = 14 kms-1, corresponding to a temperature of 1.5105 K, if thermal. This b value is considerably larger than the typical thermal width of CIV lines (kms-1, corresponding to K; Rauch et al. 1996). The broad wings are not repeated in the SiIV profile, perhaps implying that additional hot (collisionally ionized) gas contributes to the CIV profile. However, cooler gas is present as well. Lines 6 and 7, while also containing assymmetric broad wings, do have cores more similar to typical CIV widths : line 6 has a dominant component with = 8.9 kms-1, line 7 one with = 6.4 kms-1; both lines are consistent with mostly thermal broadening caused by photoionization.
The low ions clearly show lower temperatures. Returning to component 3, the line appears to be a blend of several components, which can be modelled as three Voigt profiles. The sharp blue wing of CII (SiII) is well-fitted by = 4.10 kms-1 (3.95 kms-1). The similarity of the values indicates that bulk motion is more important than thermal broadening. Thus we have an upper limit to the temperature, 1.2104 K.
2.4 Metallicities
The metal abundance of at least one component of the system appears to be rather high. Using the measured OI/CII ratio of component 3 together with the relations between ion abundance and U parameter from DS, we predict ((OI)/(HI)) –4.0, whereas, from the measured N(HI) we would expect ((OI)/(HI)) –2.8. Similarly, the predicted ((SiII)/(HI)) –4.2, in contrast to the measured –3.2. The DS model was for a metallicity , so raising the abundances to approximately solar gives consistent values. The relative abundances appear to be close to solar as well. Assuming that the ionization parameter = –4.4 (derived from the OI/CII ratio) holds, the CII/SiII ratio is expected to be ((CII)/(SiII)) 1.1, not very different from any of the observed values for ((CII)/(SiII)) given in table 1. Even if if the O/C would be higher than solar (as in metal poor stars) so that the true ionization parameter would be higher than estimated here, the conclusion that Si/C is solar would still hold, as CII/SiII is rather insensitive to the ionization parameter.
3 Possible Interpretations: Ejected Gas or Intervening Galaxy ?
Given the relative proximity of the system to the QSO one may wonder whether the gas is possibly ejected from the QSO host galaxy, and therefore to be classified among the so-called systems. The main properties of these systems are: absorption redshift close to or beyond the emission redshift of the QSO; only partial coverage of the QSO’s emission region; high (super-solar) metallicity; and a high ionization state caused by the AGN radiation field, evident for example through the presence of NV. Petitjean, Rauch & Carswell (1994) have found high metallicity systems out to 13000 kms-1 from the QSO emission redshift, and with a velocity separation of kms-1 the z=3.538 system is within that range. However, the HI lines corresponding to components 2 and 3 do go down to zero intensity so the clouds must be covering the QSO continuum and line-emitting regions completely. Moreover, we do not find NV in any of the components down to limits lower than any of the individual NV upper limits or detections in the Petitjean et al data, nor do we detect (see above) high [Si/C] ratios as did Savaglio, D’Odorico & Møller (1994) in their sample. Models of galactic chemical evolution (Matteucci & Padovani 1993) show that the presently observed abundance pattern (C, Si solar, N solar), unlike the pattern seen in many QSO emission line spectra and many systems (N, Si enhanced by up to an order of magnitude, C and O solar) can be produced in the very early phases of galactic nucleosynthesis, shortly after the onset of the first star burst in an elliptical galaxy ( a few 108 years), even before the QSO abundance anomalies (e.g., Hamann 1997) are established. Nevertheless, it cannot be excluded that the system is ejected or at least dynamically influenced by the QSO. Radiation pressure or ram pressure from outflows may explain why the lower density, high ionization gas seems to be blueshifted with respect to the denser low ionization clumps, from which the CIV gas may have been ablated like a cometary tail.
If, however, the absorption system is not influenced dynamically by the QSO, where do the small scale velocity variations across the LOS come from ? On a scale of 26 pc, the velocity shear observed most prominently in components 2 and 3 (about 10 km/s) is on the order of kms-1 kpc-1 (across the sky, and projected along the LOS). This is too large to be caused by rotation on a galactic scale. Therefore, we must look to local gas dynamics for an explanation of the observed motions. It turns out that an expanding shell of gas gives a consistent explanation for the observed velocity and column density pattern (Fig. 2): closer inspection shows that the components 2 and 3 are weaker in the C spectrum; they are also more widely spaced than in A, and they exhibit asymmetric tails pointing towards each other. Fig. 2 shows (in a schematic drawing) how this pattern can arise if we are looking along two LOS intersecting an expanding spherical shell, where one of the LOS intersects the expanding gas more peripherally than the other. The velocity shear projected along the LOS is caused by the projected expansion velocity, being smaller than on account of the more tangential contact of LOS A. The longer path length of LOS A through the shell also may account for the higher column density of the absorption lines in A. The fact that there is a noticeable velocity difference means that the radius of the shell (always presuming a spherical homogeneous geometry) is indeed not much larger than the transverse beam separation = 26 pc. For a spherical shell, the radius is linked to the impact parameters of the LOS from the center of the shell, and , the beam separation and the observed velocity separations between the two absorption lines supposed to be caused by the expanding shell (2 and 3) and by
| (11) |
where =0.84 (the velocity separations are measured between the peaks of the components 2 and 3). Since can vary between and , we find
| (12) |
Since the absolut impact parameters of the LOS from the center of the shell are unknown we can only get a lower limit to the velocity of expansion from the velocity width measured between the absorption maxima of components 3 and 4 along LOS C:
| (13) |

4 Discussion
We can summarize the main findings as follows: low ionization QSO absorption systems (as defined by the presence of singly ionized Si, C, etc) can be very small entities changing significantly over scales of tens of parsecs. This appears distinct from the properties of the high ionization gas (CIV systems) the density and velocity structure of which changes only over separations exceeding a few hundred parsecs (Rauch 1998, Rauch, Sargent, & Barlow in prep.). Our directly measured sizes clearly confirm longstanding predictions based largely on ionization arguments (Sargent et al. 1979, Bergeron & Stasinska 1986, Giroux, Sutherland & Shull 1994, Petitjean, Riediger & Rauch 1996) that the absorption indeed arises in an inhomogeneous gas with several ionization phases and different spatial extent.
To explain the finding of velocity differences over tens of parsecs we must conclude that low ionization QSO absorption systems derive their internal velocity dispersion from local gas dynamics, either originating from the host galaxy of the background QSO itself, or from stellar sources of momentum in an intervening galaxy. While the relatively high metallicities together with the proximity (in velocity) to the background QSO are consistent with the gas being associated with the QSO host galaxy, the low ionization state, full coverage of the QSO emission regions, and the absence of peculiar abundance patterns argue against this possibility.
It is hard to say what the precise origin of these absorption features is. We have argued here that an expanding gas shell like a bubble blown by a stellar wind or a supernova, while not being a unique explanation, is quite consistent with the data. Indeed, Shi (1995) has drawn attention to the possibility, that supernova type II shells may explain the large velocity dispersions often seen in CIV systems. Simulations of the formation of high redshift galaxies indicate that the velocity width of typical CIV systems is more likely to reflect the velocity structure of larger, galaxy forming regions (e.g., Rauch, Haehnelt & Steinmetz 1997) than individual SN, but we suggest here that a supernova or stellar wind origin may well be more relevant for the denser environment of some of the low ionization systems, possibly associated with galactic disks or the denser regions of halo clouds. As Shi (1995) points out, a ”standard” type II supernova explosion energy release (1051 ergs) is sufficient to accelerate 10 of matter to an expansion velocity of 100 kms-1, which is well consistent with the energy requirements in the present case.
Summarizing, it appears that the two-dimensional information provided by close multiple LOS allows us for the first time to resolve the spatial and kinematic structure of an individual low ionization absorption system. At the same time, this observation demonstrates that with the new generation of large optical telescopes we are now in a position to study the interstellar medium at arbitrarily high redshift. It is likely that such observations will reveal familiar astrophysical environments like supernova shells or stellar winds. The much earlier stage in the cosmic development at z 3.5 (for example, the influence of shallower potential wells on the gasdynamics, the onset of nucleosynthesis as a function of the density of the environment, etc) may ultimately show up in larger data sets of this kind.
Judging from a single case it is not possible to say whether small scale motions in general play a role as important as suggested here, even if most of the low ionization clumps should indeed have a local, stellar origin. But if so, the measured velocity dispersion of an absorption system, consisting of the quadratic sum of the local velocity dispersion (for example, , if caused by an expanding shell), and the galactic large scale motion, may receive a dominant contribution from the former. In that case attempts at modelling the kinematics of absorption systems solely in terms of gravitational motions (e.g., as rotation of galactic disks) may be overestimating the depth of the underlying galactic potential wells.
Finally, the success of a future statistical study of the high redshift ISM with this method at present crucially depends on more bright, high redshift (z 2) lensed QSOs being found with at least two bright images and image separations in excess of 1 – 1.5 arcsec. Unfortunately, a typical lensed QSO usually has (if at all) only one image bright enough (V19) for spectroscopy with a 10m class telescope, and shows image separations of less than 1.5 arcsec so that the majority of lensed objects are just not accessible to high resolution observations. Thus, a promising future observational approach, providing the spatial resolution necessary to split the images and at the same time the needed higher signal-to-noise ratio, will probably involve adaptive optics in conjunction with an optical or infrared high resolution spectrograph.
References
- (1) Bahcall, J.N., Wolf, R.A., 1968, ApJ, 152, 701
- (2) Bechtold, J., Yee, H.K.C., 1995, AJ, 110, 1984
- (3) Bergeron, J., Stasinska, G., 1986, A&A, 169, 1
- (4) Chaffee, F.C., Foltz, C.B., Bechtold, J., Weymann, R.J., 1986, ApJ, 301, 116
- (5) Donahue, M., Shull, M., 1991, ApJ, 383, 511
- (6) Espey, B.R., 1993, ApJ, 411, L59
- (7) Foltz, C.B., Weymann, R.J., Roeser, H.-J., 1984, ApJ, 281, L1
- (8) Giroux, M.L., Sutherland, R.S., Shull, J.M., 1994, ApJ, 435 L97
- (9) Hamann, F, 1997, ApJS, 109, 279
- (10) Kundic, T., Hogg, D.W., Blandford R.D., 1997, AJ, 114, 2276
- (11) Lopez, S., Reimers, D., Rauch, M., Sargent W.L.W., Smette, A., astro-ph/9806143, (submitted to ApJ)
- (12) Matteucci, F., Padovani, P., 1993, ApJ. 419, 485
- (13) Matthews, W.D., Ferland, G, 1987, ApJ, 323, 456
- (14) Michalitsianos, A.G., Dolan,J.F., Kazanas D., Bruhweiler, F.C., Boyd, P.T., Hill, R.J., Nelson, M.J., Percival, J.W., van Citters, G.W., 1997, ApJ, 474, 598
- (15) Patnaik, A.R., Browne, I.W., Walsh, D., Chaffee, F.H., Foltz, C.B., 1992, MNRAS, 259,1P
- (16) Petry, C.E., Impey C.D., Foltz C.B., 1998, ApJ, 494,60
- (17) Petitjean, P., Rauch, M., Carswell, 1994, A&A, 281, 331
- (18) Petitjean, P., Riediger, R., Rauch, M., 1996, A&A, 307, 417
- (19) Rauch, M., Sargent, W.L.W., Womble, D.S., Barlow, T.A., ApJ, 467, L5
- (20) Rauch, M., Haehnelt, M.G., Steinmetz M., 1997, ApJ, 481, 601
- (21) Rauch, M., in ”Structure and Evolution of the IGM from QSO Absorption Lines”, Proccedings of the 13th IAP Colloquium, 1997; ed. Petitjean, P., Charlot, S.
- (22) Rauch, M., Sargent, W.L.W., Barlow T.A., 1998, in ”The Young Universe”, ASP Conference Series 146, 167; eds. D’Odorico, S., Fontana, A., Giallongo E.
- (23) Sargent, W.L.W., Young, P.J., Boksenberg, A., Carswell, R.F., Whelan J.A.J., 1979, ApJ, 230, 68
- (24) Savaglio, S., D’Odorico, S., Møller, P., 1994, A&A, 281, 331
- (25) Shi, X., 1995, ApJ, 449, 140
- (26) Smette, A., Surdej, J., Shaver, P.A., Foltz, C.B., Chaffee, F.H., Weymann, R.J., Williams, R.E., Magain, P. 1992, ApJ389,39
- (27) Smette, A., Robertson, J.G., Shaver, P.A., Reimers, D., Wisotzki, L., Koehler, T., 1995, A&A113,199
- (28) Songaila, A., Cowie, L.L., , 1996, AJ, 112, 335
- (29)
- (30) Steidel, C.C., 1990, ApJS, 74, 37
- (31) Tonry, J.L., 1998, AJ, 115, 1
- (32) Vogt, S.S., Allen, S.L., Bigelow, B.C., Bresee, L., Brown, B., et al., 1994, S.P.I.E, 2198,362
- (33) Weymann, R.J., Foltz, C.B., 1983, ApJ, 272, L1
- (34) York, D.G., Kinahan, B.F., 1979, ApJ, 228, 127
- (35) Young, P.J., Sargent, W.L.W., Boksenberg, A., Oke, J.B., 1981, ApJ, 249,415
- (36) Zuo, L., Beaver, E.A., Burbidge, E.M., Cohen, R.D., Junkkarinen, V.T., Lyons, R.W., 1997, ApJ, 477, 568
| comp. | 1 | 2 | 3 | |||||||
|---|---|---|---|---|---|---|---|---|---|---|
| LOS | A | C | A | C | A | C | ||||
| SiII | 11.53 | 11.37 | 12.13 | 11.81 | 12.82 | 11.80 | ||||
| 0.11 | 0.08 | 0.03 | 0.04 | 0.01 | 0.05 | |||||
| CII | 12.05 | 12.18 | 13.14 | 12.76 | 13.73 | 12.73 | ||||
| 0.12 | 0.14 | 0.03 | 0.04 | 0.01 | 0.06 | |||||
| OI | 12.7 | 12.7 | 12.7 | 12.7 | 13.27 | 13.0 | ||||
| SiIV | – | – | 12.77 | 12.85 | 12.0 | 12.0 | ||||
| 0.05 | 0.06 | |||||||||
| CII/SiII | 0.52 | 0.81 | 1.01 | 0.95 | 0.91 | 0.93 | ||||
| 0.16 | 0.16 | 0.04 | 0.06 | 0.01 | 0.08 | |||||