Star cluster ecology III: Runaway collisions in young compact star clusters
Abstract
The evolution of young compact star clusters is studied using -body simulations in which both stellar evolution and physical collisions between stars are taken into account. The initial conditions are chosen to represent R 136, a compact star cluster in the 30 Doradus region of the Large Magellanic Cloud. The present runs do not include the effects of primordial binaries.
We find that physical collisions between stars in these models are frequent, and that the evolution of the most massive stars and the dynamical evolution of the cluster are closely coupled. In all cases, a single star grows steadily in mass through mergers with other stars, forming a very massive () star in less than 3–4 Myr. The growth rate of this runaway merger is much larger than estimates based on simple cross-section arguments, mainly because the star is typically found in the core and tends to form binaries with other massive stars there. The runaway is “rejuvenated” by each new collision, and its lifetime is extended considerably as a consequence. Observationally, such a star will appear in the Hertzsprung-Russell diagram as a blue straggler. When the runaway forms a black hole, the binary in which it is found is usually dissociated.
We further investigate the sensitivity of the runaway to different formulations of mass loss from high-mass main sequence stars. We find that, while the runaway process is less pronounced in the presence of strong stellar winds, the basic effect persists even in the face of large mass loss.
Key words: binaries: close — blue stragglers — stars: evolution — stars: mass losss — globular clusters: general — globular clusters: 30 Doradus
1 Introduction
Physical collisions between stars are not rare in the central regions of star clusters or galaxies. In some star clusters, and in the cores of many galaxies, stellar collisions are likely to play an important role in the formation of exotic objects such as blue stragglers (Sanders 1970; McNamara & Sanders 1976), X-ray binaries (Fabian et al.1975) and millisecond pulsars (Lyne et al. 1987; 1988). Collisions may also be responsible for the color gradient observed in several post-collapse globular clusters (Djorgovski et al.1991), and the formation of central black holes in galactic nuclei (Quinlan & Shapiro 1990; Quinlan et al.1995, Lee 1995). Collisions in proto-clusters may be responsible for the formation of massive stars (Bonnell et al. 1998), and possibly even the entire mass spectrum (Silk & Takahashi 1979; Allen & Bastien 1995; Price & Podsiadlovski 1995)
In order to quantify the effect of collisions on the evolution of stars and the corresponding changes in the stellar population, Portegies Zwart et al. (1997, hereafter paperI) performed population synthesis calculations which included stellar collisions. In those calculations the stellar number density was held constant, thus excluding the possibility of any interplay between the dynamical evolution of the cluster and collisions between stars.
In reality, both the stars and the parent cluster evolve on comparable time scales, and cluster dynamics and stellar evolution are quite closely coupled. For example, massive stars tend to segregate to the core due to dynamical friction, increasing their collision probability. Their collision products are even more massive, leading to the possibility of runaway merging (Lee 1987; Quinlan & Shapiro 1990), if the collision rates can remain high enough in the few Myr before the stars explode as supernovae. However, these rates are determined by the dynamical state of the cluster, which is in turn strongly influenced by stellar mass loss. The only way to treat this intimate coupling between stellar collisions and cluster dynamics is to perform N-body simulations in which the stars are allowed to evolve and collide with one another in a fully self-consistent way.
In this paper we report the results of a series of N-body simulations modeling young and compact star clusters, such as R 136 in the 30 Doradus region in the Large Magellanic Cloud. This cluster is particularly interesting because a strong coupling between stellar evolution and stellar dynamics may exist. In addition to this, excellent observational data is available. Many unusually bright and massive stars (e.g. Massey & Hunter 1998) are present in R 136 which, due to the high central density of to stars pc-3, are likely to interact strongly with each other.
The numerical method is discussed in Sect. 2. Sect. 3 describes in more detail the initial conditions for our models. In Sect. 4 the results are presented; they are discussed in Sect. 5. Briefly, we find that runaway collisions of massive stars can occur. The most massive star grows in mass through merging with other stars until it collapses to a black hole. The growth rate of this star is much larger than estimates based on simple cross-section arguments, because the star is typically found in the cluster core, and tends to form binaries with other massive stars.
2 Numerical method
The N-body integration algorithm, used in this paper, is described in Sect. 2.1. In Sect. 2.2 we describe how the evolution of stars are calculated; the effect of collisions on the evolution of stars is described in Sect. 2.3.
2.1 The N-body integrator
The N-body portion of the simulations is carried out using the kira integrator, operating within the Starlab software environment (McMillan & Hut 1996; Portegies Zwart et al. 1998). Time integration of stellar orbits is accomplished using a fourth-order Hermite scheme (Makino & Aarseth 1992). Kira also incorporates block timesteps (McMillan 1986a; 1986b; Makino 1991) special treatment of close two-body and multiple encounters of arbitrary complexity, and a robust treatment of stellar and binary evolution and stellar collisions (see below). The special-purpose GRAPE-4 (Makino et al. 1997) system is used to accelerate the computation of gravitational forces between stars. The treatment of stellar mass loss is as described in Portegies Zwart et al. (1998). A more complete description the Starlab environment is in preparation.
2.2 Stellar evolution
The evolution of stars is taken from the prescription by Portegies Zwart & Verbunt (1996, Sect. 2.1). However, some changes are made to the mass loss in the main-sequence stage for massive stars.
2.2.1 Mass loss from main-sequence stars
The original equations from Eggleton et al. (1989), on which the stellar evolution model is based, ignore mass loss during the main sequence stage. However, for stars more massive than 25 , mass loss on the main sequence can be substantial. We use three different prescriptions to investigate the effect of main-sequence mass loss.
The first prescription simply follows Eggleton et al., and no mass is lost on the main-sequence. In these cases, a massive star loses its entire hydrogen envelope when it leaves the main-sequence and becomes a Wolf-Rayet star. We refer to this prescription as no mass loss.
In the second prescription the mass loss rate for a massive main-sequence star is taken to be constant in time, in such a way that, as it leaves the main sequence, the star has lost its entire hydrogen envelope. We refer to this type of mass loss as constant mass loss.
In the third and most realistic treatment, a massive star loses its hydrogen envelope during the main-sequence phase according to the law
| (1) |
This treatment is supported by model computations for massive stars by Schaerer et al. (1999). We refer to this type of mass loss as moderate mass loss.
In several cases the mass of collision products exceeds (the most massive evolutionary tracks available, see Schaerer et al. 1992). Very little is known about the evolution of such massive stars (see Stothers et al. 1997; de Koter et al. 1998 and Figer et al. 1998). We assume that for such high mass stars the lifetime and the radius depends weakly on mass (see Langer et al. 1994). In our model a 100 star has a main-sequence lifetime of 3.08 Myr; a 150 star lives for 2.98 Myr.
2.2.2 Supernovae and velocity kicks
A star with a mass larger than 40 leaves a black hole after ejecting its envelope during the main-sequence and Wolf-Rayet phases. The mass of the black hole is computed as , where is the initial mass of the star. For a star whose mass increases due to collisions, is the highest mass reached by the star.
Stars with masses between 8 and 40 become neutron stars. At birth a neutron star receives a high velocity ‘kick’ in a random direction. The magnitude of the velocity kick is chosen randomly from the distribution proposed by Hartman (1997). This distribution is flat at velocities below 250 , but has a tail extending to several thousand .
Stars with masses less than 8 become white dwarfs. The mass of the white dwarf equals the core mass of its progenitor at the tip of the asymptotic giant branch.
2.3 Stellar collisions
A collision is assumed to occur when two stars ( and ) approach each other within a distance , where and are the radii of the stars involved.
2.3.1 The collision product
A detailed description of the treatment for collisions is given in paperI (section 3.3). Here we summarize the prescription for collisions between main-sequence stars.
A collision between two main-sequence stars with masses and results in a single rejuvenated main-sequence star with mass . Smooth-particle hydrodynamic simulations of collisions between main-sequence stars indicate that at maximum a few percent of the total mass is lost (see e.g.: Lai et al. 1993; Lombardi et al. 1995; 1996). Consequently, mass loss during the merger event is ignored.
The collision results in a reduction of the age of the collision product. The age reduction factor is computed from the mass of the most massive of the two colliding stars and the mass of the collision product (Meurs & van den Heuvel 1989)
| (2) |
Here is the main-sequence lifetime of a star with mass . The new age of the collision product is computed with .
As an example, suppose that, at Myr, a star with collides with a second star with . Both stars lie on the main sequence, and both are experiencing a collision for the first time (i.e. Myr for both stars). For a 20 star, Myr. The collision results in a main-sequence star with a mass of 28 , for which Myr. The new age of the collision product is computed using Eq. (2), which in this case gives Myr.
3 Selection of initial conditions
We selected the initial parameters for the models to mimic class of star clusters similar to the Galactic cluster NGC 3606 or the young globular cluster NGC 2070 (R136) in the 30 Doradus region of the Large Magellanic Cloud.
3.1 The star cluster R 136 in the 30 Doradus region
The half-mass radius () of R 136 is about 1 parsec (Brandl et al. 1996), and the core radius is pc (Hunter et al. 1995). The total mass . With an assumed mean mass of 0.6 the cluster thus contains about 35 000 stars. The corresponding central density is of the order of pc-3. The age of R 136 is –4 Myr (Campbell et al. 1992). The Galactic star cluster NGC 3606 is somewhat smaller in size and its total mass is larger resulting in a denser core (Moffat et al. 1994; Drissen et al. 1995).
For both clusters, the tidal effect of their parent galaxy (for R 136 that is the Large Magellanic Cloud) is small. Assuming that the mass of the LMC is and the distance from the center of the LMC is kpc, the tidal radius,
| (3) |
is pc, much larger than the half-mass radius of either cluster, justifying our neglect of tidal effects.
Calculations are performed using 12k and 6k stars. Therefore we need to scale the dynamical timescale and the collision cross section to mimic the evolution of a star cluster with larger . This scaling is discussed in the following two sections.
3.2 Scaling the dynamical timescale
The evolution of an isolated star cluster is driven by two-body relaxation. Therefore, we set up the initial model so that it has the same relaxation timescale as the real cluster. The relaxation time is calculated with
| (4) |
Here is a scaling factor, introduced to model the effects of the cut-off in the long range Coulomb logarithm (see Giertz & Heggie 1996; 1994). Here is the half-mass crossing time of the cluster is
| (5) |
Here is its half mass radius.
3.3 Scaling the collision cross section
The model clusters should have the same collision rate per star as the real cluster. Scaling the initial conditions to assure that the model cluster has the same relaxation time causes it to be larger than the real system (Eq. 6). The correct collision rate per star is then obtained by scaling the sizes of the stars themselves.
The number of collisions per star per unit time is given by
| (7) |
Here is the number density of the stars in the core, is the collision cross section (for approach within some distance ), and is the velocity dispersion. These are given by the following proportionalities:
| (8) |
Here is the cluster’s core radius. We will neglect the term in the cross section. Expressed in real units and assuming scaling according to Eq. (6), we may write
| (9) |
The number of collisions then becomes
| (10) |
The distance at which a collision occurs therefore scales as
| (11) |
3.4 The models
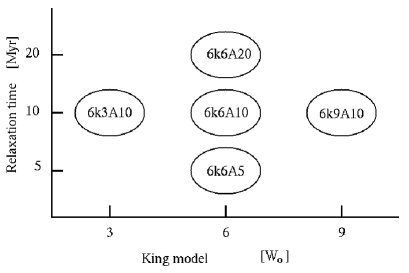
We performed 4 runs with 12k stars and 7 runs with 6k stars. All 12k runs start from the same initial conditions, except for the treatment of mass loss on the main sequence. For 6k models we also change the initial relaxation time and the initial density distribution. Table 1 and Fig. 1 summarize the initial conditions.
All simulations start at by assigning masses of stars between 0.1 and 100 from the mass function suggested for the Solar neighborhood by Scalo (1986). At the high-mass end this mass function is rather steep;
| (12) |
and the mass function turns over at around 0.3 . The median mass of this mass function is about 0.3 , and the mean mass is about 0.6 . We generate the mass distribution using the random sampling technique suggested by de la Fuente Marcos et al. 1997).
The initial density profile and velocity dispersion for the models with 12k stars are taken from a King (1966) model with . We chose pc, which results in a core radius pc and a core density of . The central velocity dispersion for these models is about 8.7 and the initial half-mass relaxation time Myr.
The names used to identify our models are defined as follows: We start with the number of stars: 12k for models with 12288 stars, and 6k for models with 6144 stars. The next integer identifies the selected value for . The next letter indicates the stellar mass loss model: ‘A’ for no mass loss, ‘B’ for constant mass loss and ‘C’ for moderate mass loss (see Sect. 2.2.1). The final number gives the initial half-mass relaxation time in millions of years. Two 12k6C10 models were computed. To distinguish between them, the second is identified as 12k6C10′. All computations were continued until Myr.
| Model | ||||||||||
|---|---|---|---|---|---|---|---|---|---|---|
| [Myr] | [Myr] | [pc] | [] | 19 | 25 | [] | ||||
| 12k6A10 | 12288 | 6 | 10 | 0.082 | 0.07 | 0.25 | 5.55 | 8 | 5 | 57 |
| 12k6B10 | 12288 | 6 | 10 | 0.082 | 0.07 | 0.25 | 5.56 | 7 | 4 | 63 |
| 12k6C10 | 12288 | 6 | 10 | 0.085 | 0.07 | 0.26 | 5.61 | 6 | 3 | 70 |
| 12k6C10′ | 12288 | 6 | 10 | 0.082 | 0.07 | 0.25 | 5.60 | 12 | 9 | 86 |
| 6k6A5 | 6144 | 6 | 5 | 0.076 | 0.05 | 0.19 | 5.64 | 1 | 0 | 22 |
| 6k3A10 | 6144 | 3 | 10 | 0.156 | 0.15 | 0.31 | 4.53 | 4 | 3 | 66 |
| 6k6A10 | 6144 | 6 | 10 | 0.158 | 0.10 | 0.31 | 5.02 | 2 | 0 | 21 |
| 6k9A10 | 6144 | 9 | 10 | 0.156 | 0.02 | 0.36 | 6.36 | 6 | 4 | 37 |
| 6k6A20 | 6144 | 6 | 20 | 0.314 | 0.14 | 0.47 | 4.44 | 0 | 0 | 15 |
| 6k6C10 | 6144 | 6 | 10 | 0.157 | 0.09 | 0.30 | 4.94 | 3 | 2 | 49 |
| 6k6C20 | 6144 | 6 | 20 | 0.314 | 0.14 | 0.48 | 4.45 | 3 | 1 | 32 |
4 Results
In this section we describe our results. Stellar collisions and the growth of massive stars are discussed in Sect. 4.1; Sect. 4.2 discusses evolution of the cluster structure, while Sect. 4.3 gives a detailed description of the evolution of the runaway collision product in one particular model (12k6A10). The results of the models with 6k stars are described in Sect. 4.4.
| Model | ||||
|---|---|---|---|---|
| [Myr] | ||||
| 12k6A10 | 1.7 | 11 | 11 | 5 |
| 12k6B10 | 0.9 | 10 | 5 | 2 |
| 12k6C10 | 0.3 | 21 | 15 | 4 |
| 12k6C10′ | 1.1 | 15 | 10 | 9 |

4.1 Runaway merging
Figure 2 gives the evolution of the mass of the most massive star for all k runs. In all cases, more than 10 collisions occurred during the first 5 Myr. In model 12k6A10 (no mass loss), a total of 11 collisions resulted in a star with a mass of 182 at the point when it left the main sequence.
From Fig. 2 we can see that the lifetime of the most massive star is considerably larger than its “natural” main-sequence lifetime of about 3 Myr. This extension of the lifetime is caused by rejuvenation through merging.
In other models, two massive stars collide with relatively low-mass stars before they eventually find each other. In models 12k6C10 and 12k6C10′ this happens at Myr, in model 12k6B10 at Myr.
Table 2 gives information about collisions in the k models. It typically requires about 1 million years –the time needed for the most massive stars to segregate to the core– before the first collision occurs (see Table 2). These most massive stars participate in more than 70% of all collisions. The most massive star in model 12k6C10 experiences its first collision at an earlier epoch because that star happened to be born in the core.
The number of collisions occurring in these runs is far larger than simple theoretical predictions. The rate at which stars in a cluster experiences collisions can be estimated as (Spitzer 1987). Here is the collision cross section, is the velocity dispersion in the cluster and is the number density of stars. Following the derivation in paperI by adopting a Maxwellian velocity distribution with velocity dispersion and cross section , the number of collisions is the cluster per Myr is expressed as (see paperI, Eq. 14)
| (13) | |||||
Here is the mean stellar mass.
For the k runs this results in about 0.3 collision/Myr, or about 3 collisions during the entire simulation, assuming that the cluster parameters do not change in time. As will be discussed in Sect. 4.2 below, the core density in fact drops by about an order of magnitude during the first 4 million years. If we take this effect into account, the expected number of collisions is less than unity. The actual number of collisions in the 12k simulations exceeds 10. The major cause of this large discrepancy is mass segregation, which concentrates massive stars in the core.
The importance of mass segregation is illustrated in Figs. 3 and 4. Figure 3 gives the theoretical probability distribution for stars with mass to collide with lower-mass stars of mass , for the initial Scalo (1986) stellar mass distribution. Figure 4 presents the distribution of collisions actually observed in our simulations.
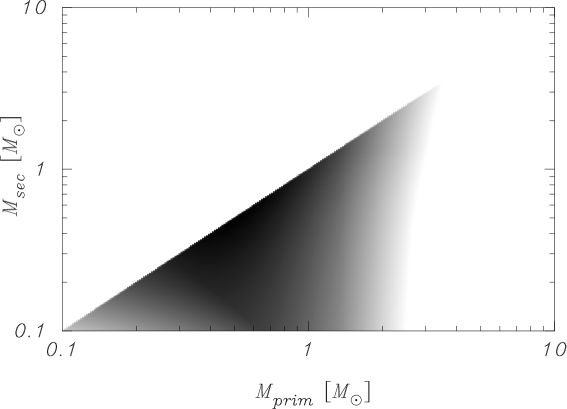

The differences between Fig. 3 and Fig. 4 are striking. In the -body simulations, massive stars completely dominate the collision rate, while theory predicts that the majority of collisions should occur between stars of relatively low mass ( ).
Figure 5 shows the effect of merging on the statistics of supernovae. The total number of supernovae is reduced due to merging of massive stars, and the explosions are delayed relative to expectations because of rejuvenation.

4.2 Evolution of cluster structure
The core and the cluster as a whole expand with time (see Fig. 6; for technical reasons, fewer snapshots of the first model were stored, leading to lower temporal resolution in the data displayed here). For model 12k6A10 this expansion is almost completely driven by binary heating. For the other models, mass loss in the stellar winds of the massive stars also drives the expansion. Although in these models the cluster loses a modest 4% of mass in the first 10 Myr, this mass is lost from deep inside the potential well of the cluster and affects the dynamics significantly.

Figure 7 shows the evolution of the mean stellar mass in the core. The initial mean mass in the cluster is . In the core, increases to about 1.1 in 1 Myr due to mass segregation. In model 12k6A10, keeps increasing until a maximum is reached at Myr. In model 12k6C10, the maximum is reached at Myr. This difference is in part due to the different treatments of mass loss from main-sequence stars.

Figure 8 shows the evolution of the core density for models 12k6A10 and 12k6C10. The expansion of the core causes to decrease during the first 4 million years.

4.3 Anatomy of a collision sequence
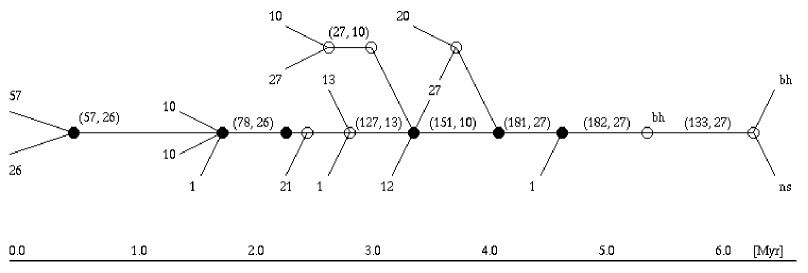
The first binaries in this model are formed shortly after the start of the simulation. One of these binaries is formed from the most massive star, of mass 57 , and a companion of 26 , with an initial semi-major axis of 0.03 pc. After more than ten collisions, the 57 star grows to 182 , before turning into a black hole of 133 .
As an illustration of the merger process, Fig. 9 depicts a schematic reaction network of the runaway merger in model 12k6A10.
At about 1 Myr the binary containing the most massive star encounters another binary. This second binary is dissociated, and its component stars are ejected from the cluster. The effect of this is noticeably in Fig. 10 in a steep rise in the binding energy of the remaining binary. Subsequently, a series of encounters with single stars results in three collisions involving the most massive star. The runaway collision product, still the member of a binary, devours two other stars between Myr and 3 Myr.
In the meantime a 27 star has formed a binary with another star. In the core an encounter between the two binaries results in a collision between the runaway merger and its 13 companion. This encounter dissipates most of the binding energy in the binary (see Fig. 10). The 27 star is ejected from the core to return again as the member of a binary.
The 27 star encounters the collision product again, the new companion of the 27 star collides with the runaway merger, and in addition the runaway merger collides again with its own companion; the 27 star takes its place.
Slightly after Myr the runaway merger collapses to a black hole after having consumed another 1 star. The binary survives but shortly afterward its companion (the 27 star) explodes in a supernova. The neutron star (remnant of the 27 star) receives a high velocity kick of , dissociating the binary. The black hole (remnant of the runaway merger) is also ejected.
Figure 10 plots the binding energy of the binaries and indicates some other important events for model 12k6A10. Similar figures are presented for model 12k6C10 in Fig. 11 and for model 12k6A10′ in Fig. 12


Once binaries form, they gradually become harder until a maximum binding energy is reached. At that point the primary coalesces with its companion, removing its binding energy from the system. The single star remaining after the merger captures a new companion, and the process repeats itself. Note that the term “binary” may be somewhat misleading here, as the runaway merger is usually the primary of a multiple system. The 8 “binaries” at Myr in model 12k6A10 are in fact a hierarchical system of 7 lower mass companions orbiting the runaway, which at that instant has a mass of 151 .
Most collisions occur between a member of a hard binary and an incoming star. Following the collision, the binary becomes softer. This is most clearly visible in Figs. 10 and 12. During an episode without collisions, the binding energy of binaries rises at a rate of (about 0.2% of the binding energy of the cluster) per million years.
4.4 Results of the 6k models
Table 3 provides information on the calculations with 6k stars. The average number of collisions for the 6k runs with an initial relaxation time of 10 Myr is . For the 12k runs the average number of collisions is . The fact that the collision rate per star per unit time is about the same in both sets of models suggests that we may be able to extrapolate our results to larger numbers of stars.
| Model | ||||
| [Myr] | ||||
| 6k6A5 | 1.2 | 21 | 21 | 1 |
| 6k3A10 | 2.6 | 4 | 1 | 3 |
| 6k6A10 | 2.1 | 9 | 7 | 1 |
| 6k9A10 | 0.6 | 6 | 4 | 6 |
| 6k6A20 | 5.2 | 3 | 0 | 0 |
| 6k6C10 | 1.2 | 9 | 5 | 1 |
| 6k6C20 | 2.7 | 5 | 3 | 1 |
The results for models with different initial relaxation times indicate that the collision rate is indeed inversely proportional to the relaxation time, consistent with Eq. (13). On the other hand, the initial central density has a rather small effect on the total number of collisions, even though the densities range over two orders of magnitude.
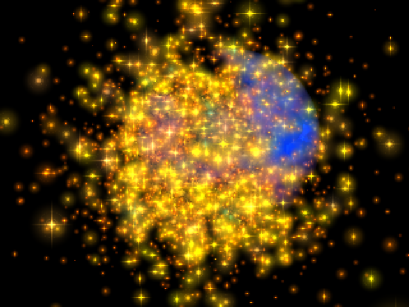
The colors of the stars represent temperature. A collision product flares up in bright white. A supernova produces a bright violet star together with a slowly expanding shell-like structure.
Figure 13 shows a picture of the simulated cluster (model 12W6A10) from a distance of 2 parsec. An animation of the cluster can be seen at the following address: http://www.sns.ias.edu/starlab/research/30Doradus/ (http stands for uniform resource locator. The mpeg (Moving Picture Expert Group) animation shows the evolution of star cluster 12k6A10 from birth to about 7 Myr. In the beginning we look at the density center of the cluster from a distance of 30 pc (). Then we zoom in with a velocity of about 29 to a distance of 3 pc ().
5 Discussion
We have studied collisions in young star clusters with 6144 stars and 12288 stars. The initial conditions of the models are selected to mimic stellar systems with a larger number of stars. The observed number of collisions is proportional to the number of stars, implying that our choice of scaling for time and stellar radius are appropriate. We therefore expect that the collision rate in our models can be extrapolated to richer star clusters. The star cluster R 136, for example, contains about 3 times as many stars as the modeled clusters. Scaling our results means that the collision rate in R 136 is about 8 Myr-1.
The absence of primordial binaries in our calculations possibly affects the collision rate and the collision counterparts significantly (see Kroupa 1997; 1998). It is, however, not trivial to estimate the effect of the presence of a large fraction of primordial binaries; apparently it is not even easy to estimate the collision rate of a population of single stars correctly.
5.1 The blue stragglers in R 136
The small age of the star cluster R 136 of –4 Myr and the time needed for the first collisions to occur (about 1 Myr) suggests that about 20 collisions could have occurred in this cluster. The result of these collisions should therefore still be visible, possibly in the form of massive blue stragglers (Sandage 1953; Leonard & Duncan 1990; Leonard 1995; Sills et al. 1997) in the cluster core.
The three most massive stars in R 136 have spectral type WN4.5 and appear to be younger than the other stars. Their age is estimated to be about 1 Myr (Massey & Hunter 1998; de Koter et al. 1997). These stars show violet absorption edges, which are common for late type (WN8 and later) stars but highly unusual for these early types (Conti et al. 1983). Also striking is that these stars are unusually hydrogen rich (Massey & Hunter 1998). They are about an order of magnitude brighter than normal for such stars. Estimates for their masses range from 112 to 155 (Chlebowski & Garmany 1991; Vacca et al. 1996). Two of them lie well inside the core of the cluster; the third is at a projected distance of about 0.6 pc from the core.
For a star cluster with an age of 4 Myr these three massive stars appear as blue stragglers. It is therefore suggestive to identify the three most massive stars in the star cluster R 136 as collision products.
5.2 Black holes in dense star clusters
When the runaway merger collapses to a black hole it is typically a member of a rather close binary. Upon dissociation of the binary, the black hole is ejected from the core. Since the compact object is still considerably more massive than average, mass segregation brings it back in the core within a few crossing times (see e.g. Hut, McMillan, & Romani 1992). New close binaries can be formed once the black hole has returned to the core of the star cluster. After an episode of hardening the binary may become visible as an X-ray source when the companion star starts to transfer mass to the black hole. Such a high-mass X-ray binary should be easily observable by X-ray satellites. The age at which such a binary can form is at least Myr, the minimum time needed for a black hole to form. It is likely to take considerably longer because the black hole has to return to the core after its ejection.
The star cluster R 136 is therefore “too young” for such a binary to exist. The star Mk 34 at a distance of about 2.5 pc from the center of R 136, however, is associated with a persistent X-ray source with a luminosity of erg s-1 (Wang 1995). Wang suggests that the binary contains a black hole of between 2.4 and 15 accreting from the dense wind of its spectral type WN4.5 Wolf-Rayet companion. This star, Mk 34, can be classified as a “blue straggler,” as its estimated age is about 1 Myr, considerably smaller than the age of the cluster (De Marchi et al. 1993).
Because R 136 is too young for such an X-ray binary to be formed from two collision products, it most likely formed from a primordial binary ejected from the cluster core following the supernova which formed the black hole.
5.3 Collision rate
The collision rates in our models are more than 10 times higher than simple estimates based on cross sections. In the computations with 12k stars, collisions occurred in a timespan of about 4 Myr whereas only is expected.
Furthermore, the cross section arguments imply that low mass ( ) stars are most likely to collide. In our simulations, however, high-mass stars predominantly participated in encounters. The most massive star participates in numerous collisions with other stars. Typically, the mass of this runaway grows to exceed 120 . The rejuvenation of the runaway merger delays its collapse to a compact object following a supernova. Such a star could be visible in the core of young star clusters with a high density as a blue straggler.
The reason for the discrepancy between the formal cross-section arguments and the results of our simulations is the neglect of mass segregation and binary formation in the former estimates. In the simulations the most massive stars sink to the core due to dynamical friction within a few half-mass crossing times, and form close binaries by 3-body interactions. The larger cross section of these binaries increases the collision rate and makes them favored candidates for encounters.
-
Acknowledgements.
We would like to thank Douglas Heggie and Atsushi Kawai for discussions. Edward P.J. van den Heuvel of the Astronomical Institute “Anton Pannekoek” is acknowledged for financial support. SPZ thanks Drexel University for the hospitality and Chris Colefax for his assistance.
References
- \astronciteAllen & Bastien1995 Allen, E.J., Bastien, P. 1995, ApJ, 452, 652
- \astronciteBonnell etal.1998 Bonnell, I., Bate, M., Zinnecker, H. 1998, astro-ph/9802332
- \astronciteBrandl etal.1996 Brandl, B., Sams, B.J., Bertoldi, F., Eckart, et al. 1996, ApJ, 466, 254
- \astronciteCampbell etal.1992 Campbell, B., Hunter, D.A., Holtzman, J.A., et al. 1992, AJ, 104, 1721
- \astronciteChlebowski & Garmany1991 Chlebowski, T., Garmany, C.D. 1991, ApJ368, 241
- \astronciteConti etal.1983 Conti, P.S., Leep, M.E., Perry, D.N. 1983, ApJ268, 228
- \astronciteDe Koter etal.1997 De Koter, A., Heap, S.R., Hubeny, I. 1997, ApJ477, 792
- \astronciteDe Koter etal.1998 De Koter, A., Heap, S.R., Hubeny, I. 1998, ApJ, sumbitted
- \astroncitedela FuenteMarcos etal.1997 dela FuenteMarcos, R., Aarseth, S.J., Kiseleva, L.G., Eggleton, P. P.E. 1997, in J.A. Docobo, A. Elipe, H.A. McAlister (eds.), Visual Double Stars: Formation, dynamics and Evolutionary Tracks, KAP: ASSL Series, vol. 223, 165
- \astronciteDe Marchi etal.1993 De Marchi, G., Nota, A., Leitherer, C., Ragazzoni, R., Barbieri, C. 1993, ApJ419, 658
- \astronciteDjorgovski etal.1991 Djorgovski, S., Piotto, G., Phinney, E.S., Chernoff, D.F. 1991, ApJ372, L41
- \astronciteDrissen etal.1995 Drissen, L., Moffat, A. F.J., Walborn, N.R., Shara, M.M. 1995, AJ110, 2235
- \astronciteEggleton etal.1989 Eggleton, P., Fitchett, M., Tout, C. 1989, ApJ 347, 998
- \astronciteFabian etal.1975 Fabian, A., Pringle, J., Rees, M. 1975, MNRAS 172, 15
- \astronciteFiger etal.1998 Figer, D., Najarro, F., Morris, M., McLean, I., Geballe, T., Ghez, A., N., L. 1998, ApJ 506, 384
- \astronciteGiersz & Heggie1994 Giersz, M., Heggie, D. 1994, MNRAS268, 257
- \astronciteGiersz & Heggie1996 Giersz, M., Heggie, D.C. 1996, MNRAS 279, 1037
- \astronciteHartman1997 Hartman, J.W. 1997, A&A322, 127
- \astronciteHunter etal.1995 Hunter, D.A., Shaya, E.J., Scowen, P., et al. 1995, ApJ444, 758
- \astronciteHut etal.1992 Hut, P., McMillan, S., Romani, R.W. 1992, ApJ 389, 527
- \astronciteKing1966 King, I.R. 1966, AJ 71, 64
- \astronciteKroupa1997 Kroupa, P. 1997, MNRAS 277, 1522
- \astronciteKroupa1998 Kroupa, P. 1998, MNRAS 298, 321
- \astronciteLai etal.1993 Lai, D., Rasio, F.A., Shapiro, S.L. 1993, ApJ412, 593
- \astronciteLanger etal.1994 Langer, N., Hamann, W.R., Lennon, M., et al. 1994, A&A290, 819
- \astronciteLee1987 Lee, H.M. 1987, ApJ319, 801
- \astronciteLee1995 Lee, H.M. 1995, MNRAS272, 605
- \astronciteLeonard1990 Leonard, P. J.T. 1990, AJ 99, 608
- \astronciteLeonard1995 Leonard, P. J.T. 1995, MNRAS 277, 1080
- \astronciteLombardi etal.1995 Lombardi, J.C̃., J., Rasio, F.A., Shapiro, S.L. 1995, ApJ445, L117
- \astronciteLombardi etal.1996 Lombardi, J.C̃., J., Rasio, F.A., Shapiro, S.L. 1996, ApJ468, 797
- \astronciteLyne etal.1987 Lyne, A.G., Brinklow, A., Middleditch, J., Kulkarni, S.R., Backer, D.C. 1987, Nat.328, 399
- \astronciteLyne etal.1988 Lyne, A.G., Biggs, J.D., Brinklow, A., McKenna, J., Ashworth, M. 1988, Nat.332, 45
- \astronciteMakino1991 Makino, J. 1991, ApJ369, 200
- \astronciteMakino & Aarseth1992 Makino, J., Aarseth, S.J. 1992, PASJ 44, 141
- \astronciteMakino etal.1997 Makino, J., Taiji, M., Ebisuzaki, T., Sugimoto, D. 1997, ApJ 480, 432
- \astronciteMassey & Hunter1998 Massey, P., Hunter, D.A. 1998, ApJ493, 180
- \astronciteMcMillan1986a McMillan, S. L.W. 1986a, ApJ306, 552
- \astronciteMcMillan1986b McMillan, S. L.W. 1986b, ApJ307, 126
- \astronciteMcMillan & Hut1996 McMillan, S. L.W., Hut, P. 1996, ApJ 467, 348
- \astronciteMcNamara & Sanders1976 McNamara, B.J., Sanders, W.L. 1976, A&A52, 53
- \astronciteMeurs & vanden Heuvel1989 Meurs, E. J.A., vanden Heuvel, E. P.J. 1989, A&A 226, 88
- \astronciteMoffat etal.1994 Moffat, A. F.J., Drissen, L., Shara, M.M. 1994, ApJ436, 183
- \astroncitePortegiesZwart & Verbunt1996 PortegiesZwart, S.F., Verbunt, F. 1996, A&A 309, 179
- \astroncitePortegies Zwart etal.1998 Portegies Zwart, S.F., Hut, P., Makino, J., McMillan, S. L.W. 1998, A&A337, 363
- \astroncitePortegiesZwart etal.1997 PortegiesZwart, S.F., Hut, P., Verbunt, F. 1997, A&A 328, 130
- \astroncitePrice & Podsiadlowski1995 Price, N.M., Podsiadlowski, P. 1995, MNRAS273, 1041
- \astronciteQuinlan & Shapiro1990 Quinlan, G.D., Shapiro, S.L. 1990, ApJ356, 483
- \astronciteQuinlan etal.1995 Quinlan, G.D., Hernquist, L., Sigurdsson, S. 1995, ApJ440, 554
- \astronciteSandage1953 Sandage, A., R. 1953, AJ 58, 61
- \astronciteSanders1970 Sanders, A. 1970, ApJ 162, 197
- \astronciteScalo1986 Scalo, J.M. 1986, Fund. of Cosm. Phys. 11, 1
- \astronciteSchaerer etal.1999 Schaerer, D., Contini, T., Knuth, D. 1999, A&A 341, 399
- \astronciteSchaerer etal.1993 Schaerer, D., Meynet, G., Maeder, A., Schaller, G. 1993, A&ASS 98, 523
- \astronciteSilk & Takahashi1979 Silk, J., Takahashi, T. 1979, ApJ229, 242
- \astronciteSills etal.1997 Sills, A., Lombardi, J.C., J., Bailyn, C.D., et al. 1997, ApJ487, 290
- \astronciteSpitzer1987 Spitzer, L. 1987, Dynamical Evolution of Globular Clusters, Princeton Univ. Press
- \astronciteStothers & Chin1997 Stothers, R.B., Chin, C.-W. 1997, ApJ489, 319
- \astronciteVacca etal.1996 Vacca, W.D., Garmany, C.D., Shull, J.M. 1996, ApJ460, 914
- \astronciteWang1995 Wang, Q.D. 1995, ApJ453, 783