An infrared study of Centaurus A
Abstract
We present J, H and K -band images and 0.9–2.5 m spectra of the nuclear regions of Centaurus A obtained with IRIS on the AAT. While K band has a point source coincident with the nucleus, at H and J we identify diffuse structure extending to the NE as a possible ionisation cone. By considering the NIR colours we show that the point-like K -band emission originates not from the nucleus itself, but from dust which has been shock heated by nuclear outflows. A image reveals a band of high extinction across the nucleus lying perpendicular to the radio jet axis, as suggested by previous authors (Israel et al. 1990, Turner et al. 1992). We model the detailed structure of this extinction image with a circumnuclear torus of diameter pc, thickness pc, tilt degrees to the line of sight and with the torus and radio jet axes aligned.
keywords:
galaxies:individual: Centaurus A - galaxies: active - galaxies: Seyfert - galaxies: nuclei - infrared: galaxies.1 INTRODUCTION
Centaurus A (NGC5128, Cen A) is one of the closest active galaxies. Well known as having a double radio lobe structure extending to , details in the radio jets have been mapped down to milliarcsecs. While its radio power is relatively modest, Cen A, at a distance of only 3 Mpc (Tonry & Schechter 1990, Ford et al. 1989), offers a unique opportunity to investigate in detail the smaller scale structures which surround and fuel the central power source.
Optical observations of active galactic nuclei (AGNs) usually classify them as Seyfert 1, Seyfert 2 or starburst, with the Seyfert types linked by the unified model (Antonucci 1993) to be the same intrinsic class of object but viewed at different angles to the line of sight. It has been proposed that a similar picture applies to radio-loud AGNs in which relativistic radio jets from the nucleus can extend in bipolar outflows out to scales of pc. The collimation of these jets occurs within a scale pc. The working model used to explain these phenomena consists of a hot accretion disk around a supermassive black hole, with a broad emission line region (BLR) of a few parsecs close to the nucleus and contained within a much larger circumnuclear torus. A narrow emission line region (NLR) extends to tens to hundreds of parsecs. In the Seyfert 1 model, the active nucleus is viewed at a line of sight close to the radio jet axis, such that the BLR, NLR and active nucleus are observed directly. Seyfert 2s, on the other hand, are aligned more edge-on such that the circumnuclear torus obscures the direct view of the BLR and nucleus, and the radio jets are close to the plane of the sky.
While starburst galaxies are powered by thermal rather than non-thermal nuclear processes, it is becoming increasingly recognized that there is a substantial overlap between starburst and Seyfert galaxies, with many showing evidence of starburst regions surrounding a Seyfert nucleus (Moorwood & Oliva 1988).
Cen A is classified as a Seyfert 2 galaxy with a prominent warped dust lane which totally obscures the nuclear regions at optical wavelengths. The dust lane includes a population of young stars, and is considered to be the result of a merger years ago (Malin, Quinn & Graham 1983) which has led to a range of phenomena spanning most of the observable spectrum. Because of lower dust extinction, near IR (–m) and longer wavelength radiation penetrates the foreground dust lane, giving a view into the circumnuclear torus and NLR. At m there is a point source coincident with the nucleus (Giles 1986), but the emission becomes extended along the radio jet axis (p.a. = ) at shorter infrared wavelengths. Joy et al. (1991) described the m feature as the J -band ‘jet’. Previous authors have found a region of higher extinction on scales of –16 arcsec around the nucleus; this has been attributed to a circumnuclear torus, but the exact orientation has been unclear. As expected, no broad lines have been found, consistent with the BLR being fully obscured. Polarisation at p.a. , parallel to the dust lane, was measured by Bailey et al. (1986) and Packham et al. (1996), along with a patch of polarisation just on the nucleus and perpendicular to the radio jet axis at p.a. .
Detailed radio studies show an FRI (Fanaroff & Riley 1974) morphology with radio structure ranging from lobes extending to 300 kpc, down to an unresolved point source of only 0.01 pc in the nucleus (Schreier, Burns & Feigelson 1981; Kellerman, Zensus & Cohen 1997). Jets at X-ray wavelengths follow the same axis as the radio jets, and the nucleus is variable in both radio and X-rays (Morini, Anselmo & Moltini 1989). Turner et al. (1992) have reported variability in the infrared, but this remains to be confirmed.
We present an analysis of J (m), H (m) and Kn (m) images, and 0.9–m spectra, of the nucleus of Cen A, directed at revealing the structure and processes in the nuclear region. Section 2 describes the observations and reduction. Images and spectra are presented in Section 3, and Section 4 discusses the observational results in the light of a model for the structure of the circumnuclear regions and the contribution of starburst processes to the infrared power.
2 OBSERVATIONS AND REDUCTION
2.1 Images
| UT Date | Obs. | Seeing | Photo- | Integ. | |
|---|---|---|---|---|---|
| Type | (arcsec) | metric | Time (s) | ||
| 1995 May 23 | spectrum | HK | 1.5 | no | 1200 |
| 1995 May 23 | spectrum | IJ | 1.5 | no | 1800 |
| 1995 Aug 12 | image | Kn | 0.9 | yes | 840 |
| 1995 Aug 12 | image | H | 1.0 | no | 840 |
| 1995 Aug 13 | image | J | 1.0 | no | 840 |
Images of the nuclear regions of Cen A in the J, H and Kn bands were obtained with IRIS (Allen 1992) at the f/36 cassegrain focus of the Anglo-Australian Telescope (AAT), Siding Spring Observatory on the nights of 12 and 13 August 1995 (see Table 1). The pixel HgCdTe array was operated with 0.24 arcsec pixels on the sky. Each image was comprised of a five-point mosaic pattern, centred on the Kn point source and with offsets of between 4 and 5 arcsec for the surrounding frames. Two extra frames were taken at radial offsets of 21.2 and 35.4 arcsec to the south-west in each case, to image a bright star in the field, which we used to register the three final images. Standard stars were observed at each wavelength immediately before and after each mosaic pattern. Sky frames were offset on average by 300 arcsec from the nucleus.
Frames were flat fielded using dome flats, then sky subtracted in figaro. The reduction routines are IRIS-specific tasks in figaro. Once cleaned with IRISCLEAN, a foreground star on the dust lane was used to register the frames when mosaicing with IRISMOS. Magnitude calibration, using the standard star observations, corrected all three mosaics, although the H and J observations were not made in photometric conditions. The Kn -band observation was made in photometric conditions and agreed to – mag with Giles (1986) K -band (m) photometry. The non-photometric J - and H -band mosaics were then calibrated by scaling to match Giles’ data.
Aperture photometry results are given in Table 2. Measurements were made using the iraf RADPROF program, with apertures centred on the K -band point source position and diameters chosen to match those used by Turner et al. (1992). Their photometry was centred at the m point source position which is coincident with the K point source. The aperture diameters were 2.52, 3.57 and 5.04 arcsec. The photometric Kn -band images are within 0.2 mag of Turner’s results in all three apertures, and the scaled J and H bands are also within that tolerance. As a background aperture is required for photometry and any such aperture will lie on the galaxy, an unavoidable systematic error is introduced; based on the measured background counts we estimate that it could be 0.1–0.2 mag.
| Aperture | J | H | Kn | JH | HKn |
| Diameter | |||||
| ( arcsec) | (mag) | (mag) | (mag) | (mag) | (mag) |
| 2.52 | 11.8 | 10.8 | 9.7 | 1.0 | 1.1 |
| 3.57 | 11.2 | 10.1 | 9.2 | 1.1 | 0.9 |
| 5.04 | 10.6 | 9.6 | 8.7 | 1.0 | 0.9 |
2.1.1 Alignment of images
The J, H and Kn images were aligned relative to each other to an accuracy of arcsec by fitting several bright stars in the mosaiced field (outside the regions shown in this paper) with iraf RADPROF, then shifting the images to align the stars to a fraction of a pixel. The nucleus position was also measured with RADPROF by fitting the Kn -band point source and noting its location to pixel. As the K point source is coincident with the nucleus defined by the radio position, it will be referred to as the K nucleus. The relationship between the real nucleus and the K nucleus will be examined in section 4.2.
To put coordinates on the images, the FITS header parameters were set to define the pixel scale of the image (0.24 arcsec pixel-1) and the coordinates of the nucleus pixel position. We adopted the most accurate published position for the nucleus of RA = 13 25 27.46, Dec = 43 01 10.2 (J2000), with uncertainties of arcsec (Schreier et al. 1998). The images are taken to be exactly north upwards and East to the left. Therefore, while the absolute coordinates on our images are accurate to arcsec, the registration of our overlaid images is accurate to arcsec. The coordinates on the model images discussed later were set in the same way, with the nucleus being defined by the centre of symmetry of the model.
2.2 Spectra
IJ and HK echelle spectra were obtained with IRIS on the AAT on 23 May 1995 (see Table 1) at a spectral resolution of 400; the overall wavelength coverage was from 0.9–m. The 13-arcsec slit was oriented east-west, with a spatial scale of 0.79 arcsec pixel-1. With the K -band nucleus positioned 3.5 arcsec either side of the centre of the slit in alternate frames, the subtraction of pairs of frames removed sky and background galaxy. Spectra were also formed from the slit regions that were subtracted as background galaxy, to test the uniformity of the background removal in the two positions. The resulting spectra were very similar. Although, at 7 arcsec from the nucleus the subtracted galaxy spectrum may not be representative of the background at the nucleus, spectra extracted closer to the nucleus showed strong variations with slit position and were therefore unsuitable (see section 3.2.3).
Each echelle frame was flat fielded and cleaned in figaro. Frames were then coadded and spectra extracted from the central 4 pixels. IRISFLUX was used to calibrate the spectra from observations of the standard star bs4903 (Allen & Cragg 1983). As the conditions were not photometric, the resulting spectra only have relative flux values. Argon lamp spectra were used for wavelength calibration and wavelengths were corrected to a heliocentric frame.
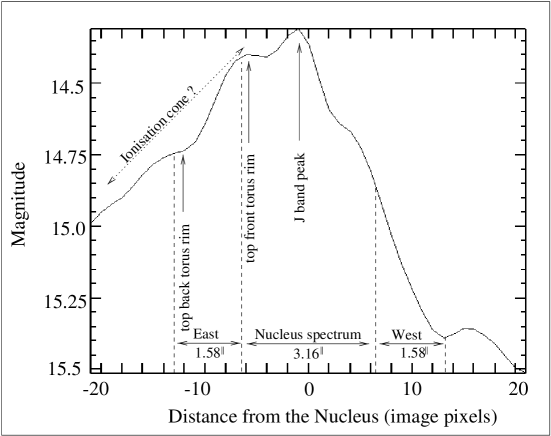
As the intensity profile along the slit in each band clearly showed structure away from the central peak, we extracted two additional regions from positions 2.37 arcsec (3 pixels) E and W of the nuclear region. These east and west regions only spanned 2 spatial pixels and therefore have a lower S/N than the nuclear spectrum. In Figure 1 the regions extracted to form the nuclear, east and west spectra are marked on an E-W cross section through the J -band image (see also Figure 11). Reduction procedures for the east and west regions were the same as for the nucleus. As discussed in section 3.2.3, the east and west spectra exhibit very different characteristics.
3 RESULTS
3.1 Images
The J, H and Kn -band images are shown in Figure 2. Only in the Kn -band do we see a point source, while at J and H the diffuse peaks are offset from the K nuclear position, with a significant extension of the shorter wavelength emission to the north-east.
3.1.1 Nuclear size and intensity
Previous estimates of the angular size of the nuclear source include K -band FWHM arcsec (Giles 1986), m FWHM arcsec (Turner et al. 1992) and X-ray FWHM arcsec (Feigelson et al. 1981). The deconvolved FWHM of our Kn nucleus, measured from figaro CENTERS is arcsec, or pc at a distance of 3 Mpc. The peak of the J -band emission is offset from the Kn nuclear position by 0.4 arcsec. As the J - and H -band peaks are diffuse with no strong point source component, it can be assumed that the underlying galaxy and circumnuclear emission dominates the J and H bands.
To measure the AGN point source contribution to the total Kn -band emission, cuts were taken through the position of the Kn nucleus in all three images, along a line of constant extinction (see section 4.1). The position angle of this line, measured from the extinction contour image, is ; Turner et al. (1992) had previously reported 121.5∘. One-pixel-wide cuts were made using PVECTOR in iraf. A point spread function (psf), taken from a Kn -band foreground star 32 arcsec SW of the nucleus, was then iteratively scaled and subtracted from the Kn -band profile until the residue matched the shape of both the H and J profiles and, hence, of the assumed underlying galaxy. Photometry on the scaled psf gave the measured point source flux as a percentage of the total Kn -band flux as per cent in a 2.5 arcsec aperture. Previous estimates of the K -band point source contribution in the same aperture are 23 per cent (Turner et al. 1992) and per cent (Packham et al. 1996).
3.1.2 Nuclear variability
The nucleus of Cen A is known to be variable at radio wavelengths on timescales of days (Kellerman 1974), and variations on timescales of minutes to years have been recorded in X-rays (Morini et al. 1989). In the mid-infrared, there is good evidence for variability: Lepine, Braz & Epchtein (1984) found an increase of a factor of 5 from 1971 to 1981 at m, while Turner et al. (1992) reported a decrease of 2.5 times over 5 years (from 1983 to 1987) at m. The evidence for K -band (m) variability, however, has been inconclusive, and at shorter NIR wavelengths the underlying stellar contribution—presumed to be constant—is far too dominant over the nuclear emission to detect variability. Furthermore, there is a foreground star 8.8 arcsec from the nucleus (arrowed in Figure 2) which appears to be variable and is within some of the measurement apertures of the early papers.
If K -band variability could be established, it would give an independent measure of an AGN contribution to the K -band flux, as the background starlight is presumably constant. To investigate K -band variability, data taken at 4 epochs from Feb 1992 to Aug 1995 were plotted in Figure 3 for 5 different aperture sizes. The 1993–1995 data were all taken with a Kn filter with a passband of 2.0–2.32 m, while the K filter for the 1992 data was centred on 2.23 m. There is no consistent trend in variability with aperture. The maximum change of mag occurs in the smallest apertures. Given that the point source contribution is 23–39 per cent (from section 3.1.1), a dimming by 0.3 mag corresponds to a decrease by a factor of 1.8–2.4 in the K -band point source. However, such a change is inconsistent with the constant or increasing point-source contributions from 1993/1994 (Packham et al. 1996) to Aug 1995 (this paper), suggesting that calibration errors may dominate Figure 3. We conclude that there is no evidence to date for significant K -band variability and, therefore, that the K -band point source emission is probably not coming directly from the AGN; this issue is discussed further in section 4.2.

3.2 Spectra
3.2.1 Nucleus
The continuum shape of the nuclear spectrum suggests a residual contribution from the surrounding galaxy as well as from the nucleus. Although a galaxy component has been subtracted, it is very difficult to remove the galaxy contribution entirely because of the patchy nature of the dust near the nucleus. This limitation is taken into account when interpreting the emission line data.
In measuring line intensities, a local continuum was fitted and subtracted from the regions around key lines, using Starlink dipso. The iraf package SPLOT was used to measure wavelengths, flux and FWHM for lines identified at the nucleus and the two adjacent off-nuclear positions (see Figure 4). Table 3 lists the emission line data for the three lines of sight. Quoted limits were estimated from uncertainties in continuum placement and extinction.
| Nucleus | arcsec West | arcsec East | |||||||||
| Emission | Dereddened | Upper | Deconv. | Upper | Dereddened | Upper | Dereddened | Upper | |||
| Line | Flux Density | limit | FWHM | limit | Flux Density | limit | Flux Density | limit | |||
| (m) | ( W m-2) | (km s-1) | ( W m-2) | ( W m-2) | |||||||
| S iii | 0.953 | 98 | 200 | 520 | 710 | 60 | 130 | not detected | |||
| He i | 1.083 | 43 | 78 | 1000 | 1500 | 22 | 42 | detected | |||
| Pa | 1.094 | 19 | 34 | 1800 | 2400 | 7 | 13 | not detected | |||
| Fe ii | 1.257 | 12 | 18 | 600 | 700 | 8 | 13 | 1.4 | 15 | ||
| Pa | 1.282 | 16 | 24 | 1580 | 1760 | 3 | 5 | 0.4 | 4 | ||
| Fe ii | 1.644 | 7 | 9 | 900 | 1200 | detected111see text | detecteda | ||||
| HS(3) | 1.958 | 4 | - | 1 | |||||||
| HS(2) | 2.034 | 3.1 | 3.8 | 520 | 730 | 1.4 | 1.6 | not detected | |||
| He i | 2.058 | 0.3 | 830 | not detected | not detected | ||||||
| He i triplet | 2.112 | 2.4 | 2.8 | 470 | 720 | 0.9 | 1.0 | not detected | |||
| HS(1) | 2.122 | 5.1 | 6.0 | 530 | 700 | 1.6 | 1.9 | inconclusive | |||
| Br | 2.166 | 2.7 | 3.2 | 590 | 890 | 0.6 | 0.7 | 0.06 | 0.15 | ||
| HS(0) | 2.223 | 1 | - | 0.5 | detected | ||||||
| HS(1) | 2.248 | 0.8 | - | 1.2 | detected | ||||||
| HQ(3) | 2.424 | 2.4 | 2.7 | - | 0.7 | 0.8 | detected | ||||
3.2.2 Extinction corrections
Amongst the detected lines, three pairs are commonly used to measure the extinction to the line emitting region. Firstly, the [Fe ii]m lines arise from the same upper level and hence have an intensity ratio that is sensitive only to reddening and not to temperature. Secondly, there is the ratio, which has large errors due to the uncertainty in continuum placement around the Q-branch lines. Thirdly, the most commonly used line ratio is Pa/Br; these are two of the least obscured emission lines and hence probe a larger depth. However, due to their relative closeness in wavelength, a small error in the measurement of Pa/Br can give a large error in AV. All three line ratios were used to measure the extinction towards the nucleus of Cen A, but the H2 result was subsequently rejected because of the large errors in the Q-branch lines.
The adopted extinction curve, , is that of Landini et al. (1984) and assumes that the extinction is purely foreground. The adopted intrinsic line ratios are listed in Table 4 along with the derived extinction values. A visual absorption AV of 8.3 mag (i.e., A mag ) has been adopted. Although the AV derived from the [Fe ii] ratio agrees within error with that based on Pa/Br, the range is smaller in the latter.
| Line | Intrinsic | Calculated |
|---|---|---|
| Ratio | Value | AV |
| 1.42 | 22 | |
| 5.89 | ||
| 1.386 |
Previous estimates of the extinction towards Cen A have ranged widely, depending on the method used and the position in the galaxy. Israel et al. (1990) corrected their line fluxes with an extinction to the nucleus from of A mag (coincidentally the same as our adopted value) or, in his limiting case, A mag. The corresponding H2 ratio from the present data gives A mag. While this is consistent with Israel et al., the larger errors make it less reliable than Pa/Br.
Measuring extinction to the infrared nucleus using silicate absorption (m), Israel et al. (1990) found AV to be mag, while others have measured values as high as A mag (Becklin et al. 1971, Giles 1986). We would expect the silicate absorption and X-ray emission to probe to greater depth than the NIR lines and therefore show larger extinctions. On the other hand, the peak of the optical emission, which is displaced from the infrared nucleus by 5.8 arcsec, has an extinction of only a few magnitudes (Joy et al. 1991, Giles 1986) as the optical emission is foreground to most of the dust.
The extinction-corrected line intensities are given in Table 3 and the corresponding ratios of useful line pairs are listed in Table 5.
| Ratio | Value |
|---|---|
| 1.2 | |
| 0.2 | |
| 0.3 | |
3.2.3 Off-nuclear spectra
Figure 4 shows portions of the spectra containing the major lines for the nucleus spectrum compared with the corresponding off-nucleus spectra. The spectra centred 2.37 arcsec (3 spatial pixels on the slit) east and west of the nuclear position are remarkably different, with the west spectrum resembling the nucleus. In both the east and west spectra, the [Fe ii]m line could not be measured accurately due to the lower signal-to-noise ratio and the complication of it falling on overlapping echelle orders.
The extinction to the west spectrum was measured from the Pa/Br ratio to be A mag (A mag), consistent with the nuclear value of A. Uncertainties in the Pa line are responsible for the large upper limit on AV. However, since we can assume that the nucleus has the highest extinction, the upper limit on the nuclear extinction was used to obtain upper limits for the west line fluxes. The east spectrum has larger uncertainties in the line strengths and, as Br was only marginally detected, the uncertainty in AV is large, with mag and a limit of A mag. Despite the large uncertainties, these results suggest there may be less extinction to the east slit position than to the nucleus and west positions. While these differences are not conclusive, they do lend support to our model for the circumnuclear region discussed in the following sections.
4 DISCUSSION
4.1 Physical parameters of the circumnuclear torus
Israel et al. (1990) suggested that Cen A has a dense circumnuclear torus with diameter 16 arcsec, or 230 pc at a distance of 3 Mpc. They inferred the existence of the torus from the very much higher extinction at the nucleus, and the size was constrained by the non-detection of H2 lines at positions 5 arcsec away from the nucleus in all directions except south. It has been proposed that the H2 ‘coats’ the inner edge of the torus. Turner et al.’s (1992) ROSAT observations showed a region of higher extinction extending less than 14 arcsec and, along with previous authors, noted the position angle (p.a.) of the higher extinction, to be not at the p.a. of the dust lane, but at p.a. –, perpendicular to the radio and X- ray jet axis. This location constrains the ridge of extinction to be associated with or feeding the accretion disk producing the jets, and hence has been claimed as the circumnuclear torus. From 12CO() observations of the Cen A molecular gas, Rydbeck et al. (1993) mapped the regions of highly red- and blue-shifted gas, which should correspond to the receding and approaching edges of the torus. They concluded that the disk has an outer diameter of between 9.6 and 16.6 arcsec, a rotational speed of 220 km s-1, a central velocity of 561 km s-1 and a p.a. of .
An extinction map, made from the current data by subtracting seeing-matched J and Kn mag arcsec-2 images, is shown in Figure 5. The dust lane at p.a. shows up clearly, as does a region of higher extinction across the nucleus at p.a. = . We believe that the latter feature can be identified with the circumnuclear torus. The and colours at a selection of points along this feature are all consistent with reddening of E-galaxy light due to extinction.
Figure 6(a) shows the central arcsec with extinction contours overlaid on the greyscale extinction image. North-east of the nucleus is a straight, well defined extinction boundary arcsec long at p.a. = 140∘. We propose that the band of high extinction SW of this boundary, across the nucleus, defines the front of the putative torus. The J -band ‘jet’ emission is unobscured to the NE of this boundary, in the region marked X. To the NW and SE of this boundary the extinction increases abruptly into the regions marked Y, which we interpret as the back inner edge of the torus.
In Figure 6(b), we show the greyscale extinction image overlaid with contours of the high velocity 12CO emission from Rydbeck et al. (1993). The reference frame of Rydbeck et al.’s image was shifted to align the nucleus with our adopted position (see section 2.1.1) to an accuracy of arcsec. The highest velocity emission ‘patches’ are slightly north-east of a line through the nucleus at a p.a. of 140∘, lending support to the picture in which the torus is tilted slightly towards the line of sight.
4.1.1 Torus model
On the basis of the interpretation in the preceding section, we now propose a model for the size and orientation of the circumnuclear torus. While the model is by no means exclusive, it fits the observed data if our interpretation of the extinction boundary NE of the nucleus proves correct. Figure 7(a) & (b) shows a cartoon representation of our proposed model in which the circumnuclear torus is tilted slightly to the line of sight, revealing the back inner edge of the torus either side of the J -band emission ‘cone’. In Figure 7(c) the model is overlaid with the extinction contours to show how the observed features relate to the model.
The constraints on the torus model imposed by the extinction image were (i) projected height of the torus: pc, (ii) projected distance from the nucleus to the front top rim: pc, and (iii) outer diameter measured from Figure 6(b): pc. To meet these requirements the angle between the line of sight and the torus axis, which is assumed to be parallel to the radio axis, must be . This is consistent with the angle of 50–80∘ estimated from the radio jet-to-counterjet surface brightness ratio (Tingay et al. 1998).
The model is not entirely constrained by the observations. In particular, the cross section of the torus and the inner torus diameter are unknown. While an elliptical cross section was chosen for convenience, we acknowledge that this is likely to be a gross over-simplification. Israel et al. (1990) modelled the possible torus configurations and, based on the constraints of the high mass compared to column density, concluded that the torus must be a ‘fat’ disk with cavity size comparable to disk thickness. The inner torus diameter was therefore chosen to be 80 pc, although it could vary significantly from this. Furthermore, the J -band feature discussed later has an extension perpendicular to the jet which is proposed (see section 4.3) to be emission from the back inner edge of the torus and extends to the width of the opening in this model. The only observational constraint on the torus inner diameter comes from the width of the J -band feature as it appears just above the front rim. As the J emission originates from inside the torus, this width of 38 pc (2.5 arcsec) must be a lower limit on the torus inner diameter.
4.2 Nature of the infrared nuclear source
It is clear from the imaging data that the nucleus and surrounding regions are heavily reddened. In order to determine if the reddening is due solely to dust extinction, the two-colour plot in Figure 8 was formed from values of the pixels ( arcsec) around the nucleus. The ellipse marks the typical colour range of unreddened E and S0 galaxies (–0.25, –0.73, Frogel et al. 1978), with vectors showing the influence of reddening from A mag, hot dust ( K), synchrotron and thermal gas emission, and post-starburst A0 stars. The main bulk of the points lie along the extinction vector, which is not surprising because of the dust lane and torus. When a larger pixel area is included the distribution of points overlaps the elliptical galaxy colours as we include the background galaxy contribution further from the nucleus.
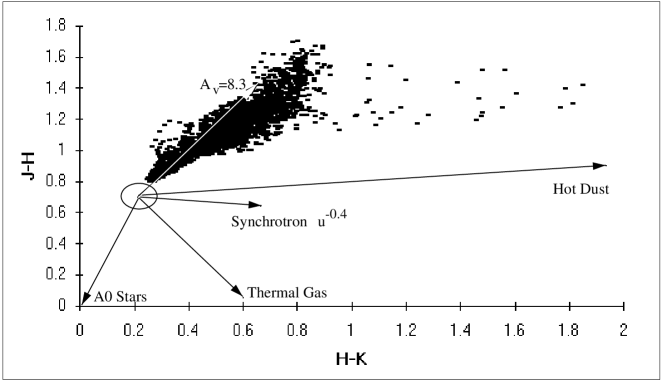
A notable feature of the two-colour plot is the collection of 27 points that appear to lie along the extinction vector plus a hot dust vector. This set of points comes from the central 1.4 arcsec covering the Kn -band nucleus. As expected the nucleus is affected by the same dust extinction as the rest of the circumnuclear regions but, in addition, shows emission from hot dust from a diameter of only pc. The dust extinction to the nucleus determined from our spectral data was 8.3 mag. The vector of that length is clearly commensurate with the extinction component to the nuclear reddening. For an extinction of say 20 mag, the vector would have the same direction but extend three times longer. Therefore, although the extinction estimate from the imaging data remains uncertain, there is clear support for an extinction of around 8 mag to the Kn emitting region, rather than the much larger estimates in some previous papers (see section 3.2.2).
Figure 8 suggests that the observed emission at m and shorter wavelengths, is not coming directly from the nucleus. Although the peak position at m agrees within errors with the X-ray nucleus position (Turner et al. 1997), X-rays will penetrate further than infrared radiation and hence should be generated deeper within an object. X-ray extinction to the nucleus has been estimated to be as high as A mag (Packham et al. 1996, Morini et al. 1989), and the emission shows significant variability. The hot dust emission at Kn -band is therefore likely to originate not from the nucleus, but from dust clouds close to the nucleus which have been heated by the nuclear source. If this is so, the size of the hot dust region (diameter pc) is either a measure of the dimensions of the dust cloud, or the depth into the dust cloud that the nuclear heating penetrates, and a region of this size is shown around the nucleus of our model in Figure 7(b). Alternatively, the hot dust emission could signal the presence of a circumnuclear starburst.
K -band polarimetry by both Bailey et al. (1986) and Packham et al. (1996) found polarisation perpendicular to the radio jet axis at distances pc (2 arcsec) from the nucleus, with no significant polarisation elsewhere in the nuclear region. Intrinsic polarisation was ruled out by Packham et al. (1996) in favour of a scattering model. Submillimetre (m and m) polarimetry (Axon et al. 1994), where dust scattering is negligible, showed no (%) nuclear polarisation. Hence, rather than an intrinsically polarised source, the observed polarisation is probably due to scattering. The scattering clouds producing this polarisation are likely to be close to the nucleus as the polarisation angle is perpendicular to the radio jet axis and hence likely to be influenced by the accretion processes fuelling the nucleus. In order for the dust to survive so close to the nucleus, a toroidal geometry around the radio axis may be required. Therefore, the Kn -band source is most likely hot dust emission from scattering clouds pc diameter covering the nuclear source.
4.2.1 Excitation mechanisms for molecular hydrogen
We now examine the origins of molecular hydrogen lines in the nuclear spectrum. Molecular hydrogen can be excited either by radiative fluorescence through the absorption of soft-UV photons at low densities, or by collisions in a warm gas. Line ratios can be used to distinguish between these two alternatives. For example, the ratios of / and / should be – for radiative UV fluorescence, but for collisional excitation the first ratio is and the second, 0.2–0.3. Our measured line ratios in the nuclear spectrum are and , respectively, indicating that the molecular hydrogen in the nuclear spectrum is probably collisionally excited. This result is predicted by studies of populations of AGN and starburst galaxies by Fischer et al. (1987) in which collisional excitation was the dominant excitation mechanism. Furthermore, Moorwood & Oliva (1990) concluded that radiative fluorescence at low densities is not an important mechanism for exciting molecular hydrogen in AGNs.
The dominant heating mechanism for the collisional excitation of H2 can be derived from the line ratios in Table 6. UV heating is due to photons from the nucleus, incident on photodissociation regions, while X-ray heating is responsible for exciting the molecular hydrogen on the inner edge of a circumnuclear torus. Hydrogen can also be excited by shocks from nuclear driven winds incident on the NLR and inner torus, in particular along the radio jet axis where the gas is compressed by the radio-emitting outflow. The table lists the predicted values for the diagnostic H2 ratios, along with the extinction corrected ratios measured from the current spectra. In all cases, shock excitation is a key component, with a possible contribution from X-ray heating. Shock excitation of H2 from nuclear driven winds has been shown to be dominant in a number of galaxies including NGC1068 (Kawara, Nishida & Gregory 1990; Oliva and Moorwood 1990). In addition, from a sample of Seyfert 2s, Veilleux, Goodrich & Hill (1997) found that shock excitation is the dominant mechanism for exciting H2, with X-ray heating also playing a role.
| H2 | UV | Shock | X-Ray | Measured for | Conclusion |
| Ratio | Heating | Excitation | Heating | Cen A nucleus | |
| 0.5–0.6 | 0.1–0.2 | 0.01–0.02 | Shock or Shock+X-ray | ||
| 0.5–0.6 | 0.1–0.2 | 0.01–0.02 | Shock or Shock+X-ray | ||
| 1.3 | Shock | ||||
| 1.91 | Not UV | ||||
| 0.5–0.7 | 0.8–1.1 | Shock or UV | |||
| Kawara et al. (1990) | |||||
| Doyon et al. (1995) | |||||
| Veilleux et al. (1997) | |||||
These results lend support to a model in which the H2 lines are generated on the inner edge of the circumnuclear torus by a combination of shock and X-ray heating. The unified model for AGNs (Antonucci 1993) predicts that in Seyfert 2s, the H2 lines should be partially obscured by the gas and dust in the outer parts of the torus. The nuclear radiation does not penetrate to the outer regions of the torus, so the temperature is not high enough to excite H2; instead the emission is reprocessed and re-emitted in the FIR. In Seyfert 1s, the direct view of the inner parts of the torus would be expected to show the excited molecular hydrogen. Kawara et al. (1990) found H2 emission more strongly connected with Seyfert 1s than Seyfert 2s, as predicted by this model. However, if in a Seyfert 2 galaxy the torus is tilted slightly towards our line of sight, the H2 from the inner back edge of the torus should be observable over the front rim of the torus (Alonso-Herrero, Ward & Kotilainen 1996). Krolik & Begelman (1988) claim to have made such H2 observations for several type 2 Seyferts. As discussed below (and in Figure 7, from section 4.1), the Cen A circumnuclear torus appears to have a similar orientation, revealing the H2 from inside the torus.
4.2.2 Excitation mechanisms for [Fe II] and H I lines
In AGNs, three main mechanisms have been put forward to explain [Fe ii] production. Firstly, starburst activity in or near the nucleus can excite iron, either in the cooling tails of SNRs, in which case there should be a correlation between the [Fe ii] emission and radio images, or through direct photoionisation by young OB stars in a starburst region. Secondly, X-rays from the central source can photoionise parts of the NLR clouds. Shocks induced by the interaction of the radio jet with the ambient medium is the third option for iron excitation, and predicts that the [Fe ii] morphology should match that of the radio jets.
If [Fe ii] is to originate from either shock or photoionisation processes in a circumnuclear starburst, it is first necessary to consider whether Cen A has a composite Seyfert/starburst nucleus. Several papers have found trends in emission line ratios from studies of pure starbursts, composites and pure Seyfert nuclei. Moorwood and Oliva (1988) found that the concurrent detection of H2, [Fe ii] and H i recombination lines was more probable in composite nuclei than in pure starbursts, with none of their pure Seyferts exhibiting all three species. They further found the ratio of to be higher in composites than starbursts. [Fe ii] ratios overlap between the two groups, although Colina (1993) found this ratio must be below 1.4 for pure starbursts. For Cen A, this ratio is 2.6 (), which makes pure starbursts unlikely, as expected.
The H2 increase in composite nuclei reflects the additional excitation of H2 in the circumnuclear region by the AGN as discussed in section 4.2.1. The mean value of [Fe ii] from Moorwood and Oliva’s (1988) sample was for composites and for H ii/starbursts, with the current Cen A spectra again clearly composite with a ratio of 0.73 (). Furthermore, a well documented correlation exists between [Fe ii] and H i recombination lines from which Puxley & Brand (1994) found the mean values for the flux ratio [Fe ii] to be for starburst and for AGN/composite galaxies respectively, leaving Cen A clearly amongst the composites with a ratio of 0.74().
We now explore the likely origin of [Fe ii] in Cen A. Photoionisation by hot stars is unlikely, because in photoionised gas iron is mostly in a higher ionisation state than Fe+ so the [Fe ii] lines are weak. Fast shocks, however, leave Fe singly ionised in their wake from the destruction of Fe-rich interstellar grains. Therefore [Fe ii] is likely to originate from shocks either along the radio axis or associated with SNRs in starbursts.
Several studies of starbursts and AGNs (Veilleux et al. 1997 and refs therein) have demonstrated a relationship between [Fe ii] and radio emission in both classes of nucleus. Hence, any model of [Fe ii] generation may involve a process connected with the synchrotron emission. This supports a picture in which the radio jets induce fast shocks in the surrounding gas, with the line emission resulting from the ionised post-shock gas. To uphold this radio correlation in Cen A, a starburst shock origin would require an as yet unsubstantiated association between the radio axis and the morphology of the starburst region.
Based on the nuclear spectrum, the [Fe ii] in Cen A is most likely generated in shocks from nuclear outflow along the jet axis, with the possibility of an additional starburst contribution.
4.3 J -band ‘Jet’ and nucleus
For consistency with the literature, the J -band feature is referred to as a ‘jet’ although the possible emission processes actually do not allow for an outflow of infrared-emitting material from the nucleus. The ‘blue’ emission consists of a diffuse, approximately conical structure with three positions of interest marked in Figure 9(a). The brightest feature, at A, which we refer to as the J -band nucleus, is located 0.4 arcsec east of the Kn -band nucleus. B marks a patch of J emission stronger than the surrounding diffuse structure but weaker than the J nucleus; it is located 2.2 arcsec NE of the Kn -band nucleus and has some lateral extension. It is clear from overlays with the extinction map (Figure 9(b)), that this patch sits just above the front rim of our model torus, and hence appears elongated perpendicular to the axis. B therefore marks the start of the observable portion of the jet, which then extends to the NE into region C. Although B and C mark different portions of the same feature, B has enhanced emission relative to C, as the view just over the front rim of the torus includes a contribution from the inner edge of the far side of the torus.
In order to explore the processes responsible for the ‘jet’ emission, we need to consider A, B and C separately. Aperture photometry was performed on all three regions, with aperture diameters of 0.48 and 0.96 arcsec, chosen so the apertures did not overlap the adjacent regions. The two-colour plot in Figure 10 maps these points along with the previous aperture photometry for the Kn -band nucleus. As in Figure 8 typical colours for E and S0 galaxies are marked by an ellipse and vectors show the colours expected for each of the possible processes discussed below. While the J -band nucleus has similar colours to the Kn nucleus, as expected since it suffers the same extinction from the torus and dust lane, the B and C positions have colours progressively less affected by extinction and no significant hot dust component. As discussed above, the hot dust cloud around the nucleus is less than 20 pc (1.4 arcsec), and hence the J nucleus, offset from K by 0.4 arcsec, is within the same hot dust region as the Kn nucleus. The slight offset in position may be due to the smaller depth into the torus seen at J.
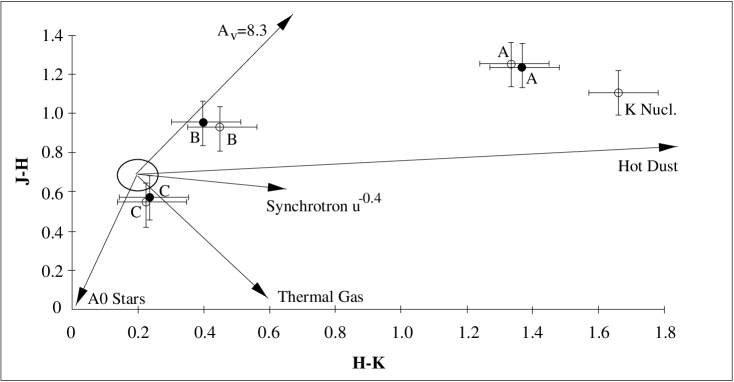
The ‘jet’ in regions B and C, however, is clearly due to different processes. Possible mechanisms for producing the jet include: (a) non-thermal synchrotron emission, (b) scattered light from the AGN, (c) starlight from blue stars, (d) thermal dust emission, or (e) thermal gas emission (H ii). From Figure 10 it is clear that the colour of blue A0 stars eliminates (c) from being a significant contributor to the jet emission.
Although the two-colour plot does not rule out a contribution from synchrotron emission for B if it was in conjunction with dust extinction, polarisation images by Bailey et al. (1986) and Packham et al. (1996) show no enhanced polarisation anywhere in the J -band ‘jet’ region. Furthermore, if the ‘jet’ had a significant synchrotron component, we would expect there to be corresponding radio emission. A cm (1 arcsec resolution) ATCA radio image (Morganti 1998, private communication) when overlaid on the J -band image, shows no correlation between J -band and radio emission within arcsec around the nucleus.
Gas, dust or hot electrons located just above the torus have the potential to scatter nuclear radiation towards the line of sight, thereby revealing a hidden BLR (e.g. in NGC1068, Pogge & de Robertis 1993). However, the lack of polarisation in the Cen A ‘jet’ precludes scattering of nuclear radiation as a significant contribution. This leaves the possibility of thermal emission from gas or dust. We can speculate that the B position in the two-colour plot, could be dust extinction plus a small hot dust emission component. Alternatively, based on the C position, both B and C could include thermal gas emission contributing around 10 percent of the Kn -band flux. B has more extinction than C as it is closer to the highest extinction regions of the foreground dust lane.
4.3.1 Ionisation cone
Hot dust emission at A and a cone morphology are strong indicators of an ionisation cone, which traces ionising radiation from the nucleus collimated along the radio jet axis, ionising the NLR gas which reradiates in the infrared. The strongest circumstantial argument in favour of an ionisation cone is the conical morphology of the ‘jet’ emission. Such cones have been seen in several Seyfert 2 galaxies. Those with radio jets and an obscuring torus, include NGC5728 (Wilson et al. 1993; Pogge 1989), NGC1365 (Phillips et al. 1983; Storchi-Bergmann & Bonatto 1991), NGC4388 (Pogge 1988; 1989; Corbin, Baldwin & Wilson 1988), and NGC5252 (Wilson and Tsvetanov 1994; Tadhunter and Tsvetanov 1989). Two mechanisms can collimate the radiation into a cone: firstly, the accretion disk and secondly, shadowing from the molecular torus. In both cases the strong correlation between the cone and radio jet axes seen in the objects listed above (see Wilson and Tsvetanov 1994, Pogge 1989), is easily explained. From the parameters of our simple model (Figure 7), the torus itself could not be collimating the cone. However, the assumption of an elliptical cross section for the torus is most likely an over-simplification and in fact the torus could be thicker on the inside than the outside, which may collimate the cone without affecting the correspondence of the model with the observed torus. The cone opening angle adopted in the torus model was measured from Figure 9(b) to be , by extrapolating back to the nuclear position. For comparison, Wilson and Tsvetanov’s (1994) sample of 11 ionisation cone galaxies showed a range of opening angles between 40–92∘.
An ionisation cone should exhibit an emission line spectrum characteristic of photoionisation by the nuclear source. Although the current spectra do not include position C on the cone, a limited spectrum is available at B. When the positions of the off-nuclear spectra (see section 3.2.3 and Figure 1) are overlaid on the extinction and J -band images in Figure 11, the differences in the east and west spectra become apparent as the west spectrum sits on the front of the torus like the nuclear spectrum, but the east position includes a contribution from the putative ionisation cone near B. Although there will be some contamination from the nucleus to the East and West spectra, the differences are significant. It is not surprising, therefore, that the east spectrum measures less extinction (section 3.2.3), as the line emission is generated above the front rim of the torus. Along the line of sight in the east spectrum position is the J cone in the foreground with the inside back edge of the circumnuclear torus behind. Therefore, not only should the east spectrum have a contribution from ionisation lines along the radio jet axis as above, but the excited molecular hydrogen lines, coating the inner torus, should be included at higher extinction. The west spectrum has stronger [Fe ii] and H2 like the nucleus as the west position includes scattered emission from the nucleus, inside the torus.
Longer wavelengths penetrate further and therefore should be generated deeper within an object. As the wavelength increases, the east spectrum more closely resembles the nuclear and west spectra, showing a strong correspondence with the nucleus for wavelengths longer than m. This trend is apparent in the line sections shown in Figure 4. In the East spectrum, whilst undetected at shorter wavelengths, H2 lines are increasingly measurable at longer wavelengths. However, even the shorter wavelength [Fe ii] line (m) is detected, suggesting that [Fe ii] is generated from a shallower depth than the H2 lines. As the east position is above the front rim of the torus and hence suffers less extinction, if [Fe ii] is excited along the radio jet axis the H2 may therefore originate on the inner back torus.
The wavelength correspondence between the strong [Fe ii]m line and the J -band filter (m) lends support to an ionisation cone that appears so strongly at J -band. A fainter extension in the cone direction is also seen at H -band (Figure 2). The [Fe ii]m line lies in the H filter and was detected but not measured (see section 3.2.3). The [Fe ii] lines do not confirm the ionisation cone, as they could be shock excited by shocks along the radio jet axis or shocks within small circumnuclear starburst regions inside the torus area. However, based on the morphology and colours of the J ‘jet’, it is most likely an ionisation cone of opening angle , length pc (7 arcsec), extending NE from the nucleus along the radio jet axis. To test this ionisation cone model, a map of spectra across the proposed cone region and/or a narrow-band [Fe ii] image should reveal the distribution of the [Fe ii] emission.
5 CONCLUSION
From J, H and Kn -band images and near-infrared spectra, a model of the Cen A nuclear regions has been proposed consistent with the observations. By no means an exclusive solution, the model depends on the interpretation of the sudden change of extinction NE of the nucleus as defining the top of a torus. This leaves a picture which includes a point source nucleus at wavelengths longer than K -band, from which collimated radio jets are produced. The nucleus is partially obscured by a circumnuclear torus of outer diameter pc and thickness pc which is tilted from the line of sight, such that the inner back edge of the torus is seen over the front rim. Scattering clouds surrounding the nucleus are shock excited by nuclear outflows, which heat the clouds to a depth of pc. K -band emission is generated in this hot dust and not directly from the nucleus which is only seen at longer wavelengths through more extinction.
We speculate that radiation from the nucleus, collimated along the jet axis, produces a cone of hot ionised NLR gas with opening angle . Reradiation from the cone, in the near-infrared, is preferentially at shorter wavelengths and accompanied by [Fe ii] emission lines.
ACKNOWLEDGMENTS
We would like to thank Raffaella Morgani and Neil Killeen for providing radio images prior to publication. We are also grateful to Gustaf Rydbeck who supplied his CO image data for our overlays. JJB acknowledges support from a University Postgraduate Research Award from the University of Sydney. RWH acknowledges support for observatory travel from an ARC Institutional Grant.
References
- [1] Antonucci R., ARA&A (1993) 31, 473.
- [2] Allen D., Proc. ASA (1992) 10, 94.
- [3] Allen D., Cragg T.A., MNRAS (1983) 203, 777.
- [4] Alonso-Herrero A., Ward J.W., Kotilainen J.K., MNRAS (1996) 278, 902
- [5] Axon D. J., Hough J.H., Young S., Inglis M., Ap&SS (1994) 216, 379.
- [6] Bailey J.A., Sparks W.B., Hough J.H., Axon D.J., Nat (1986), 322, 150.
- [7] Black J.H., van Disheock E.F., ApJ (1987) 322, 412.
- [8] Becklin E.E., Frogel J.A., Kleinmann D.E., Neugebauer G., Ney E.P., Strecker D.W., Ap J (1971) 170, L15.
- [9] Colina L., ApJ (1993) 411, 565.
- [10] Corbin M., Baldwin J.A., Wilson A.S., ApJ (1988) 334, 584.
- [11] Doyon R., Nadeau D., Joseph R.D., Goldader J.D., Sanders D.B., Rowlands N., ApJ (1995) 450, 111.
- [12] Fanaroff B.L., Riley J.M., MNRAS (1974) 167, 31.
- [13] Feigelson E.D., Schreier E.J., Delvaille J.P., Giacconi R., Grindlay J.E., Lightman A.P., ApJ, (1981) 251, 31.
- [14] Fischer J., Geballe T.R., Smith H.A., Simon M., Storey J.W.V., ApJ (1987) 320, 667.
- [15] Ford H.C., Ciardullo R., Jacoby G.H., Hui X., IAU Symp. 131 Planetary Nebulae, ed. S. Torres-Peimbert, Klewer (1989) 335.
- [16] Frogel J.A., Persson S.E., Aaronson M., Matthews K., ApJ (1978) 220, 75.
- [17] Giles A.B., MNRAS (1986) 218, 615.
- [18] Israel F.P., van Dishoeck E.F., Baas F., Koornneef J., Black J.H., de Graauw T., A&A (1990) 227, 342.
- [19] Joy M., Harvey P.M., Tollestrup E.V., Sellgren K., McGregor P., Hyland A.R., ApJ (1991) 366, 82.
- [20] Kawara K., Nishida M., Gregory B., ApJ (1990) 352, 433.
- [21] Kellerman K.I., ApJ (1974) 194, L135.
- [22] Kellerman K.I., Zensus J.A., Cohen M.H., ApJ (1997) 475, L93.
- [23] Krolik J. H., Begelman M.C., ApJ. (1988) 329, 702.
- [24] Landini M., Natta A., Salinari P., Oliva E., Moorwood A.F.M., A&A (1984) 134, 284.
- [25] Lepine J. R. D. , Braz M. A. , Epchtein N., A&A (1984) 131,72.
- [26] Malin D.F., Quinn P.J., Graham J.A., ApJ, (1983) 272, L5.
- [27] Moorwood A.F.M., Oliva E., A&A (1988) 203, 278.
- [28] Moorwood A.F.M., Oliva E., A&A (1990) 239, 78.
- [29] Morini M., Anselno F. ,Molteni D., ApJ (1989) 347, 750.
- [30] Oliva E., Moorwood A.F.M., ApJ (1990) 348, L5.
- [31] Packham C., Hough J.H., Young S., Chrysostomou A., Bailey J.A., Axon D.J., Ward M.J., MNRAS (1996) 278, 406.
- [32] Phillips M. M., Turtle A.J., Edmunds M.G., Pagel B.E.J., MNRAS (1983) 203, 759.
- [33] Pogge R.W., ApJ (1988) 332, 702.
- [34] Pogge R.W., ApJ (1989) 345, 730.
- [35] Pogge R.W., De Robertis M. M., ApJ (1993) 404, 563.
- [36] Puxley P.J., Brand P.W., MNRAS (1994) 266, 431.
- [37] Puxley P.J., Brand P.W., MNRAS (1995) 274, L77.
- [38] Puxley P.J., Lumsden S.L., Brand P.W.J.L., Doyon R., MNRAS (1994) 270, L7.
- [39] Rydbeck G., Wiklind T., Cameron M., Wild W., Eckart A., Genzel R., Rothermel H., A&A (1993) 270, L13.
- [40] Schreier E. J., Burns J.O., Feigelson E.D., ApJ (1981) 251, 523.
- [41] Schreier E. J., Marconni A., Axon D.J., Caon N., Macchetto D., Capetti A., Hough J.H., Young S., Packham C., (1998) preprint astro-ph/9804098.
- [42] Sternberg A., ApJ (1988) 332, 400.
- [43] Sternberg A., Dalgarno A., ApJ (1989) 338,197.
- [44] Storchi-Bergmann, Bonatto, MNRAS (1991) 250,138.
- [45] Tadhunter C., Tsvetanov Z., Nat (1989) 341, 422.
- [46] Tingay S.J. et al., AJ (1998) 115, 960.
- [47] Tonry J.L., Schechter P.L. AJ (1990) 100, 1794.
- [48] Turner P.C., Forrest W.J., Pipher J.L., Shure M.A., ApJ (1992) 393, 648.
- [49] Turner T.J., George I.M., Mushotzky R.F., Nandra K., ApJ (1997) 475, 118.
- [50] Veilleux S., Goodrich R.W., Hill G.J., ApJ (1997) 477, 631.
- [51] Wilson A.S., Braatz J.A., Heckman T.M., Krolik J.H., Miley G.K., ApJ (1993) 419, L61.
- [52] Wilson A.S., Tsvetanov Z., AJ (1994) 107, 1227.