The Ulysses Supplement to the BATSE 3B Catalog of Cosmic Gamma-Ray Bursts
Abstract
We present Interplanetary Network localization information for 218 gamma-ray bursts in the 3rd BATSE catalog, obtained by analyzing the arrival times of these bursts at the Ulysses and Compton Gamma-Ray Observatory (CGRO) spacecraft. For any given burst observed by these two spacecraft, arrival time analysis (or “triangulation”) results in an annulus of possible arrival directions whose half-width varies between 7 arcseconds and 32 arcminutes, depending on the intensity and time history of the burst, and the distance of the Ulysses spacecraft from Earth. This annulus generally intersects the BATSE error circle, resulting in an average reduction of the error box area of a factor of 30.
1 Introduction
A knowledge of the precise positions of cosmic gamma–ray bursts (GRBs) is important for many studies. For example, recent observations of the optical counterparts to bursts have provided evidence that at least two of them are at cosmological distances (Metzger et al. 1997, Kulkarni et al. 1998) and that, by implication, most or all of them may also be. One optical counterpart has been associated with a galaxy, and the majority of the models for the energy release in bursts have long invoked neutron star-neutron star or neutron star- black hole mergers (e.g. Paczynski 1991). If this is correct, GRBs should originate in or close to galaxies, and correlations between burst positions and the large scale structure of the universe might be expected. In this context, it has been debated whether the positions of bursts are correlated with those of Abell clusters (Kolatt & Piran 1996; Hurley et al. 1997a; Struble & Rood 1997) and radio-quiet quasars (Hurley et al. 1997b; Schartel, Andernach, and Greiner, 1997). In both cases, increased precision in the location accuracy leads to more stringent tests. Similarly, precise positions greatly improve searches for quiescent counterparts to GRBs in other wavelength ranges (e.g. Tokanai et al. 1997), and can help confirm proposed associations between GRBs and fading counterparts (Hurley et al. 1997c). Finally, burst recurrence from a single source is excluded in most cosmological models. Such recurrence would reveal itself through small-scale clustering in the angular distribution of burst locations, and the sensitivity of the distribution function to repeating sources is greater when the burst location accuracy is improved (Kippen, Hurley, & Pendleton 1998).
We present here a catalog of 218 gamma–ray bursts from the detector aboard the Ulysses spacecraft, which were also observed by the Burst and Transient Source Experiment (BATSE), and cataloged in the 3rd BATSE catalog (Meegan et al. 1996). In the present catalog, their positions have been improved in accuracy by arrival time analysis, or “triangulation”. Detection of an event by these two widely separated instruments leads to a narrow annulus which intersects the BATSE error circle and reduces its area by a factor of 30. Such annulus/error circle intersections have played important roles in the examples cited above.
2 Instrumentation
The Ulysses GRB detector (Hurley et al. 1992) is one instrument in the 3rd Interplanetary Network of burst detectors. It consists of two 3 mm thick hemispherical CsI scintillators with a projected area of about 20 cm2 in any direction. The detector is mounted on a magnetometer boom far from the body of the spacecraft, and therefore has a practically unobstructed view of the full sky. Because the Ulysses mission is in interplanetary space, the instrument also benefits from an exceptionally stable background. The GRB detector operates continuously, and over 97% of the data are recovered.
A unique feature of the mission is the fact that it is in heliocentric orbit with aphelion 5 AU. Thus it reaches an apogee of 6 AU or 3000 light-seconds, and during portions of the orbit, the GRB experiment is farther than any burst detector has ever been from Earth, resulting in greatly improved location accuracies for gamma-ray bursts.
The GRB instrument observes bursts in both a triggered and a real-time mode. The triggered mode is initiated when the number of counts in one of two possible time intervals exceeds a preset value. Because the background is stable, this number is defined in terms of an absolute number of counts, rather than a number of standard deviations above the background. The two time intervals may be selected among values from 0.125 to 4 s. Each of the two time intervals is associated with an independently selectable energy window, whose lower and upper thresholds lie between 15 and 150 keV. The data collected in the triggered mode consist of energy spectra, and either 16 s of 8 ms count rates, or 64 s of 32 ms count rates, in the 25 to 150 keV energy range; 1.8 and 7.4 s of the data stream record the time histories prior to trigger, respectively. Following a trigger, data are read out for 40 m, during which time the experiment cannot re-trigger. An example is shown in Figure 1.
Independent of the trigger, a continuous stream of real time data is transmitted. This consists of count rates taken with 0.25, 0.5, 1, or 2 s time resolution. The resolution depends on the spacecraft telemetry rate, and the energy range is 25 to 150 keV, as for the trigger. Data are compressed in this mode. An example is shown in Figure 2. The real time data serve many purposes. For example, numerous gamma-ray bursts which are not intense enough to trigger the detector can be reliably identified in the real time data, as we demonstrate below. Bursts arriving during trigger readout may also be identified. Finally, bursts whose duration exceeds the duration of the triggered memory can be fully recorded in this mode.
BATSE consists of eight detector modules situated at the corners of the Compton Gamma-Ray Observatory spacecraft. Each contains a Large Area Detector (LAD), a 50.8 cm diameter by 1.27 cm thick NaI scintillator. The trigger algorithm examines the count rates of two or more detectors in the 50 - 300 keV energy range, over 64, 256, and 1024 ms intervals. The experiment is described in more detail in Meegan et al. (1996). For most of the events in this catalog, we have utilized the DISCSC and PREB data types summed over two, three, or four detectors. This gives a 0.064 s resolution time history from 2 seconds prior to the trigger to 240 s or more after the trigger. We select discriminator channels 1 and 2, corresponding to the energy range 25 - 100 keV, to match the Ulysses energy range as closely as possible. Rarely, this data type is not available; in that case we use MER, TTS, TTE, or 1 s resolution data. As BATSE is in low Earth orbit, the time history data are occasionally interrupted by data gaps and Earth occultation.
3 Search Procedure
Every cosmic burst detected by BATSE is systematically searched for in the Ulysses data as soon as the BATSE data are available for it. This is done by using the approximate arrival direction from BATSE and the position of the Ulysses spacecraft to calculate a range of possible arrival times at Ulysses . The calculation assumes generous uncertainties in the arrival direction to assure that the crossing window always includes the burst. Typical window lengths are 300 - 500 s (e.g., Figure 2). In cases where the BATSE positions undergo substantial revision, a revised search window is calculated and the search is redone.
To carry out the search, the Ulysses real time count rates are extracted for the crossing window and plotted. The data are searched both automatically and by eye. In the automatic procedure, the background count rate is typically calculated over ten time intervals, and a increase is searched for over 2 or more consecutive time intervals. The search by eye confirms the presence of the increase, and in some cases, identifies increases that were not detected in the automatic procedure due, for example, to a long rise time. If the burst is intense enough to trigger the Ulysses GRB detector, burst detection is usually immediately apparent in both the real time and the triggered data streams, with one noteworthy exception. Very short bursts (durations 0.25 s) can trigger, but remain difficult to identify in the lower time resolution real time data. Conversely, long bursts which do not reach large peak intensities can be identified in the real time data, but may not trigger regardless of their time-integrated fluxes.
4 Deriving Annuli by Comparing BATSE and Ulysses Time Histories
When a GRB arrives at two spacecraft with a delay T, it may be localized to an annulus whose half-angle with respect to the vector joining the two spacecraft is given by cos=cT/D, where c is the speed of light and D is the distance between the two spacecraft. (This assumes that the burst is a plane wave, i.e. that its distance is much greater than D.) The annulus width d, and thus one dimension of the resulting error box, is c T)/Dsin where T) is the uncertainty in the time delay. This term has two components, one statistical and one systematic. The first is associated with the uncertainty in comparing the time histories of a burst recorded by two different instruments; the second is due to the uncertainty in the clock calibrations of the two spacecraft. A third source of error is the uncertainty in the knowledge of the spacecraft positions. We discuss each in turn.
In the simple case of identical detectors with identical backgrounds, the most probable delay T and its error T) may be estimated as follows. Denote the two background-subtracted time histories by Xi, Yi, i=1,…m, that is, X1 is the number of counts in the first time bin for detector X, and Y1 the number of counts in the first time bin for detector Y, and so on. Assume that the background can be estimated with arbitrary accuracy, and further that each value of Xi and Yi is an independent normal random variable with variance Xi and Yi respectively. For simplicity of notation, assume that the two time histories recorded by detectors X and Y are perfectly aligned when time bin 1 of detector X corresponds to time bin 1 of detector Y. Then for this perfect alignment, corresponding to zero lag between the two time histories, the quantity is a random variable with mean zero and variance unity for every i. Thus
| (1) |
is distributed as with n degrees of freedom. Here the sum is performed over some number n of time bins, where n m. Now allow the lag to vary slightly about zero, so that time bin i of detector X corresponds to time bin j of detector Y, and form the random variable where the lag ij is now variable. The quantity
| (2) |
where the summation is over the intervals which X and Y have in common, is similarly distributed as . In practice we do not know a priori the lag at which the best correlation will occur, so we test various lags ij until r reaches a minimum, r. Then the lag or time delay corresponding to a 3 equivalent confidence level is r=r+9. (All annuli in this catalog have widths corresponding to 3 equivalent confidence.)
Although this simple example describes the essential features of the method, there are numerous complicating factors in practice. For BATSE, the background varies over the orbit, and its value may not always be known accurately; the assumption of a normal distribution may also be violated when Cyg X-1 is in the field of view. The BATSE and Ulysses detectors have different areas, burst and background count rates, and time resolutions. We treat this by first, normalizing the BATSE background- subtracted time history to the Ulysses one so that two time histories have the same total number of counts. We also generate a BATSE time history with identical time resolution to the Ulysses one by scaling the counts in the original BATSE time bins. These adjustments complicate the above expressions considerably. However, through Monte-Carlo simulations, as well as time history comparisons using a completely different method (Laros et al. 1998), we have verified that the procedure gives correct results. In addition to calculating the r statistic, we also compute the correlation coefficient as a function of lag, namely
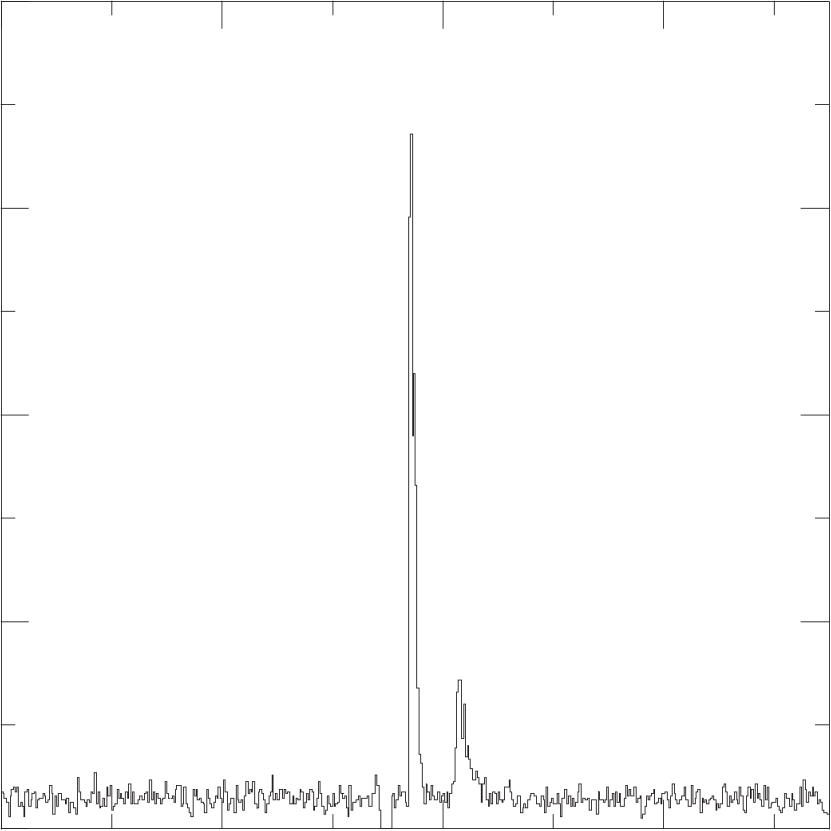
where the summations are over the intervals that X and Y have in common, and find its maximum value. The purpose of this calculation is to assure that the r statistic has indeed identified the best lag; we require that the maximum and the minimum r correspond to identical lags, or at worst, that the difference between the lags be much less than the 3 confidence interval. Finally, parabolic fits are done to both statistics to identify the best lag and the confidence intervals. An example is shown in Figures 3 and 4.
The second uncertainty, due to the clock calibrations, is in principle much smaller than the 3 confidence interval. The clock on the Compton Gamma-Ray Observatory is accurate to 100 s, and this accuracy is verified through pulsar timing. Onboard software increases the uncertainty in the BATSE trigger times to 1 ms. The clock on the Ulysses spacecraft is calibrated during each daily tracking pass, and the clock drift is extrapolated until the next pass to obtain the correct time; the calibration is verified at six month intervals by sending commands to the GRB experiment at precisely known times. The exact procedure is described in Hurley (1994). Due to spacecraft buffering of the commands, the result is that if it can be assumed that no errors larger than 125 ms are present, then the clock can be shown to be accurate to several milliseconds. For the purposes of triangulation, however, we take the extremely conservative approach that no 3 cross-correlation uncertainty is less than 125 ms. Larger timing errors have been identified in the past for both missions. The CGRO clock was found to have a consistent 2 s offset in the early part of the mission, and random timing errors between 0.25 and several hundred seconds occurred in certain types of Ulysses data. In all cases the data were reprocessed to obtain the results in this paper.
Finally, the uncertainties in the spacecraft ephemerides are truly negligible. The Ulysses range is known to 10 km, and the right ascension and declination of the spacecraft are accurate to 0.00003 degrees. The GRO range is known to better than 50 km, and the right ascension and declination to better than 0.01 degrees. The error that these uncertainties produce in the knowledge of the interspacecraft vector (i.e., the center of the annulus) is of order 0.0005 degrees, and therefore usually two orders of magnitude smaller than the timing uncertainties. As a conservative measure, this uncertainty is added linearly to the uncertainties in the annulus parameters caused by the timing. It typically increases the annulus width by several tenths of an arcsecond.
The radius of each annulus and its right ascension and declination are transformed to a heliocentric frame. This is equivalent to an aberration correction (maximum value 20 arcseconds), and involves two adjustments. The first is to the spacecraft time. The signal from a distant spacecraft may travel several thousand seconds on its way to Earth. Depending on the Earth’s velocity vector relative to the spacecraft, the relative motion of the Earth and the spacecraft may not be negligible during this period. “Geocentric” clock times are related to the position of the Earth when the signal is received from the spacecraft. “Heliocentric” clock times, i.e., times related to the position of the Earth when the signal was transmitted, must be used. The difference between the two may be as large as several hundred milliseconds, and is often comparable to or greater than the statistical uncertainty of the time history comparison. The second adjustment is to the inter-spacecraft vector. Two observers moving with the Earth and with the sun see different vectors (i.e., annulus centers) as a result of their motions during the burst’s transit time between the two spacecraft. This correction, too, may not be negligible. The result of triangulating the 1993 January 31 burst is shown in Figure 5.
Although there have never been more than three widely separated spacecraft in the 3rd IPN, which would have provided redundant determinations and therefore a verification of burst positions, there have been numerous instances where a burst source with a known position was triangulated with Ulysses , BATSE, and other spacecraft. These include the soft gamma repeater SGR1806-20 and the bursting pulsar GRO J1744-28 (Hurley et al. 1996, 1998a), the 1997 January 11 burst localized by BeppoSAX (Galama et al. 1997), the 1997 February 28 burst, with both a BeppoSAX location and an optical transient (Hurley et al. 1997c), and numerous other BeppoSAX bursts (e.g. Hurley et al. 1998b). In each case the triangulated position was in good agreement with the known position of the source.
5 Burst Selection Criteria
We have used several selection criteria for the bursts in this catalog. The first is that the burst must have been detected by Ulysses and BATSE. Because of the very different detector sizes, all the bursts satisfying this criterion are observed to be rather intense by BATSE, and therefore detection by BATSE is unambiguous. However, the weaker events (as observed by Ulysses in the real time mode) may be difficult to identify. In these cases, we rely on several supplementary semi-empirical criteria. One is that the r statistic, divided by the number of degrees of freedom, be less than unity. Another is that the maximum value of the correlation coefficient be greater than 0.5. Yet another is that the ratio of Ulysses counts to BATSE counts lie in the range 0.019 0.009. It might seem unusual that the average value of this ratio is 0.019, whereas the ratio of the the Ulysses projected area in any direction to a single BATSE LAD area is closer to 0.01, and the BATSE counts are derived from at least two LAD’s in this procedure. Several factors account for this. First, the Ulysses energy range is wider than BATSE’s: 25 - 150 keV vs. 25 - 100 keV. Second, the Ulysses lower energy threshold actually allows photons with energies as low as 15 keV to be counted, albeit with lower efficiency. Third, the two Ulysses hemispherical detectors are thin, so photons which do not interact in one hemisphere may interact in the other, increasing the effective area. Finally, the BATSE count rates are not corrected for dead time, which is known to affect the brighter bursts (which are in general among the bursts we observe).
This set of criteria is not an absolute one. To a good approximation, every gamma-ray burst is different from every other one. In addition, data gaps, Earth occultation, telemetry noise, unusual background behavior, and different data modes complicate some analyses. In some cases, bursts satisfying all the criteria above are rejected because they are simply too weak to allow reliable triangulation. In other cases, bursts which do not satisfy one or more criteria may be accepted.
A final criterion for inclusion in this catalog is that the burst must not have been observed by a third interplanetary spacecraft. The Ulysses / BATSE bursts also observed by Mars Observer have been published in Laros et al. (1997). The Ulysses /BATSE bursts also observed by Pioneer Venus Orbiter are in press (Laros et al. 1998).
6 A Few Statistics
Over the period covered by the 3B catalog, Ulysses observed 346 confirmed cosmic gamma-ray bursts (i.e., bursts that were observed by at least one other spacecraft). Of these, 274 were observed by Ulysses and BATSE and in some cases, other spacecraft as well. 111A list of all cosmic bursts and the spacecraft which detected them may be found at http://ssl.berkeley.edu/ipn3/index.html. Since BATSE observed 1122 bursts during this period, Ulysses observes approximately one out of every 4 BATSE bursts. Of the 274, 64 were observed by Ulysses in triggered mode, and 210 in real time mode. Finally, 220 were observed by Ulysses and BATSE, but not by a third interplanetary spacecraft; two of these could not be triangulated according to the criteria explained above.
The histogram of Figure 6 shows the distribution of annulus half-widths for the 218 bursts localized. The smallest is about 7 ″, the largest 32 ′, and the average is 4.5 ′. 158 of the annuli, or 72%, intersect the BATSE 1 error circles, whose radii are defined by , where is the systematic error, 1.6o, and is the statistical error. Figure 5 shows one example. This is less than the number which would be predicted (87%). An analysis of a preliminary version of the IPN catalog describes several more complicated BATSE error models that are consistent with the BATSE-IPN separations (Briggs et al. 1998a). A more extensive analysis, utilizing the Ulysses supplement to the 4B catalog, is in progress (Briggs et al. 1998b). One quantity of interest is how close the annulus passes to the center of the error circle. Let be the right ascension and declination of the center of a BATSE error circle, and let be the right ascension, declination, and radius of an annulus. Then the minimum distance between the error circle and the annulus is given by . A histogram of the distribution of minimum distances between the annuli and the centers of the BATSE error circles is given in Figure 7.
In general, the annuli obtained by triangulations are small circles on the celestial sphere, so their curvature, even across a relatively small BATSE error circle, is not always negligible, and a simple, four-sided error box cannot be defined. This curvature can be seen in Figure 5. For this reason, we do not cite the intersection points of the annulus with the error circle. However, we give here the formulas for finding these points for those cases where it may be useful. Let and be the right ascension, declination, and radii of the two small circles. Let be the right ascension and declination of the intersection points. Then
where
a=,
b=,
and
c=,
For each of the two values of the declination the corresponding right ascension is given by
Figure 8 shows the BATSE peak fluxes and fluences for 162 of the 218 bursts with flux and fluence entries in the 3B catalog. There is a slight tendency for some of the smaller fluence events to have relatively large peak fluxes over a time interval comparable to that of the Ulysses real time data, which helps to explain why these bursts were detected by Ulysses . To estimate the completeness of this catalog, we have calculated the ratios of the number of bursts detected by Ulysses to the number detected by BATSE above several flux and fluence thresholds starting with the weakest events in the BATSE catalog; we have used the 25-100 keV fluences in erg cm-2 and the peak 25 - 300 keV fluxes over 256 ms in photons cm-2 s-1. Since events detected by a third spacecraft are not included in the present catalog, the numbers given represent lower limits to the completeness. Table 1 summarizes the results.
| BATSE Threshold | Approximate completeness (lower limit) |
|---|---|
| 1.8 x 10⁻⁹ erg cm-2 | .25 |
| 10-6 erg cm-2 | .49 |
| 10-5 erg cm-2 | .74 |
| .27 photons cm-2 s-1 | .25 |
| 1 photon cm-2 s-1 | .34 |
| 10 photons cm-2 s-1 | .65 |
Finally, we have analyzed these annuli for intersections which might provide evidence of repeating bursts from a single source. Although there was a large, but statistically insignificant number of two annulus intersections, we found only one case where a three-way intersection almost occurred (BATSE bursts 451, 2286, and 2619); the data are therefore consistent with no burst repetition.
7 Table of Annuli
The ten columns in table 1 give: 1) the date of the burst, in ddmmyy format, 2) the Universal Time of the burst at Earth, 3) the BATSE number for the burst, 4) the BATSE right ascension of the center of the error circle (J2000), in degrees, 5) the BATSE declination of the center of the error circle (J2000), in degrees, 6) the total 1 statistical BATSE error circle radius, in degrees, (the approximate total 1 radius is obtained by adding 1.6o in quadrature, but see Briggs et al. 1998a,b for an improved error model), 7) the right ascension of the center of the IPN (BATSE/Ulysses ) annulus, epoch J2000, corrected to the heliocentric frame, in degrees, 8) the declination of the center of the IPN (BATSE/Ulysses ) annulus, epoch J2000, corrected to the heliocentric frame, in degrees, 9) the angular radius of the IPN (BATSE/Ulysses ) annulus, corrected to the heliocentric frame, in degrees, and 10) the half width of the IPN (BATSE/Ulysses ) annulus, in degrees; the 3 confidence annulus is given by RIPN RIPN.
This list supercedes previous ones which have been circulated in the past, but not published. The changes to it include: 1) the use of final time history and spacecraft ephemeris data; earlier lists often used preliminary and predict data, with correspondingly larger timing uncertainties, 2) transformation of annuli to heliocentric coordinates; earlier lists often gave geocentric coordinates, with correspondingly larger uncertainties in the annulus widths, 3) removal of weak events according to the criteria in section 5, 4) reprocessing of data to eliminate known clock errors, and 5) careful examination of bursts whose BATSE time histories were truncated by data gaps and Earth occultation.
Figures 9 and 10 compare the BATSE error circles with the IPN annulus/error circle intersections for the bursts in this catalog. To generate this plot, it was assumed that all annuli pass through the centers of their corresponding BATSE error circles.
We stress that while the BATSE data are for the bursts listed in the 3B catalog, the locations and error circle radii are in fact the updated ones which will appear in the 4B catalog. They have been taken from the latest online catalog, and are given here for convenience only. 222 The catalog (http://www.batse.msfc.nasa.gov/data/grb/4bcatalog/) should be considered to be the ultimate source of the most up-to-date BATSE data. Table 1 is available electronically from http://ssl.berkeley.edu/ipn3/index.html. Finally, we add that 150 Ulysses /BATSE bursts were detected over the period between the end of the 3B catalog and the end of the 4B catalog. Analysis of these events has been completed and is being published in conjunction with the 4B catalog.
| Date | UT | NB | RIPN | ||||||
|---|---|---|---|---|---|---|---|---|---|
| 250491 | 00:37:46 | 109 | 91.29 | -22.77 | 1.02 | 115.140 | 23.171 | 51.784 | 0.051 |
| 290491 | 03:11:50 | 121 | 174.75 | 14.33 | 1.36 | 116.426 | 22.919 | 59.157 | 0.136 |
| 020591 | 22:37:23 | 142 | 46.22 | -52.71 | 0.62 | 297.624 | -22.677 | 87.126 | 0.023 |
| 030591 | 07:04:13 | 143 | 87.45 | 38.74 | 0.87 | 117.731 | 22.655 | 30.360 | 0.009 |
| 110591 | 02:11:48 | 179 | 266.48 | 58.30 | 1.66 | 300.193 | -22.137 | 83.666 | 0.018 |
| 230591 | 19:03:25 | 222 | 106.99 | 0.36 | 1.28 | 124.202 | 21.228 | 26.847 | 0.051 |
| 010691 | 19:22:14 | 249 | 310.12 | 32.34 | 0.17 | 307.035 | -20.537 | 52.942 | 0.008 |
| 020691 | 22:55:01 | 257 | 142.76 | 53.99 | 2.06 | 127.387 | 20.448 | 34.526 | 0.163 |
| 260691 | 07:15:13 | 444 | 133.38 | 7.72 | 1.27 | 134.557 | 18.501 | 10.164 | 0.020 |
| 300691 | 07:37:02 | 469 | 304.70 | 35.13 | 0.91 | 315.764 | -18.148 | 52.439 | 0.085 |
| 210791 | 19:30:12 | 563 | 315.52 | -14.29 | 1.31 | 322.022 | -16.198 | 6.769 | 0.436 |
| 090891 | 06:15:00 | 659 | 195.43 | 19.37 | 1.85 | 147.088 | 14.483 | 50.860 | 0.092 |
| 090891 | 19:35:45 | 660 | 281.96 | 64.74 | 2.01 | 327.238 | -14.431 | 85.747 | 0.016 |
| 050991 | 23:48:55 | 761 | 360.00 | -81.05 | 0.82 | 334.075 | -11.942 | 70.787 | 0.017 |
| 070991 | 01:05:23 | 764 | 136.55 | -28.23 | 1.30 | 154.322 | 11.849 | 43.573 | 0.131 |
| 260991 | 18:25:57 | 824 | 346.07 | 21.36 | 2.70 | 338.688 | -10.171 | 32.155 | 0.294 |
| 270991 | 23:26:53 | 829 | 50.16 | -39.65 | 0.34 | 338.937 | -10.074 | 68.870 | 0.036 |
| 300991 | 11:55:30 | 841 | 131.80 | -20.62 | 1.27 | 159.447 | 9.874 | 39.201 | 0.013 |
| 061091 | 09:01:54 | 871 | 33.30 | -45.44 | 3.38 | 340.603 | -9.419 | 50.544 | 0.087 |
| 221091 | 04:13:58 | 914 | 123.91 | 70.34 | 1.03 | 163.395 | 8.312 | 68.583 | 0.017 |
| 261091 | 13:07:01 | 938 | 74.68 | -22.27 | 2.40 | 344.080 | -8.038 | 80.644 | 0.068 |
| 061191 | 03:42:01 | 1008 | 343.03 | -35.16 | 0.83 | 345.570 | -7.445 | 29.223 | 0.023 |
| 231191 | 08:15:33 | 1114 | 22.81 | 30.34 | 1.14 | 347.386 | -6.730 | 49.421 | 0.015 |
| 271191 | 04:22:08 | 1122 | 269.14 | 49.73 | 0.38 | 347.680 | -6.617 | 88.466 | 0.005 |
| 071291 | 09:50:45 | 1150 | 307.79 | 29.30 | 1.59 | 348.248 | -6.408 | 53.876 | 0.059 |
| 091291 | 18:35:58 | 1157 | 259.98 | -45.08 | 0.40 | 348.333 | -6.380 | 82.576 | 0.003 |
| 171291 | 08:22:06 | 1190 | 6.96 | 22.67 | 1.02 | 348.480 | -6.340 | 35.915 | 0.032 |
| 211291 | 22:03:26 | 1200 | 215.82 | -42.72 | 1.98 | 168.475 | 6.356 | 61.764 | 0.111 |
| 241291 | 11:02:58 | 1212 | 45.43 | -10.79 | 4.68 | 348.444 | -6.377 | 57.290 | 0.117 |
| 271291 | 01:05:53 | 1235 | 350.44 | -68.25 | 0.67 | 348.389 | -6.408 | 61.852 | 0.064 |
| 100192 | 09:17:58 | 1288 | 58.08 | -20.80 | 0.42 | 347.700 | -6.748 | 69.190 | 0.018 |
| 210292 | 06:14:32 | 1425 | 184.14 | 48.48 | 0.65 | 161.368 | 8.446 | 42.142 | 0.008 |
| 240292 | 02:43:39 | 1432 | 169.65 | -66.78 | 2.73 | 160.726 | 8.515 | 75.175 | 0.539 |
| 270292 | 06:00:51 | 1443 | 68.36 | 66.84 | 1.33 | 160.016 | 8.591 | 83.353 | 0.005 |
| 070392 | 00:18:04 | 1467 | 355.57 | -45.15 | 1.16 | 338.049 | -8.795 | 39.316 | 0.066 |
| 150392 | 04:19:27 | 1484 | 320.58 | -20.89 | 0.46 | 336.280 | -8.960 | 16.873 | 0.013 |
| 070492 | 12:03:40 | 1543 | 341.44 | -10.68 | 2.04 | 332.036 | -9.187 | 9.927 | 0.437 |
| 080492 | 12:05:56 | 1545 | 138.96 | 40.83 | 0.58 | 151.890 | 9.190 | 34.380 | 0.022 |
| 290492 | 18:59:32 | 1571 | 179.08 | -14.33 | 2.85 | 149.602 | 8.963 | 39.318 | 0.091 |
| 020592 | 06:02:59 | 1577 | 33.05 | -17.73 | 1.04 | 329.440 | -8.908 | 60.781 | 0.026 |
| 130592 | 16:52:39 | 1606 | 211.16 | -44.77 | 0.65 | 148.956 | 8.591 | 74.250 | 0.005 |
| 300592 | 22:59:55 | 1630 | 162.68 | 18.13 | 1.67 | 148.993 | 7.901 | 17.618 | 0.070 |
| 170692 | 05:26:51 | 1652 | 37.66 | 77.51 | 0.51 | 149.807 | 6.977 | 89.064 | 0.012 |
| 220692 | 07:05:05 | 1663 | 162.10 | 47.17 | 0.31 | 150.169 | 6.667 | 41.336 | 0.005 |
| 220692 | 12:54:21 | 1664 | 346.81 | 10.01 | 0.55 | 330.187 | -6.649 | 18.892 | 0.018 |
| 270692 | 13:02:36 | 1676 | 166.02 | -2.58 | 0.65 | 150.593 | 6.327 | 23.504 | 0.017 |
| 010792 | 19:38:19 | 1683 | 314.64 | 33.44 | 0.63 | 330.973 | -6.033 | 42.560 | 0.017 |
| 140792 | 20:23:26 | 1700 | 140.36 | -44.64 | 3.28 | 152.298 | 5.079 | 50.262 | 0.099 |
| 180792 | 14:40:36 | 1708 | 22.44 | -3.98 | 1.14 | 332.718 | -4.782 | 49.196 | 0.032 |
| 180792 | 21:32:43 | 1709 | 296.39 | -55.98 | 0.48 | 332.751 | -4.760 | 58.948 | 0.004 |
| 210792 | 18:17:48 | 1717 | 37.55 | 33.49 | 0.73 | 333.083 | -4.530 | 72.485 | 0.033 |
| 230792 | 01:00:34 | 1721 | 85.79 | 7.78 | 0.48 | 153.234 | 4.427 | 68.971 | 0.008 |
| 010892 | 01:16:40 | 1733 | 157.86 | 68.90 | 1.12 | 154.338 | 3.667 | 64.462 | 0.021 |
| 130892 | 03:33:48 | 1807 | 206.22 | -28.34 | 1.75 | 155.907 | 2.581 | 63.921 | 0.051 |
| 140892 | 06:09:53 | 1815 | 258.68 | -44.63 | 0.79 | 336.053 | -2.478 | 78.143 | 0.006 |
| 240892 | 10:53:03 | 1872 | 228.59 | -51.79 | 0.33 | 157.427 | 1.505 | 76.788 | 0.003 |
| 300892 | 01:45:18 | 1883 | 258.53 | -73.99 | 0.54 | 338.192 | -0.949 | 86.267 | 0.010 |
| 020992 | 00:29:05 | 1886 | 279.15 | -20.70 | 2.29 | 338.594 | -0.651 | 61.607 | 0.015 |
| 030992 | 00:49:17 | 1888 | 61.97 | -68.37 | 0.75 | 338.732 | -0.549 | 88.165 | 0.010 |
| 250992 | 21:45:16 | 1956 | 160.26 | 67.38 | 1.34 | 161.773 | -1.864 | 68.233 | 0.020 |
| 031092 | 06:35:40 | 1974 | 150.32 | -14.71 | 0.55 | 162.694 | -2.674 | 19.765 | 0.021 |
| 091092 | 06:41:11 | 1983 | 120.41 | -29.10 | 0.39 | 163.411 | -3.345 | 46.240 | 0.003 |
| 151092 | 01:36:32 | 1989 | 123.04 | 41.69 | 0.95 | 164.066 | -3.998 | 57.677 | 0.040 |
| 221092 | 15:20:59 | 1997 | 253.78 | -12.42 | 0.41 | 164.862 | -4.861 | 88.377 | 0.002 |
| 291092 | 12:37:56 | 2018 | 34.14 | -1.57 | 1.67 | 345.514 | 5.651 | 50.169 | 0.045 |
| 301092 | 01:16:31 | 2020 | 86.16 | 6.86 | 1.75 | 165.561 | -5.710 | 79.293 | 0.042 |
| 181192 | 22:11:44 | 2061 | 350.45 | 50.32 | 1.07 | 346.930 | 7.990 | 41.232 | 0.128 |
| 231192 | 06:18:31 | 2067 | 334.24 | -53.25 | 0.72 | 347.111 | 8.481 | 64.897 | 0.008 |
| 031292 | 21:44:22 | 2074 | 233.62 | 21.03 | 0.74 | 167.337 | -9.664 | 68.339 | 0.119 |
| 061292 | 18:24:19 | 2080 | 176.48 | 45.72 | 0.77 | 167.341 | -9.975 | 51.667 | 0.029 |
| 071292 | 16:00:48 | 2083 | 306.33 | -42.93 | 0.44 | 347.336 | 10.074 | 62.709 | 0.003 |
| 091292 | 02:40:56 | 2089 | 172.98 | 61.45 | 0.51 | 167.325 | -10.228 | 68.392 | 0.048 |
| 091292 | 11:35:38 | 2090 | 332.97 | -52.02 | 0.68 | 347.320 | 10.269 | 63.995 | 0.009 |
| 181292 | 02:30:02 | 2102 | 355.62 | -55.31 | 1.76 | 347.091 | 11.168 | 66.903 | 0.076 |
| 271292 | 12:44:08 | 2106 | 206.33 | -25.65 | 1.04 | 166.535 | -12.089 | 39.698 | 0.113 |
| 301292 | 08:57:51 | 2110 | 19.52 | 17.21 | 0.33 | 346.301 | 12.353 | 32.939 | 0.112 |
| 301292 | 14:05:46 | 2111 | 150.54 | 28.63 | 1.71 | 166.282 | -12.370 | 45.110 | 0.086 |
| 060193 | 15:37:39 | 2121 | 6.08 | 2.00 | 0.53 | 345.556 | 12.984 | 21.048 | 0.021 |
| 060193 | 19:57:15 | 2122 | 124.79 | -32.62 | 0.68 | 165.536 | -12.996 | 42.302 | 0.149 |
| 080193 | 02:28:55 | 2123 | 94.62 | -30.44 | 0.99 | 165.383 | -13.100 | 65.116 | 0.069 |
| 120193 | 03:47:31 | 2127 | 226.32 | 27.74 | 1.22 | 164.853 | -13.415 | 72.911 | 0.021 |
| 120193 | 15:18:02 | 2128 | 210.10 | 51.92 | 1.02 | 164.786 | -13.451 | 76.849 | 0.066 |
| 160193 | 02:47:02 | 2136 | 246.99 | 15.91 | 1.02 | 164.275 | -13.700 | 88.748 | 0.026 |
| 270193 | 16:14:25 | 2149 | 310.95 | -39.63 | 1.16 | 342.242 | 14.382 | 60.557 | 0.155 |
| 310193 | 18:57:12 | 2151 | 182.04 | -8.24 | 2.16 | 161.406 | -14.563 | 22.249 | 0.009 |
| 010293 | 16:41:55 | 2156 | 333.53 | 41.15 | 1.26 | 341.214 | 14.601 | 27.869 | 0.023 |
| 050293 | 10:10:31 | 2166 | 278.00 | -45.74 | 5.98 | 340.403 | 14.729 | 83.936 | 0.277 |
| 170293 | 14:44:38 | 2197 | 117.78 | 0.98 | 2.27 | 157.517 | -14.945 | 41.809 | 0.234 |
| 020393 | 21:33:17 | 2213 | 90.33 | 5.43 | 0.62 | 154.166 | -14.821 | 66.384 | 0.016 |
| 090393 | 03:07:50 | 2228 | 325.41 | 51.73 | 0.72 | 332.605 | 14.648 | 36.594 | 0.012 |
| 100393 | 07:19:20 | 2232 | 284.35 | -52.39 | 0.89 | 332.316 | 14.607 | 79.362 | 0.007 |
| 180393 | 12:29:53 | 2255 | 150.48 | -18.85 | 1.09 | 150.361 | -14.267 | 5.323 | 0.320 |
| 290393 | 03:09:25 | 2273 | 179.25 | -8.65 | 0.94 | 148.090 | -13.723 | 35.582 | 0.010 |
| 310393 | 03:11:16 | 2276 | 43.00 | 47.27 | 2.03 | 327.701 | 13.613 | 77.070 | 0.078 |
| 050493 | 08:54:49 | 2286 | 198.18 | -8.80 | 0.55 | 146.754 | -13.315 | 52.136 | 0.005 |
| 060493 | 07:16:25 | 2289 | 299.81 | 29.01 | 0.51 | 326.595 | 13.263 | 31.383 | 0.011 |
| 090493 | 04:50:10 | 2295 | 295.83 | 43.18 | 2.04 | 326.125 | 13.098 | 37.466 | 0.366 |
| 090493 | 21:25:40 | 2297 | 176.91 | -39.75 | 1.25 | 146.019 | -13.056 | 39.155 | 0.088 |
| 140493 | 02:27:15 | 2303 | 311.42 | 9.92 | 0.91 | 325.406 | 12.819 | 14.314 | 0.061 |
| 180493 | 14:38:18 | 2307 | 311.65 | 21.37 | 1.27 | 324.831 | 12.570 | 14.596 | 0.415 |
| 240493 | 19:19:00 | 2315 | 54.22 | 41.60 | 1.67 | 324.179 | 12.245 | 86.680 | 0.134 |
| 250493 | 10:17:29 | 2316 | 18.00 | -35.19 | 0.31 | 324.122 | 12.214 | 70.285 | 0.034 |
| 260493 | 12:40:32 | 2319 | 67.82 | 10.13 | 1.10 | 144.025 | -12.159 | 75.515 | 0.028 |
| 280493 | 01:07:12 | 2320 | 129.85 | -55.45 | 1.68 | 143.900 | -12.085 | 46.202 | 0.005 |
| 300493 | 15:01:18 | 2321 | 106.33 | 20.97 | 0.36 | 143.709 | -11.967 | 50.803 | 0.009 |
| 020593 | 13:52:52 | 2323 | 254.72 | -46.53 | 0.78 | 323.580 | 11.882 | 87.103 | 0.039 |
| 060593 | 14:52:51 | 2329 | 64.45 | -5.97 | 0.24 | 143.364 | -11.717 | 77.827 | 0.004 |
| 180593 | 03:20:25 | 2346 | 349.17 | -37.51 | 1.04 | 323.086 | 11.354 | 53.387 | 0.019 |
| 230593 | 19:40:53 | 2350 | 14.80 | 4.21 | 2.64 | 323.121 | 11.238 | 44.153 | 0.124 |
| 310593 | 15:53:38 | 2362 | 340.04 | 13.25 | 2.16 | 323.341 | 11.152 | 15.895 | 0.044 |
| 090693 | 10:07:24 | 2383 | 208.73 | -16.38 | 1.62 | 143.799 | -11.158 | 64.377 | 0.132 |
| 140693 | 03:40:30 | 2393 | 168.14 | 23.95 | 1.15 | 144.132 | -11.210 | 42.800 | 0.008 |
| 050793 | 12:39:08 | 2429 | 283.08 | -39.24 | 0.99 | 326.244 | 11.861 | 65.410 | 0.124 |
| 060793 | 08:09:10 | 2432 | 210.09 | -1.36 | 1.31 | 146.342 | -11.898 | 63.498 | 0.045 |
| 080793 | 05:12:38 | 2433 | 86.55 | -69.02 | 6.25 | 146.572 | -11.989 | 62.867 | 0.076 |
| 090793 | 06:14:22 | 2436 | 194.41 | -46.73 | 0.67 | 146.700 | -12.042 | 54.525 | 0.028 |
| 140793 | 16:12:53 | 2446 | 257.70 | 23.70 | 0.97 | 327.399 | 12.344 | 68.720 | 0.048 |
| 210793 | 01:17:22 | 2452 | 78.66 | -33.15 | 1.52 | 148.275 | -12.751 | 66.262 | 0.085 |
| 210793 | 12:45:35 | 2453 | 298.58 | -40.79 | 1.79 | 328.342 | 12.785 | 61.079 | 0.101 |
| 270793 | 08:08:29 | 2466 | 159.99 | -23.89 | 1.28 | 149.185 | -13.209 | 16.546 | 0.136 |
| 310793 | 03:16:31 | 2475 | 116.53 | 45.49 | 2.15 | 149.754 | -13.514 | 66.345 | 0.036 |
| 050893 | 12:39:28 | 2482 | 334.55 | -15.60 | 0.83 | 330.584 | 13.983 | 30.305 | 0.208 |
| 090893 | 05:11:04 | 2486 | 37.97 | -74.63 | 1.79 | 151.166 | -14.323 | 80.857 | 0.088 |
| 220893 | 14:44:51 | 2500 | 213.09 | -0.68 | 2.28 | 153.348 | -15.724 | 65.872 | 0.232 |
| 310893 | 09:16:05 | 2507 | 223.29 | -3.63 | 0.47 | 154.815 | -16.774 | 67.536 | 0.007 |
| 030993 | 00:19:29 | 2511 | 88.67 | -10.42 | 4.20 | 155.258 | -17.109 | 64.672 | 0.109 |
| 050993 | 03:26:30 | 2514 | 310.95 | -1.22 | 0.63 | 335.615 | 17.389 | 28.629 | 0.006 |
| 100993 | 12:12:08 | 2522 | 167.59 | -66.69 | 0.54 | 156.521 | -18.114 | 48.810 | 0.044 |
| 140993 | 02:49:11 | 2530 | 34.26 | 34.29 | 1.53 | 337.128 | 18.628 | 50.198 | 0.173 |
| 160993 | 20:19:23 | 2533 | 280.71 | 65.39 | 0.22 | 337.586 | 19.026 | 57.392 | 0.013 |
| 220993 | 06:24:46 | 2537 | 271.20 | 55.89 | 0.45 | 338.488 | 19.847 | 67.999 | 0.003 |
| 270993 | 04:18:07 | 2542 | 108.61 | -9.52 | 1.62 | 159.296 | -20.624 | 52.084 | 0.115 |
| 061093 | 21:31:50 | 2566 | 66.31 | 65.28 | 1.70 | 340.850 | 22.262 | 70.461 | 0.049 |
| 081093 | 07:18:14 | 2570 | 42.98 | 21.37 | 0.85 | 341.069 | 22.510 | 58.202 | 0.082 |
| 081093 | 11:09:10 | 2571 | 165.40 | 33.93 | 0.86 | 161.094 | -22.537 | 60.104 | 0.027 |
| 141093 | 17:01:01 | 2586 | 272.50 | 9.34 | 0.50 | 342.042 | 23.672 | 67.956 | 0.010 |
| 171093 | 01:17:49 | 2590 | 181.44 | -83.11 | 0.65 | 162.389 | -24.110 | 58.979 | 0.003 |
| 191093 | 18:22:34 | 2593 | 242.92 | -18.70 | 1.66 | 162.779 | -24.628 | 73.476 | 0.025 |
| 241093 | 13:29:09 | 2603 | 137.63 | -8.49 | 0.53 | 163.447 | -25.567 | 30.574 | 0.083 |
| 261093 | 11:35:57 | 2606 | 51.36 | -10.56 | 0.48 | 343.704 | 25.955 | 75.482 | 0.087 |
| 301093 | 08:08:42 | 2609 | 326.41 | 58.24 | 0.55 | 344.202 | 26.745 | 31.863 | 0.058 |
| 311093 | 04:06:35 | 2611 | 325.10 | 62.73 | 0.32 | 344.306 | 26.918 | 37.073 | 0.005 |
| 031193 | 16:25:42 | 2617 | 87.88 | 65.05 | 0.31 | 344.732 | 27.657 | 72.278 | 0.008 |
| 061193 | 20:32:04 | 2619 | 196.75 | -3.13 | 1.11 | 165.094 | -28.337 | 40.406 | 0.232 |
| 121193 | 18:45:53 | 2628 | 311.51 | 55.95 | 0.53 | 345.711 | 29.654 | 34.291 | 0.010 |
| 261193 | 04:46:46 | 2660 | 157.28 | 70.08 | 3.02 | 346.750 | 32.795 | 80.134 | 0.109 |
| 261193 | 19:31:39 | 2661 | 3.29 | -17.40 | 0.22 | 346.785 | 32.945 | 50.498 | 0.004 |
| 041293 | 09:48:10 | 2676 | 250.15 | 38.23 | 0.18 | 347.083 | 34.824 | 76.909 | 0.004 |
| 051293 | 14:59:51 | 2679 | 15.56 | 66.49 | 2.22 | 347.108 | 35.133 | 38.364 | 0.018 |
| 081293 | 04:37:19 | 2682 | 198.73 | -29.93 | 0.56 | 167.142 | -35.783 | 34.384 | 0.050 |
| 081293 | 09:34:40 | 2683 | 234.11 | -40.29 | 3.06 | 167.143 | -35.836 | 51.960 | 0.143 |
| 211293 | 02:09:50 | 2700 | 91.02 | -43.17 | 0.50 | 166.799 | -39.143 | 56.073 | 0.036 |
| 221293 | 21:21:33 | 2703 | 192.52 | 28.65 | 0.66 | 166.675 | -39.621 | 73.261 | 0.251 |
| 251293 | 23:20:12 | 2709 | 4.85 | 9.87 | 0.79 | 346.415 | 40.440 | 35.141 | 0.212 |
| 261293 | 20:11:09 | 2711 | 205.95 | 21.63 | 2.82 | 166.329 | -40.669 | 74.178 | 0.127 |
| 010194 | 22:42:00 | 2729 | 189.27 | 62.84 | 3.47 | 345.578 | 42.289 | 78.226 | 0.064 |
| 020194 | 02:45:52 | 2732 | 10.90 | 45.11 | 1.27 | 345.554 | 42.335 | 18.951 | 0.195 |
| 030194 | 22:12:56 | 2736 | 267.90 | 7.14 | 0.65 | 345.274 | 42.810 | 76.721 | 0.016 |
| 130194 | 16:47:54 | 2756 | 209.39 | -23.16 | 9.65 | 163.289 | -45.332 | 42.651 | 0.049 |
| 190194 | 15:44:40 | 2773 | 131.41 | 39.29 | 1.39 | 161.654 | -46.793 | 89.606 | 0.051 |
| 280194 | 16:50:58 | 2790 | 224.02 | -15.22 | 0.96 | 158.510 | -48.816 | 64.647 | 0.059 |
| 290194 | 10:43:17 | 2793 | 127.46 | 28.59 | 0.82 | 158.217 | -48.971 | 81.612 | 0.072 |
| 010294 | 07:40:40 | 2794 | 268.61 | 22.37 | 1.67 | 337.027 | 49.542 | 59.277 | 0.125 |
| 030294 | 15:46:56 | 2797 | 184.16 | -40.95 | 0.58 | 156.002 | -49.973 | 20.512 | 0.052 |
| 060294 | 00:08:37 | 2798 | 144.20 | -59.96 | 0.15 | 154.922 | -50.380 | 13.687 | 0.039 |
| 100294 | 19:13:16 | 2812 | 152.29 | 82.13 | 0.66 | 332.566 | 51.121 | 48.298 | 0.007 |
| 170294 | 23:02:42 | 2831 | 29.07 | 4.55 | 0.69 | 328.739 | 51.947 | 69.334 | 0.005 |
| 180294 | 19:32:28 | 2833 | 349.71 | -19.69 | 0.35 | 328.264 | 52.023 | 73.939 | 0.010 |
| 280294 | 11:29:00 | 2852 | 127.98 | -12.36 | 0.44 | 142.713 | -52.495 | 42.173 | 0.012 |
| 010394 | 20:10:37 | 2855 | 103.51 | 64.35 | 0.35 | 321.919 | 52.509 | 59.400 | 0.029 |
| 020394 | 05:08:31 | 2856 | 12.49 | -23.97 | 0.21 | 321.700 | 52.508 | 88.572 | 0.005 |
| 120394 | 11:28:22 | 2877 | 221.50 | -56.17 | 0.61 | 135.895 | -52.124 | 48.964 | 0.052 |
| 190394 | 23:57:20 | 2889 | 68.74 | -12.60 | 0.39 | 132.014 | -51.403 | 62.552 | 0.090 |
| 210394 | 22:05:07 | 2890 | 160.33 | 3.10 | 0.85 | 131.093 | -51.168 | 58.918 | 0.233 |
| 230394 | 22:04:38 | 2891 | 213.89 | 8.37 | 0.85 | 310.173 | 50.907 | 85.032 | 0.016 |
| 280394 | 12:05:34 | 2894 | 97.18 | -32.35 | 0.58 | 128.216 | -50.236 | 26.692 | 0.028 |
| 290394 | 05:49:26 | 2895 | 237.51 | -68.89 | 0.50 | 127.917 | -50.121 | 51.112 | 0.006 |
| 290394 | 18:15:37 | 2897 | 204.91 | -10.33 | 1.00 | 127.712 | -50.040 | 69.434 | 0.026 |
| 300394 | 20:44:39 | 2899 | 193.80 | -33.63 | 1.72 | 127.286 | -49.861 | 48.714 | 0.320 |
| 060494 | 01:10:54 | 2913 | 225.44 | -39.10 | 1.24 | 125.133 | -48.806 | 69.435 | 0.043 |
| 100494 | 15:45:02 | 2919 | 254.89 | 30.80 | 0.93 | 303.788 | 47.974 | 42.261 | 0.047 |
| 120494 | 01:40:31 | 2922 | 217.17 | -38.35 | 1.12 | 123.422 | -47.710 | 58.846 | 0.303 |
| 140494 | 16:46:25 | 2929 | 181.26 | -26.15 | 0.50 | 122.794 | -47.222 | 49.154 | 0.026 |
| 190494 | 19:10:58 | 2940 | 359.86 | -47.95 | 0.58 | 121.768 | -46.270 | 73.314 | 0.062 |
| 290494 | 00:43:53 | 2953 | 35.10 | -57.52 | 0.32 | 120.524 | -44.594 | 51.727 | 0.006 |
| 030594 | 05:07:44 | 2958 | 161.00 | 10.06 | 0.60 | 120.195 | -43.873 | 64.039 | 0.057 |
| 120594 | 17:37:50 | 2974 | 232.97 | 55.88 | 2.65 | 299.935 | 42.376 | 44.482 | 0.007 |
| 200594 | 00:21:38 | 2984 | 323.50 | 6.93 | 0.88 | 300.146 | 41.389 | 40.428 | 0.019 |
| 260594 | 10:55:26 | 2993 | 80.41 | -30.39 | 0.96 | 120.590 | -40.650 | 33.571 | 0.347 |
| 260594 | 20:20:05 | 2994 | 131.85 | 34.20 | 1.69 | 120.622 | -40.611 | 76.690 | 0.012 |
| 290594 | 03:17:02 | 2998 | 163.64 | -25.33 | 3.45 | 120.834 | -40.382 | 35.002 | 0.334 |
| 290594 | 16:20:36 | 3002 | 66.19 | -23.75 | 3.30 | 120.889 | -40.330 | 47.443 | 0.021 |
| 290594 | 21:18:56 | 3003 | 214.84 | 58.93 | 0.46 | 300.908 | 40.314 | 56.125 | 0.083 |
| 090694 | 16:29:06 | 3024 | 284.14 | 23.34 | 1.01 | 302.269 | 39.513 | 18.866 | 0.118 |
| 190694 | 21:31:20 | 3035 | 299.05 | -29.89 | 0.34 | 303.996 | 39.141 | 69.575 | 0.026 |
| 220694 | 13:18:16 | 3039 | 299.58 | -31.24 | 0.82 | 304.505 | 39.108 | 72.495 | 0.012 |
| 230694 | 18:46:23 | 3042 | 108.37 | 75.78 | 0.46 | 304.747 | 39.101 | 65.666 | 0.013 |
| 010794 | 21:46:38 | 3055 | 145.18 | -6.43 | 0.81 | 126.479 | -39.199 | 37.139 | 0.157 |
| 020794 | 09:28:11 | 3056 | 29.73 | -23.53 | 0.57 | 126.586 | -39.214 | 78.876 | 0.116 |
| 030794 | 04:40:46 | 3057 | 131.50 | 27.39 | 1.25 | 126.771 | -39.239 | 67.508 | 0.005 |
| 040794 | 23:32:07 | 3060 | 212.49 | 47.25 | 0.64 | 307.181 | 39.305 | 67.688 | 0.082 |
| 060794 | 19:24:33 | 3062 | 265.11 | 26.40 | 1.86 | 307.614 | 39.384 | 36.694 | 0.287 |
| 080794 | 20:42:06 | 3067 | 301.58 | 24.66 | 1.02 | 308.112 | 39.490 | 17.427 | 0.022 |
| 140794 | 12:54:21 | 3075 | 333.58 | -42.10 | 1.59 | 309.555 | 39.862 | 85.495 | 0.067 |
| 170794 | 03:24:29 | 3087 | 109.80 | 12.93 | 0.71 | 130.246 | -40.076 | 54.328 | 0.006 |
| 280794 | 02:55:32 | 3099 | 42.57 | -49.08 | 0.76 | 133.354 | -41.280 | 60.269 | 0.045 |
| 280794 | 14:06:40 | 3100 | 291.22 | 4.45 | 1.29 | 313.491 | 41.344 | 44.189 | 0.181 |
| 280794 | 23:58:54 | 3101 | 85.49 | -39.87 | 1.44 | 133.620 | -41.397 | 36.263 | 0.066 |
| 060894 | 04:38:48 | 3108 | 276.21 | -31.33 | 10.69 | 316.177 | 42.651 | 86.962 | 0.079 |
| 060894 | 09:32:56 | 3109 | 242.38 | 13.65 | 1.22 | 316.242 | 42.686 | 69.105 | 0.126 |
| 100894 | 02:22:42 | 3115 | 212.01 | -17.47 | 0.53 | 137.468 | -43.347 | 67.696 | 0.009 |
| 120894 | 00:27:42 | 3119 | 340.49 | -46.12 | 2.23 | 138.120 | -43.715 | 86.692 | 0.263 |
| 170894 | 08:40:15 | 3128 | 280.84 | 3.47 | 0.40 | 319.994 | 44.823 | 53.907 | 0.010 |
| 210894 | 21:51:27 | 3131 | 294.69 | 43.48 | 1.77 | 321.670 | 45.864 | 16.142 | 0.191 |
| 260894 | 20:55:20 | 3138 | 93.59 | -34.63 | 0.45 | 143.593 | -47.103 | 37.845 | 0.013 |
| 300894 | 08:59:56 | 3143 | 193.66 | 25.66 | 1.58 | 145.011 | -48.048 | 89.313 | 0.042 |
| 100994 | 19:31:24 | 3163 | 332.01 | -34.11 | 0.94 | 330.099 | 51.525 | 87.032 | 0.065 |
| 150994 | 06:52:19 | 3168 | 219.42 | 47.70 | 4.53 | 332.318 | 53.052 | 62.836 | 0.393 |
8 Acknowledgments
Support for the Ulysses GRB experiment is provided by JPL Contract 958056. Joint analysis of Ulysses and BATSE data is supported by NASA Grant NAG 5-1560. CK acknowledges support from NASA Grant NAG5-2560.
References
- (1) Briggs, M., Pendleton, G., Brainerd, J., Connaughton, V., Kippen, R. M., Meegan, C., and Hurley, K. 1998a, in Gamma-Ray Bursts: 4th Huntsville Symposium, eds. C. Meegan, R. Preece, and T. Koshut, (AIP: New York), p. 104
- (2) Briggs, M., et al. 1998b, ApJS, in press
- (3) Galama, T., et al. 1997, ApJ, 486, L5
- (4) Hurley, K. 1994, in Gamma-Ray Bursts - Second Workshop, eds. J. Fishman, J. Brainerd, and K. Hurley, AIP Conference Proceedings 307 (AIP: New York), 682
- (5) Hurley, K., et al. 1992, Astron. Astrophys. Suppl. Ser., 92(2), 401
- (6) Hurley, K., et al. 1996, BAAS, 28(4), 1408
- (7) Hurley, K., et al. 1997a, ApJ, 479, L113
- (8) Hurley, K., et al. 1997b, Proc. 25th ICRC, Durban, South Africa, OG 2.2.6, 45
- (9) Hurley, K., et al. 1997c, ApJ, 485, L1
- (10) Hurley, K., et al. 1998a, in Gamma-Ray Bursts: 4th Huntsville Symposium, eds. C. Meegan, R. Preece, and T. Koshut, (AIP: New York), p. 50
- (11) Hurley, K., et al. 1998b, in The Active X-Ray Sky: Results from BeppoSAX and Rossi-XTE, eds. L. Scarsi, H. Bradt, P. Giommi, and F. Fiore, Nucl. Phys. B (Proceedings Supplement), 69(1-3), p.660
- (12) Kippen, M., Hurley, K., and Pendleton, G. 1998, in Gamma-Ray Bursts: 4th Huntsville Symposium, eds. C. Meegan, R. Preece, and T. Koshut, (AIP: New York), p. 114
- (13) Kolatt, T., and Piran, T. 1996, ApJ, 467, L41
- (14) Kulkarni, S., et al. 1998, Nature, 393, 35
- (15) Laros, J., et al., 1997, ApJS, 110, 157
- (16) Laros, J., et al., 1998, ApJS, accepted
- (17) Meegan, C., et al., 1996, ApJS, 106, 45
- (18) Metzger, M., et al., 1997, Nature, 387, 878
- (19) Paczynski, B. 1991, Acta Astronomica, 41, 257
- (20) Schartel, N., Andernach, H., and Greiner, J. 1997, A&A, 323, 659
- (21) Struble, M., and Rood, H. 1997, ApJ, 490, 109
- (22) Tokanai, F., et al. 1997, PASJ, 49, 207