Optical and UV observations of a strong flare in the young, single K2-dwarf LQ Hya ††thanks: Based on observations made with the William Herschel operated on the island of La Palma by the Royal Greenwich Observatory at the Spanish Observatorio del Roque de Los Muchachos of the Instituto de Astrofísica de Canarias, and on data obtained with the International Ultraviolet Explorer
Abstract
We present high resolution optical echelle spectra and IUE observations during a strong flare on 1993 December 22 in the very active, young, rapidly rotating, single K2 dwarf LQ Hya. The initial impulsive phase of the flare, which started sometime between 2:42 UT and 4:07 UT, was characterized by strong optical continuum enhancement and blue-shifted emission lines with broad wings. The optical chromospheric lines reached their maximum intensity at 5:31 UT, by which time the blue-shift vanished and the optical continuum enhancement had sharply decreased. Thereafter, the line emission slowly decreased and the lines red-shift in a gradual phase that lasted at least two more hours. The Mg ii lines behaved similarly. Quiescent C iv flux levels were not recovered until 21 hours later, though a data gap and a possible second flare make the interpretation uncertain. In addition to the typically flare-enhanced emission lines (e.g., H and H), we observe He i D3 going into emission, plus excess emission (after subtraction of the quiescent spectrum) in other He i and several strong neutral metal lines (e.g., Mg i b). Flare enhancement of the far UV continuum generally agrees with a Si i recombination model. We estimate the total flare energy, and discuss the broad components, asymmetries, and Doppler shifts seen in some of the emission lines.
keywords:
stars: flare – stars: individual: LQ Hya – stars: activity – stars: chromospheres – stars: late-type – line: profiles1 Introduction
LQ Hya (HD 82558) is a rapidly rotating (v sini = 25 km s-1), single K2 dwarf, classified as a BY Dra variable (Fekel et al. 1986a; Fekel, Moffett & Henry 1986b; Strassmeier & Hall 1988), with a photometric rotational period of 1.600881 days (Strassmeier et al. 1997). Its high lithium abundance (Fekel et al. 1986a) suggests LQ Hya has age years (at least as young as the youngest Pleiades star); Vilhu, Gustafsson & Walter (1991) even suggest that it may be a pre-main sequence object. Saar, Piskunov & Tuominen (1992, 1994), Strassmeier et al. (1993) and Rice & Strassmeier (1998) found variable spot distribution in this star using Doppler-imaging, and widespread magnetic fields have been detected by Saar et al. (1992, 1994), Basri & Marcy (1994), Donati et al. (1997), and Donati (1998).
LQ Hya is also (not surprisingly) a very active star, as indicated by emission in several chromospheric lines, including Ca ii H & K (Fekel et al. 1986a,b; Strassmeier et al. 1990), Ca ii 8542 (Basri & Marcy 1994), and H (Vilhu et al. 1991), which can also appear as partly (Strassmeier et al. 1993) or completely filled-in absorption (Fekel et al. 1986a). A filled-in He i D3 line is reported by Vilhu et al. (1991) and Saar et al. (1997). Strong UV chromospheric and transition region emission lines have also been found by Simon & Fekel (1987), and the star has been detected by ROSAT (Pye et al. 1995) and EUVE (Bowyer et al. 1996).
Flares are believed to result from the release of magnetic free energy stored in the corona through reconnection (see reviews by Mirzoyan 1984; Haisch, Strong & Rodonò 1991). Many types of cool stars flare (Pettersen 1989), sometimes at levels several orders of magnitude more energetic than their solar counterparts. In the dMe stars (or UV Cet type stars) optical flares are a common phenomenon, however, in more luminous stars flares are usually only detected through UV or X-ray observations (e.g., Landini et al. 1986; Hünsch & Reimers 1995; Ayres et al. 1994); optical flares are rare (Catalano 1990; Saar, Nördstrom & Andersen 1990; Henry & Newsom 1996).
Ambruster & Fekel (1990) detected a strong ultraviolet flare on LQ Hya in four continuum bands between 1250 and 1850 Å, while no enhancement was evident in any of the chromospheric lines. Recently, HST GHRS observations by Saar & Bookbinder (1998) showed that many low-level flares are present in the transition region lines of this star. But consistent with its K2 spectral type and correspondingly increased optical continuum, strong optical flares are rare on LQ Hya (Montes et al. 1998b); Henry & Newsom (1996), for example, saw none.
In this paper, we report one of these rare events: the detection of an unusually strong optical flare in LQ Hya through simultaneous observations of several optical chromospheric activity indicators: H, H, Na i D1, D2, He i D3, Mg i b triplet lines, and several UV chromospheric and transition region lines.
In Sect. 2 we give the details of our observations and data reduction. In Sect. 3 we describe the different aspects of the flare deduced from our echelle spectra, such as the continuum enhancement, the response of chromospheric lines to the flare, the variation of other photospheric lines, the energy released of various emission features as a function of time during the flare, and the line asymmetries. Finally, Sect. 4 gives the conclusions.
| UT | JD | S/N | Description | |
|---|---|---|---|---|
| (h:m:s) | (2449343.0+) | |||
| 01:14:26 | 0.55 | 0.444 | 52 | Quiescent |
| 02:41:52 | 0.61 | 0.482 | 108 | Quiescent |
| 04:35:48 | 0.69 | 0.532 | 145 | Impulsive |
| 05:31:18 | 0.73 | 0.557 | 118 | Flare maximum |
| 06:00:43 | 0.75 | 0.569 | 125 | Gradual |
| 06:07:52 | 0.76 | 0.573 | 134 | ” |
| 06:14:20 | 0.76 | 0.576 | 132 | ” |
| 06:21:04 | 0.76 | 0.578 | 129 | ” |
| 06:29:06 | 0.77 | 0.582 | 123 | ” |
| 06:35:06 | 0.77 | 0.585 | 124 | ” |
| 06:41:03 | 0.78 | 0.587 | 129 | ” |
| 06:47:01 | 0.78 | 0.590 | 130 | ” |
| 06:53:01 | 0.79 | 0.592 | 122 | ” |
| 06:59:08 | 0.79 | 0.595 | 123 | ” |
| 07:05:06 | 0.80 | 0.598 | 122 | ” |
| 07:11:04 | 0.80 | 0.600 | 128 | ” |
| 07:17:08 | 0.80 | 0.603 | 128 | ” |
| 07:23:07 | 0.81 | 0.605 | 124 | ” |
| 07:29:05 | 0.81 | 0.608 | 129 | ” |
| Obs. | 4866 | 5175 | 5868 | 6540 |
|---|---|---|---|---|
| (UT) | (%) | (%) | (%) | (%) |
| 02:421 | - | - | - | - |
| 04:36 | 34 | 32 | 26 | 23 |
| 05:312 | 10 | 8 | 7 | 8 |
| 06:01 | 5 | 5 | 4 | 6 |
| 06:29 | 6 | 7 | 5 | 4 |
| 07:29 | 9 | 9 | 7 | 2 |
| ∗ near H, Mg i b, He i D3, and H, respectively | ||||
| 1Quiescent spectrum; 2Flare maximum | ||||
2 Observations and Data Reduction
Echelle spectroscopic observations of LQ Hya were obtained with the 4.2m William Herschel Telescope (WHT) and the Utrecht Echelle Spectrograph (UES) on 1993 December 22, covering several optical chromospheric activity indicators. These WHT/UES spectra were obtained with echelle 31 (31.6 grooves per mm) and a 1024 x 1024 pixel TEK2 CCD as detector. The central wavelength is 5808 Å covering a wavelength range from 4842 to 7725 Å in a total of 44 echelle orders. The reciprocal dispersion ranged from 0.048 to 0.076 Å/pixel. In Table 1 we give the observing log. For each echelle spectrum we list the universal time (UT), the Julian Date (JD), the rotational phase (), and signal to noise ratio (S/N) obtained in the H line region. The rotational phase () was calculated with the ephemeris recently given by Strassmeier et al. (1997) (T0 = 2445275.0, Pphtm = 1.600881), for alternative period determinations see also Strassmeier et al. (1993) and Jetsu (1993).
The spectra have been extracted using the standard IRAF reduction procedures 111IRAF is distributed by the National Optical Observatory, which is operated by the Association of Universities for Research in Astronomy, Inc., under contract with the NSF. (bias subtraction, flat-field division, and optimal extraction of the spectra). The wavelength calibration was obtained using spectra of Th-Ar lamp. Finally, the spectra were normalized by a polynomial fit to the observed continuum.
Frequent IUE SWP and LWP spectra of LQ Hya were taken between 15 and 24 Dec 1993. The data were reduced with standard IUE software and fluxes above background determined by simple integration (Table 9). Here we analyze the NEWSIPS calibrated data, resulting in some small changes in the measured fluxes relative to our initial results (Montes et al. 1998b).
3 Description of the Flare
We detected a strong flare during the echelle observations of LQ Hya on 1993 December 22. The temporal evolution of the flare consists of an initial impulsive phase which started between 2:42 UT (last quiescent optical spectrum) and 4:07 UT (end of the first IUE exposure with enhanced emission). By the next optical spectrum (4:36 UT) strong increases in the chromospheric lines and continuum are seen. The optical chromospheric lines reached maximum intensity at 5:31 UT, by which time the continuum enhancement had already strongly decreased. After this, the lines slowly decreased in a gradual phase that lasted at least until the end of the observation (07:29 UT), i.e., 2 hours.
In the following we describe in detail the various aspects of the flare deduced from our spectra, first exploring the time variation of the continuum, and then the response of the lines. Line emission is seen both in the “typical” chromospheric diagnostics (H i Balmer, and He i D3) and, after the subtraction of the quiescent spectrum, also in other He i lines (4921.9, 5015.7, and 6678.2 Å) and other strong lines such as the Na i D1 and D2, the Mg i b triplet and several Fe i and Fe ii lines. Finally, we calculate the energy release during the flare and we analyse the broad component and the asymmetry exhibited by some of the emission lines.
3.1 The variation of the continuum
Our echelle spectra show a change in depth of all the photospheric lines due to continuum enhancement during the flare. We have determined the contribution of the flare to the total observed continuum by calculating what fraction of a linear continuum must be added to the quiescent spectrum in order to reproduce the corresponding flare spectrum. In Table 2 we give this contribution in representative spectral orders for several spectra during the flare. The maximum contribution of the flare to the continuum is reached at the beginning of the event (the impulsive phase) and decreases thereafter. It clearly depends on wavelength: in the H line region the maximum contribution is 34 %, in the He i D3 line region is 26 %, and in the H line region is 23 %, giving a power law index and an approximate blackbody temperature of 7500 K.
The continuum behaviour is thus in agreement with photometry of other stellar flares, showing that the flare is initially dominated by strong continuum radiation, strongest at short wavelengths. The temperature indicated suggests that the plasma has already cooled somewhat and thus our “impulsive” spectrum (4:36 UT) may come somewhat late in the impulsive phase.
3.2 The response of the optical Chromospheric lines to the flare
To analyse the behavior of the various optical chromospheric lines during the flare, we first subtracted the quiescent spectrum (UT:02:42), as is normally done in the analysis of flare stars. However, since the star is active, this procedure underestimates the total chromospheric contribution in these features, and ignores any variation (due to e.g., rotational modulation or evolution) of the “quiescent” state. To obtain total chromospheric contribution, we applied the spectral subtraction technique (i.e., subtraction of the rotationally broadened, radial-velocity shifted spectrum of a inactive star chosen to match the spectral type and luminosity class of LQ Hya; see Montes et al. 1995a, b, c). We used HD 10476 (K1V) as the inactive reference star, taken from the spectral library of Montes & Martín (1998).
In the case of the H and H lines we have computed, for all the flare spectra, both the observed - quiescent (O-Q) and observed - reference (O-R) profiles (see Figures 1 and 2). For the rest of the lines, not affected by chromospheric activity in the quiescent spectrum, we studied only the (O-Q) spectra (see Figures 3, 4, 5, 6). In all cases, before the standard spectrum (quiescent or reference) is subtracted we take into account the contribution of the flare to the continuum (§3.1) in each spectral region, for each flare spectrum.
3.2.1 The H line
In Fig. 1 we have plotted the quiescent spectrum, the reference star spectrum, and representative spectra during the development of the flare in the the H region. In the left panel we plot the observed spectra, in the central panel the (O-Q) profiles, and in the right panel the (O-R) profiles. This figure clearly shows the conspicuous H emission enhancement, from a weak emission above the continuum (quiescent spectrum), to a very strong and broad emission at the maximum of the flare. The excess H emission equivalent width in the (O-R) spectra, increases by a factor of 2.7 in an interval of 2.8 hours. After the maximum the emission decreases slowly; if modeled with an exponential decay EW exp(), the e-folding time 2.5 hours in the first hour, slowing even further to 11 hours in the second hour.
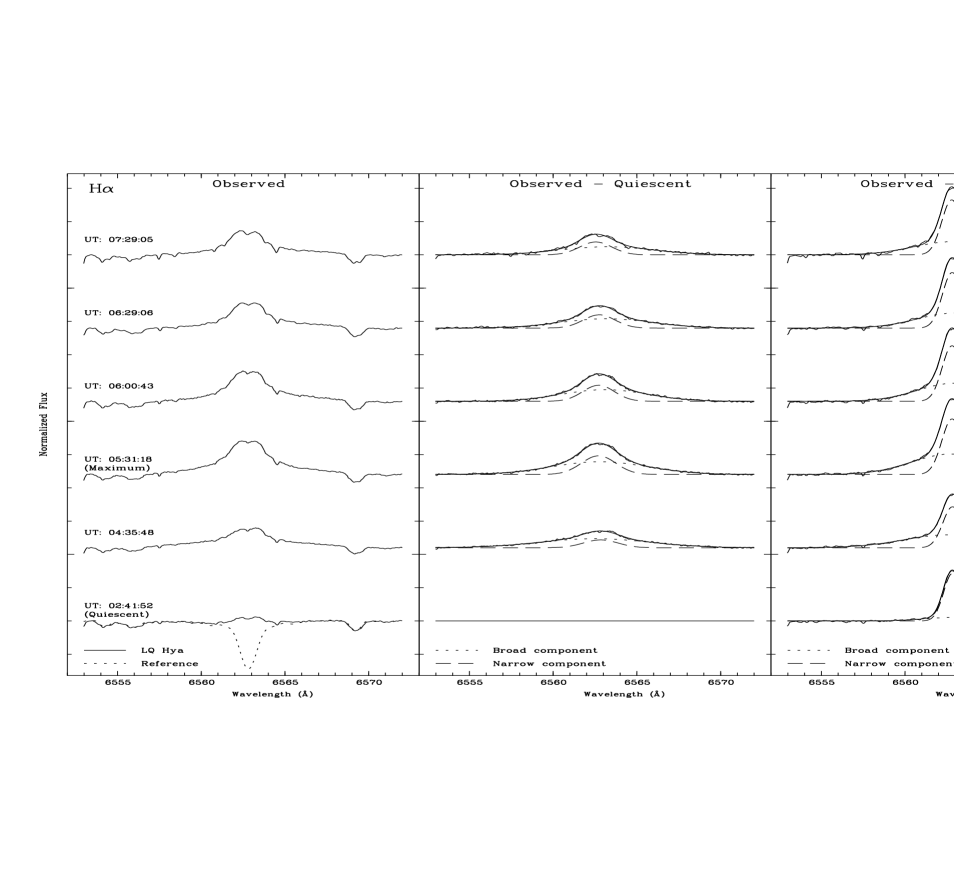
One significant aspect of these spectra is a broad emission component in the both the (O-Q) and (O-R) profiles which makes the total emission poorly matched by a single-Gaussian fit. To study these profiles, we have therefore fitted them using two Gaussian components: a narrow component (N) having a FWHM of 56-69 km s-1 and a broad component (B) with 190 FWHM 293 km s-1. In Table 3 we list the parameters (I, FWHM, EW) of the broad and narrow components. As can be seen in this table, the contribution of the B component to the total EW and FWHM of the line is a maximum in the impulsive phase. The line profiles are also asymmetric, and the two Gaussian fit is optimized when the broad component is blue- or red-shifted with respect to the narrow component (see the = N - B value in Table 3). We discuss this further in §3.5.
In Table 3 we also give, for the total subtracted spectra, the peak emission intensity (I), the excess H emission equivalent width (EW(H)), and absolute fluxes at the stellar surface, logFS(H), in erg cm-2 s-1 obtained with the calibration of Hall (1996). The time evolution of the EW( H) during the flare is shown in Fig. 9.
| H broad component | H narrow component | ||||||||||||
| Obs. | I | FWHM | EWB | B/T | I | FWHM | EWN | N/T | IT | EWT | |||
| (UT) | (Å) | (Å) | (%) | (Å) | (Å) | (%) | (N - B) | (Å) | |||||
| Obs. - Quiescent | |||||||||||||
| 02:42 (Quiescent) | - | - | - | - | - | - | - | - | - | 0.000 | 0.000 | 0.00 | |
| 04:36 | 0.137 | 7.709 | 1.098 | 78.4 | 0.117 | 2.414 | 0.304 | 45.2 | +0.34 | 0.254 | 1.401 | 6.70 | |
| 05:31 (Maximum) | 0.192 | 6.766 | 1.371 | 65.4 | 0.281 | 2.427 | 0.725 | 34.6 | -0.06 | 0.471 | 2.096 | 6.88 | |
| 06:01 | 0.174 | 6.021 | 1.113 | 66.1 | 0.240 | 2.227 | 0.570 | 33.9 | -0.36 | 0.417 | 1.683 | 6.78 | |
| 06:29 | 0.140 | 6.414 | 0.948 | 66.7 | 0.199 | 2.238 | 0.473 | 33.3 | -0.42 | 0.331 | 1.421 | 6.71 | |
| 07:29 | 0.121 | 6.567 | 0.837 | 64.3 | 0.193 | 2.267 | 0.465 | 35.7 | -0.66 | 0.315 | 1.302 | 6.67 | |
| Obs. - Reference | |||||||||||||
| 02:42 (Quiescent) | 0.053 | 4.168 | 0.236 | 20.3 | 0.714 | 1.221 | 0.927 | 79.7 | -0.12 | 0.753 | 1.163 | 6.62 | |
| 04:36 | 0.194 | 6.414 | 1.316 | 59.4 | 0.615 | 1.371 | 0.898 | 40.6 | +0.21 | 0.802 | 2.214 | 6.90 | |
| 05:31 (Maximum) | 0.307 | 5.532 | 1.809 | 58.5 | 0.835 | 1.442 | 1.281 | 41.5 | +0.07 | 1.132 | 3.090 | 7.04 | |
| 06:01 | 0.270 | 5.153 | 1.481 | 54.4 | 0.834 | 1.397 | 1.240 | 45.6 | -0.11 | 1.085 | 2.721 | 6.99 | |
| 06:29 | 0.226 | 5.326 | 1.280 | 51.2 | 0.835 | 1.221 | 1.221 | 48.8 | -0.17 | 1.043 | 2.501 | 6.95 | |
| 07:29 | 0.201 | 5.449 | 1.167 | 48.6 | 0.822 | 1.397 | 1.233 | 51.4 | -0.09 | 1.006 | 2.400 | 6.93 | |
| H broad component | H narrow component | ||||||||||||
| Obs. | I | FWHM | EWB | B/T | I | FWHM | EWN | N/T | IT | EWT | H/H | ||
| (UT) | (Å) | (Å) | (%) | (Å) | (Å) | (%) | (N - B) | (Å) | |||||
| Obs. - Quiescent | |||||||||||||
| 02:42 (Quiescent) | - | - | - | - | - | - | - | - | - | 0.000 | 0.000 | 0.00 | |
| 04:36 | 0.208 | 5.185 | 1.142 | 86.3 | 0.117 | 1.450 | 0.181 | 13.7 | +0.03 | 0.326 | 1.323 | 1.143 | |
| 05:31 (Maximum) | 0.279 | 4.440 | 1.142 | 69.7 | 0.357 | 1.507 | 0.572 | 30.3 | -0.08 | 0.644 | 1.888 | 1.498 | |
| 06:01 | 0.203 | 4.429 | 0.957 | 65.5 | 0.328 | 1.439 | 0.503 | 34.5 | -0.15 | 0.532 | 1.450 | 1.253 | |
| 06:29 | 0.178 | 4.599 | 0.870 | 70.7 | 0.248 | 1.361 | 0.359 | 29.3 | -0.20 | 0.429 | 1.230 | 1.246 | |
| 07:29 | 0.158 | 4.569 | 0.767 | 73.9 | 0.178 | 1.428 | 0.271 | 26.1 | -0.30 | 0.366 | 1.038 | 1.353 | |
| Obs. - Reference | |||||||||||||
| 02:42 (Quiescent) | - | - | - | - | - | - | - | - | - | 0.437 | 0.398 | 3.152 | |
| 04:36 | 0.232 | 5.102 | 1.253 | 76.5 | 0.359 | 1.004 | 0.384 | 23.5 | -0.09 | 0.610 | 1.636 | 1.460 | |
| 05:31 (Maximum) | 0.327 | 4.308 | 1.501 | 65.5 | 0.663 | 1.118 | 0.789 | 34.5 | -0.13 | 1.003 | 2.290 | 1.455 | |
| 06:01 | 0.250 | 4.343 | 1.156 | 60.4 | 0.661 | 1.076 | 0.757 | 39.6 | -0.23 | 0.920 | 1.913 | 1.534 | |
| 06:29 | 0.211 | 4.627 | 1.036 | 61.4 | 0.594 | 1.028 | 0.650 | 38.6 | -0.30 | 0.814 | 1.686 | 1.600 | |
| 07:29 | 0.191 | 4.713 | 0.955 | 63.5 | 0.514 | 1.000 | 0.548 | 36.5 | -0.28 | 0.718 | 1.503 | 1.723 | |
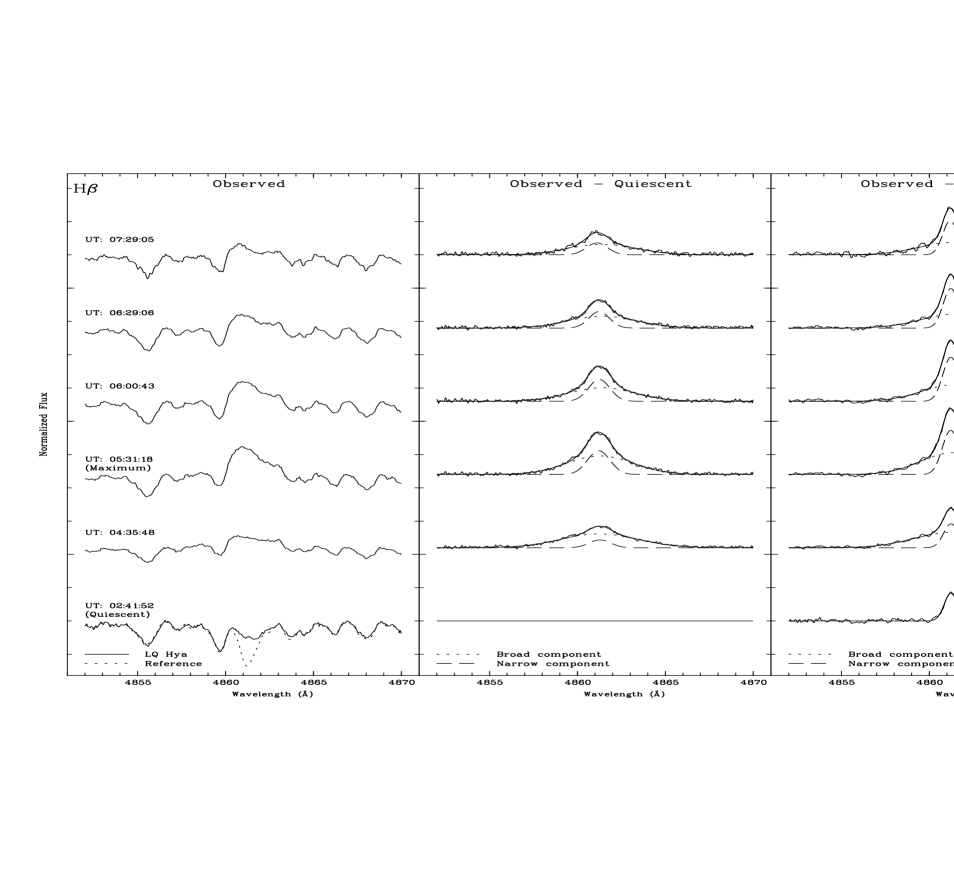
3.2.2 The H line
Fig. 2 is as Fig. 1 for the H line. In this case the line changes from mostly filled-in absorption (quiescent), to a strong and broad emission line at flare maximum. The excess H emission EW in (O-R) spectra increases by a factor of 5.8 from the quiescent level to the maximum, a considerably larger enhancement than in the H line. However, during the gradual phase the emission declines slightly more rapidly than the H emission (see Fig. 9), with hours in the first hour of decay, slowing to hours in the second. The more rapid decay of H has also been observed in other solar and stellar flares (Johns-Krull et al. 1997).
Like H, very broad wings are visible in the (O-R) H profiles, and the results of double Gaussian fits are given in Table 4. The contribution and FWHM of the broad component again reach a maximum in the impulsive phase and the profiles show an asymmetry similar to that seen in H.
3.2.3 The H/H Balmer decrement
The Balmer decrement can be an important indication of physical parameters such as electron density (Kunkel 1970). It is commonly tabulated for stellar flares with respect to the H line (Hawley & Pettersen 1991). Lacking H data in our spectra, we have instead calculated the Balmer decrement from the EW(H)/EW(H) ratio, assuming that the LQ Hya continua at H and H have a ratio appropriate to a blackbody at Teff = 4900 K (Fλ6563/Fλ4861 = 1.08). The values obtained are given in Table 4.
We found that the H/H Balmer decrement is shallower during the flare, changing from 3.15 at the quiescent state to 1.46 at the impulsive and maximum phases of the flare, indicating (unsurprisingly) a significant change in the properties of hydrogen emitting regions during the flare. In all the flares on dMe stars tabulated by Hawley & Pettersen (1991), the decrement for H and higher Balmer lines was also shallower during the flare. The H/H ratio can fall to during large stellar flares (Kunkel 1970) and in the largest solar flares (Zirin & Ferland 1980). However, in other stellar flares steeper decrements (2.0) are reported (Worden et al. 1984) and in the solar flares observed by Johns-Krull et al. (1997) this ratio only changed from 2.5 to 1.45.
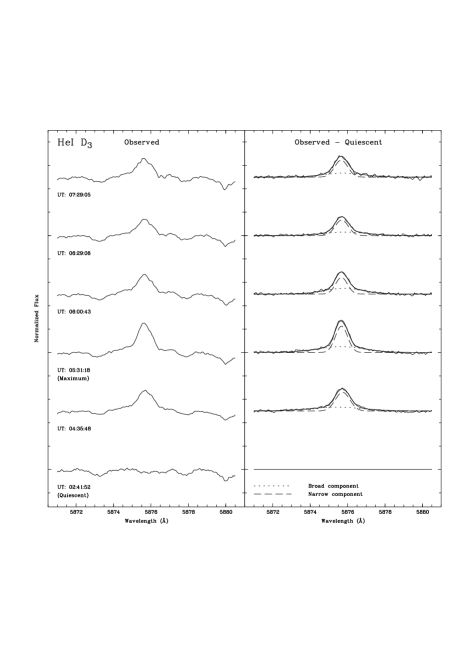
3.2.4 The He i D3 and other He i lines
In Fig. 3 we show the quiescent spectrum and representative flare spectra in the the He i D3 region; the left panel displays the observed spectra and in the right panel, the (O-Q) profiles are plotted. The He i D3 line, completely filled-in in quiescence, goes into emission during the flare, reaching a maximum intensity (0.346) at the same time that the Balmer lines. The subtracted profiles again show broad wings; an analysis like that used with H and H yields the parameters in Table 5.
This line is a well known diagnostic of flares in the Sun and in other stars. In the Sun the D3 line appears as absorption in plage and weak flares and as emission in strong flares (Zirin 1988). The He i D3 feature is typically in emission in dMe stars (e.g., Pettersen, Evans & Coleman 1984); in flare like events in UV Ceti flare stars (Kunkel 1970; Bopp & Moffett 1973); in strong flares in more luminous, active stars such as the RS CVn systems II Peg (Huenemoerder & Ramsey 1987; Montes et al. 1997; Berdyugina, Ilyin & Tuominen 1998) and UX Ari (Montes et al. 1996b; 1997), the weak-lined T Tauri star V410 Tau (Welty & Ramsey 1998), and in the active G5V Cet (Robinson & Bopp 1987). Thus, the detection of prominent D3 emission indicates that we are observing a very strong flare in LQ Hya.
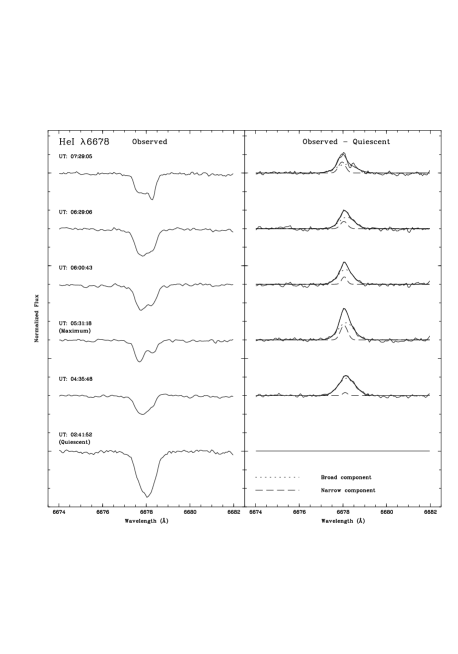
Other He i lines have been also reported in stellar flares (Bopp & Moffett 1973; Hawley & Pettersen (1991); Abdul-Aziz et al. 1995; Abranin et al. 1998). In our spectra, after the subtraction of the quiescent spectra, we have also found an excess emission in other He i lines at 4921.93, 5015.68 and 6678.15 Å. In particular, He i 6678.15 appears superimposed on the Fe i 6677.99 absorption line and the excess emission can be seen even in the observed spectra (see Fig. 4 left panel). When the quiescent spectra is subtracted, excess He i emission is clearly seen (see Fig. 4 right panel), with a maximum peak intensity of 0.17. The profiles have been again fitted with two Gaussians; the corresponding parameters are given in Table 6. The temporal evolution of this He i line during the flare is similar to the D3 line.
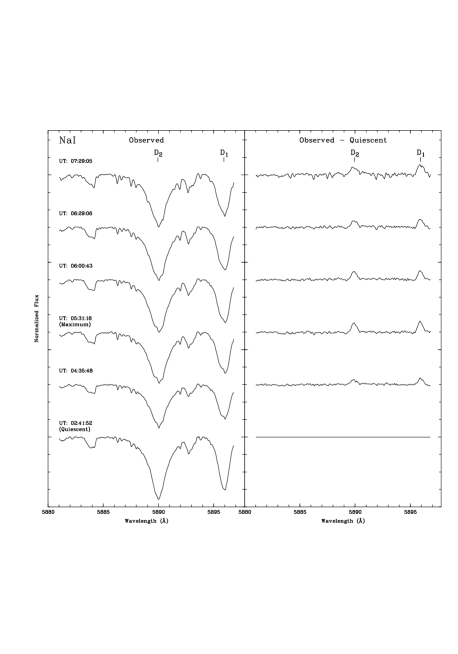
3.2.5 The Na i D1 and D2 lines
The Na i D1 and D2 resonance lines at 5895.9 Å and 5890.0 Å are collisionally-controlled in the atmospheres of late-type stars and thus provide information about chromospheric activity (see Montes et al. 1996b, 1997, 1998a). Recent models of these lines for M dwarfs have been made by Andretta, Doyle, & Byrne (1997). Using model solar flares, Falchi, Falciani & Smaldone (1990) found that the Na i D2 line shows modifications only in the core of its profile.
Subtraction of the modified reference star from the quiescent spectrum reveals that excess emission in the Na i D1 and D2 lines is very small; we have therefore analysed only the (O-Q) spectra to study the flare in these lines. As can be seen in Fig. 5, the lines show a clear filling-in of the core its profile, reaching its maximum intensity (0.13) at the same time as the other chromospheric lines. The peak intensity (I), FWHM, and EW for both lines are given in Table 7.
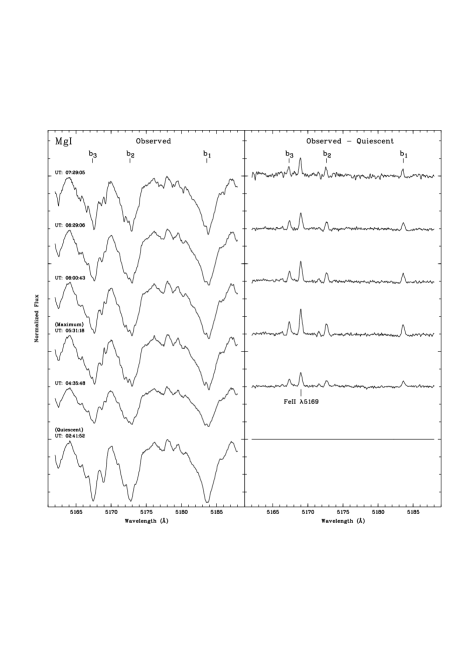
3.2.6 The Mg i b triplet lines
The strong Mg i b triplet 5167, 5172, 5183 is formed in the lower chromosphere and the region of temperature minimum and they are good diagnostics of activity (Basri, Wilcots & Stout 1989; Gunn & Doyle 1997; Gunn, Doyle & Houdebine 1997). In some stellar flares this lines exhibit a central reversal (Bopp & Moffett 1973; Mochnacki & Schommer 1979; Abdul-Aziz et al. 1995; Abranin et al. (1998). In the quiescent spectrum very strong absorption lines are observed, without evidence of filling-in by activity. In the flare spectra, however, a small reversal is observed in line cores (Fig. 6 left panel). After the subtraction of the quiescent spectra, excess emission is clearly visible, both in the three Mg i b lines (Fig. 6 right panel), and (even more intensely) in the Fe ii feature at 5169.0 Å. The measured parameters for these lines are given in Table 8.
3.2.7 The variation of other photospheric lines
The upper photosphere of the late-type stars is also affected by the chromospheric activity, as seen in the filling-in of strong photospheric lines with relatively low excitation potentials in active dwarfs (Basri et al. 1989) and pre-main sequence stars (Finkenzeller & Basri 1987). During moderately strong solar flares a large number of photospheric lines are filled-in when the quiescent spectrum is subtracted (Acampa et al. 1982; Mauas 1990; Johns-Krull et al. 1997). Filling-in of some metal lines are also reported in earlier observations of flares of the UV Cet-type stars by Mochnacki & Schommer (1979; and references therein), Hawley & Pettersen (1991), and in recently observations by Abdul-Aziz et al. (1995) and Abranin et al. (1998).
We have observed a slight filling in of many photospheric absorption lines in our spectra during the flare. These include all the lines reported to be activity-sensitive by Basri et al. (1989) and Finkenzeller & Basri (1987), many of the lines appearing in the high resolution spectra of a moderate solar flare (Johns-Krull et al. 1997), all the lines identified in the spectra of a more energetic solar flare (Acampa et al. 1982), and some of the lines reported in stellar flares (Mochnacki & Schommer 1979; Abdul-Aziz et al. 1995; Abranin et al. (1998). The lines with the largest filling in are those of multiplet 42 of Fe ii (4943.9, 5018.4, 5169.0 Å). Other lines with significant filling are the lines of multiplet 48 (5316.8, 5362.9 Å) and 49 (5197.6, 5234.6, 5276.0, 5316.6 Å) of Fe ii.
| He i D3 broad component | He i D3 narrow component | |||||||||||
| Obs. | I | FWHM | EWB | B/T | I | FWHM | EWN | N/T | IT | EWT | ||
| (UT) | (Å) | (Å) | (%) | (Å) | (Å) | (%) | (N - B) | (Å) | ||||
| 02:42 (Quiescent) | - | - | - | - | - | - | - | - | - | 0.000 | 0.000 | |
| 04:36 | 0.033 | 3.400 | 0.117 | 43.0 | 0.160 | 0.912 | 0.155 | 57.0 | +0.32 | 0.198 | 0.272 | |
| 05:31 (Maximum) | 0.051 | 2.981 | 0.161 | 46.5 | 0.226 | 0.772 | 0.185 | 53.5 | +0.03 | 0.272 | 0.346 | |
| 06:01 | 0.049 | 2.450 | 0.128 | 53.3 | 0.142 | 0.745 | 0.112 | 46.7 | -0.13 | 0.190 | 0.241 | |
| 06:29 | 0.030 | 2.802 | 0.088 | 43.1 | 0.133 | 0.825 | 0.117 | 56.9 | -0.21 | 0.161 | 0.205 | |
| 07:29 | 0.034 | 2.554 | 0.093 | 42.0 | 0.145 | 0.826 | 0.128 | 58.0 | -0.11 | 0.184 | 0.220 | |
| He i 6678 broad component | He i 6678 narrow component | |||||||||||
| Obs. | I | FWHM | EWB | B/T | I | FWHM | EWN | N/T | IT | EWT | ||
| (UT) | (Å) | (Å) | (%) | (Å) | (Å) | (%) | (N - B) | (Å) | ||||
| 02:42 (Quiescent) | - | - | - | - | - | - | - | - | - | 0.000 | 0.000 | |
| 04:36 | 0.094 | 0.911 | 0.091 | 95.4 | 0.017 | 0.249 | 0.004 | 04.6 | -0.08 | 0.106 | 0.095 | |
| 05:31 (Maximum) | 0.093 | 0.857 | 0.085 | 72.4 | 0.079 | 0.384 | 0.032 | 27.6 | -0.09 | 0.171 | 0.117 | |
| 06:01 | 0.080 | 0.797 | 0.067 | 84.5 | 0.041 | 0.285 | 0.012 | 15.5 | -0.08 | 0.120 | 0.080 | |
| 06:29 | 0.062 | 0.833 | 0.055 | 78.3 | 0.040 | 0.360 | 0.015 | 21.7 | -0.13 | 0.101 | 0.070 | |
| 07:29 | 0.047 | 1.060 | 0.053 | 68.6 | 0.060 | 0.381 | 0.024 | 31.4 | -0.18 | 0.111 | 0.078 | |
| Na i D2 | Na i D1 | ||||||
| Obs. | I | FWHM | EW | I | FWHM | EW | |
| (UT) | (Å) | (Å) | (Å) | (Å) | |||
| 02:421 | 0.000 | 0.000 | 0.000 | 0.000 | 0.000 | 0.000 | |
| 04:36 | 0.058 | 0.674 | 0.036 | 0.078 | 0.549 | 0.038 | |
| 05:312 | 0.106 | 0.584 | 0.059 | 0.127 | 0.487 | 0.065 | |
| 06:01 | 0.095 | 0.600 | 0.057 | 0.104 | 0.528 | 0.056 | |
| 06:29 | 0.074 | 0.718 | 0.048 | 0.092 | 0.657 | 0.052 | |
| 07:29 | 0.090 | 0.915 | 0.063 | 0.117 | 0.666 | 0.074 | |
| 1Quiescent spectrum; 2Flare maximum | |||||||
| Mg i b3 | Mg i b2 | Mg i b1 | Fe ii 5169 | ||||||||||||
| Obs. | I | FWHM | EW | I | FWHM | EW | I | FWHM | EW | I | FWHM | EW | |||
| (UT) | (Å) | (Å) | (Å) | (Å) | (Å) | (Å) | (Å) | (Å) | |||||||
| 02:421 | 0.000 | 0.000 | 0.000 | 0.000 | 0.000 | 0.000 | 0.000 | 0.000 | 0.000 | 0.000 | 0.000 | 0.000 | |||
| 04:36 | 0.078 | 0.531 | 0.044 | 0.069 | 0.503 | 0.037 | 0.060 | 0.467 | 0.030 | 0.154 | 0.458 | 0.075 | |||
| 05:312 | 0.137 | 0.392 | 0.057 | 0.122 | 0.379 | 0.049 | 0.111 | 0.350 | 0.041 | 0.275 | 0.401 | 0.118 | |||
| 06:01 | 0.111 | 0.425 | 0.050 | 0.102 | 0.381 | 0.042 | 0.089 | 0.359 | 0.034 | 0.222 | 0.402 | 0.095 | |||
| 06:29 | 0.093 | 0.342 | 0.034 | 0.082 | 0.349 | 0.030 | 0.069 | 0.337 | 0.025 | 0.177 | 0.416 | 0.078 | |||
| 07:29 | 0.103 | 0.414 | 0.045 | 0.100 | 0.318 | 0.034 | 0.082 | 0.265 | 0.023 | 0.204 | 0.387 | 0.084 | |||
| 1Quiescent spectrum; 2Flare maximum | |||||||||||||||
3.3 The flare in the UV
Ultraviolet line and continuum fluxes are given in (Table 9). We coadd selected strong chromospheric (CHR) and transition region (TR) line fluxes to improve statistics: is the sum of N v ( K), Si iv ( K) and C iv ( K), while coadds O i and C i ( K), C ii ( K), and Si ii ( K). Figure 7 shows the quiescent (an average of 10 exposures), impulsive (JDstart = 2449343.568; 1:37 UT), and just post-maximum (= “UV peak”; JDstart = 2449343.783; 6:48 UT) UV spectra. Figure 8 depicts Mg ii spectra between the SWP data in Figure 7, plus an average quiescent spectrum. Figure 10 shows the time variation of and during the period of the optical flare. We note that while the UV “impulsive” spectrum ends before the first flare-affected optical spectrum (4:36 UT), it already shows noticeably enhanced (1.5quiescent) transition region (TR) and continuum emission. Thus the true “impulsive” phase starts earlier than the optical data indicates, with high TR lines leading the evolution (as is typical).


Besides the lines measured in Table 9, numerous weak lines are also present (typically in UV peak and/or quiescent spectra). Most certain of these are C i 1261, 1277, 1280, 1560 Å, Si iii 1295-98, 1892 Å, S i 1820 Å, Al iii 1855, 1863 Å, Fe ii 1611, 1633, 1671 Å, and O iii 1666 Å. The following are also detected with less certainty: C i 1463, 1493 Å, S i 1473, 1483, 1487, 1900 Å, Si i 1258, 1267, 1565, 1574 Å, Si ii 1533Å, Fe ii 1372, 1588, 1598 Å, S iv 1417 Å, O iv 1407 Å, O v 1371 Å, and S v 1502 Å. Also of interest is the possible detection of the coronal 1354.1 Å Fe xxi line ( K) in the UV peak and (perhaps) in the quiescent spectrum. Possible contributions from other nearby lines (e.g., C i 1354.3 Å) make this identification uncertain, though.
The strongest high line, C iv, shows a strong blueward asymmetry in the impulsive spectrum (its centroid is shifted by km s-1), perhaps foreshadowing the blueshifts in the broad components of the optical Balmer and He i lines seen later (see §3.5). Si IV and N V (with similar ) also appear to be blue-shifted, though the shift is uncertain due to probable blends and the weakness these features. Cooler strong lines (C II, He II) show no shift. The lack of H2 rules out the 1547 Å line as responsible, but we note that numerous features near C IV are coincident with (normally weak) Si I (1545, 1552, 1555-8, 1563 Å), and C I (1542 Å) lines. Thus, the apparent C IV blueshift may be partly due to blends.
There are no SWP data during optical flare maximum, though two LWP spectra appear to show Mg ii peaking at about the this time (Fig. 8). The presence of ISM absorption, emission self-reversal, and nearby blends complicates the interpretation of these features. We first constructed a “quiescent” spectrum from the average of eight LWP images which appeared uncontaminated by flares. We then removed the ISM absorption from by adding a 2 pixel Gaussian at the center of the absorption feature. We modeled the Mg ii lines in the flare very simply, with , where is the ISM-corrected quiescent spectrum, and are broad and narrow (2 pixel) Gaussians, and , , , and are adjustable constants. The width and central of and were also allowed to vary; results are shown in Fig. 8. The advantage of using as a template is that we account for the intrinsic Mg ii shape and (partially) remove blends.
We find that the first Mg ii spectrum shows a 2.5 enhancement over quiescent in its narrow component, and a broad (250 km s-1 FWHM) component with a flux of ergs cm-2 s-1 at earth in Mg ii k. The broad component in this spectrum is Doppler shifted by km s-1. The continuum is also significantly enhanced (by at least 10), with ergs cm-2 s-1 Å-1 at 2800 Å. The second spectrum, taken about 1.5 hours later, showed both broad and narrow components reduced by a factor of , with the broad component now basically unshifted but with a similar width (Fig. 8). Thus, the Mg ii lines respond to the flare much like the optical chromospheric features, initially exhibiting enhanced emission with broad, blue-shifted components, which gradually drift to the red and weaken as the flare evolves.
The next SWP spectrum (UV peak, coinciding the with early gradual phase in the optical data) reveals enhancements in the TR and enhancements in the CHR. Several high lines only weakly detected in the quiescent spectrum (C iii 1175 Å, N v 1240 Å) are also greatly strengthened. Several lines not listed in Table 9 appear in this spectrum; the more certain of these include the C i complexes (1261 Å, 1277 Å, and 1280 Å) and the Si iii complex at 1295-1299 Å, (combined fluxes 1.3 and ergs cm-2 s-1), O iii 1666 Å, Fe ii 1671 Å, Al iii 1854+1862 Å, and Si iii 1892 Å (with , , and ergs cm-2 s-1, respectively).

The UV continuum is also noticably enhanced in this spectrum. Machado & Hénoux (1982) suggested similar enhancements in solar flares at 1524 Å and 1682 Åare due to are due bound-free radiation from the ground and first excited levels of Si i excited by UV line emission (primarily by C ii and C iv, respectively). Exploring this idea, Phillips, Bromage & Doyle (1992) studied the power per Å in 50 Å (relatively line free) bands centered at 1490 Å and 1595 Å in stellar flares, and found that they correlated well with line power in C ii and C iv, respectively: specifically, (1490Å) = 0.94 and (1595Å) = 1.04 . We have integrated the flux in similar bands ( in Table 9); note that the small in the non-flare spectra may be due to the sum of many weak lines. We find good agreement for the 1490 Å continuum, with (1490 Å) (= Å , where is the stellar distance) within an average 0.10 dex of the prediction for the impulsive and UV max spectra. Agreement is less good for (1595 Å), which is overestimated by an average of 0.31 dex. We see no Si i edges at 1524 Å or 1682 Å, but this is perhaps not surprising given the low resolution of IUE (Phillips et al. 1992). In general, though, the far UV flare continuum of LQ Hya seems consistent with the Si i recombination model.
If LQ Hya were very young and still had significant circumstellar material, one might expect X-ray excitation of the gas in such a strong flare. On the suggestion of the referee, we explored whether any of the weak features in the impulsive or UV peak spectrum might be due to excitation of circumstellar H2. As there is no evidence in these spectra for the four strongest H2 features seen in T Tau (1446, 1490, 1505, 1562 Å; Brown, de M. Ferraz & Jordan 1984), it seems unlikely there is much nearby gas. This makes it less likely that LQ Hya is pre-main sequence, as suggested by Vilhu et al. (1991).
The UV fluxes do not return to their quiescent level until almost a day later (JD 2449344.744), though lack of data for 0.8 day after the UV maximum makes the interpretation ambiguous. The time between UV maximum and quiescence covers over half a rotation, making it difficult for the flare (if localised) to have remained visible unless it was very near the pole, or in a very extended () loop. The sharp drop in flux from 344.589 to 344.744 could then be due in part to the flare’s finally disappearing over the limb. Perhaps more likely, the enhancement seen on JD 2449344 might be due to a second flare and the fast decay a consequence of its lower energy (; Lee, Petrosian & McTiernan 1993; Saar & Bookbinder 1998).

| JDstart | texp | (10-13 ergs cm2 s-1 at earth)1 | |||||||||||||
|---|---|---|---|---|---|---|---|---|---|---|---|---|---|---|---|
| -2449000 | (s) | C iii | N v | O i | C ii | Si iv | C iv | He ii | C i | Si ii | Mg ii2 | sum | sum | (1490Å) | (1595Å) |
| 342.742 | 2400 | … | … | … | … | … | … | … | … | … | 30/32 | … | … | … | … |
| 342.7813 | 7200 | 0.8:4 | 0.2: | 0.8 | 1.6 | 1.4 | 3.3 | 2.0 | 1.1 | 1.5 | … | 5.0 | 4.8 | 0.9: | 1.6: |
| 343.5685 | 9000 | 0.4: | 0.6: | 0.9 | 1.3 | 0.8: | 5.8: | 1.2 | 1.3 | 1.2 | … | 4.7 | 7.2: | 2.4: | 2.9: |
| 343.684 | 2400 | … | … | … | … | … | … | … | … | … | 106:/120: | … | … | … | … |
| 343.750 | 2400 | … | … | … | … | … | … | … | … | … | 78/83 | … | … | … | … |
| 343.783 | 6300 | 13.7 | 5.4 | 2.8 | 8.8 | 12.2 | 50:6 | 18.3 | 4.5 | 4.1 | … | 20.2 | 68: | 14.7 | 18.0 |
| 344.589 | 9000 | 3.8: | 1.5: | 1.3: | 3.1 | 2.9 | 6.9 | 3.5 | 2.0 | 2.8 | … | 9.2 | 11.3 | 1.6: | 2.9: |
| 344.744 | 7200 | 1.0: | 0.4: | 0.4: | 1.0 | 0.5 | 2.4 | 1.7 | 1.2 | 1.1 | … | 4.9 | 4.2 | 1.6: | 1.6: |
| 344.833 | 2400 | … | … | … | … | … | … | … | … | … | 27/29 | … | … | … | … |
| quiescent | 1.2: | 0.4 | 0.7 | 1.5 | 1.1 | 3.1 | 1.7 | 1.0 | 0.9 | 29/31 | 4.1 | 4.6 | 1.5 | 1.5 | |
1 lines at 1175Å, 1239+43Å, 1302+5+6Å, 1335Å, 1394+1403Å, 1548+51Å, 1641Å, 1657Å, 1808+17Å, 2796+2803Å, respectively.
2 uncorrected/corrected for ISM absorption 3 not shown in Fig. 10. 4 colon = uncertain measurement 5 noisy spectrum
6 line saturated, ergs cm-2 s-1, flux estimated from Gaussian fit to line wings and shoulder.
3.4 Estimate of energy released
To estimate the flare energy released in the observed optical chromospheric lines, we converted the EW into absolute surface fluxes and luminosities. Since we have not observed the entire flare, and are missing important lines (e.g., the saturated Ly ; Mg ii; He i 10830 Å) our estimates are only lower limits to the total flare energy in chromospheric lines. We have used the calibration of Hall (1996) to obtain the stellar continuum flux in the H region as a function of (B - V) and then convert the EW into absolute surface flux. For the other lines, we have used the continuum flux at H corrected for the difference in the continuum Fλ6563/Fλ, assuming Fλ is given by a blackbody at Teff = 4900 K. The corresponding absolute fluxes at flare maximum (erg cm-2 s-1), and total flux (ergs cm-2) integrated over the the observation interval ( 3 h) are given in Table 10. We converted these fluxes into luminosities using the radius R = 0.76 R⊙ (Strassmeier et al. 1993). We have not estimated the energy released in the UV chromospheric lines, since, without the (saturated) Ly and Mg ii lines, the total will be greatly underestimated. We find that the estimated total energy released in optical chromospheric lines is 5.7 1033 ergs, indicating that this LQ Hya flare is more energetic in line emission than an average flare on a dMe star, where typically 1028 ergs 1034 ergs (see Hawley & Pettersen 1991).
| Line | Fλ(max) | F | Lλ(max) | L |
|---|---|---|---|---|
| (106) | (1010) | (1029) | (1033) | |
| (ergs cm-2 s-1) | (ergs cm-2) | (erg s-1) | (erg) | |
| H | 6.269 | 5.876 | 2.204 | 2.066 |
| Mg i b3 | 0.200 | 0.210 | 0.070 | 0.074 |
| Fe ii 5169 | 0.414 | 0.406 | 0.145 | 0.143 |
| Mg i b2 | 0.172 | 0.174 | 0.062 | 0.061 |
| Mg i b1 | 0.144 | 0.137 | 0.051 | 0.048 |
| He i D3 | 1.270 | 1.234 | 0.447 | 0.434 |
| Na i D2 | 0.217 | 0.253 | 0.076 | 0.089 |
| Na i D1 | 0.239 | 0.278 | 0.084 | 0.098 |
| H | 7.510 | 7.242 | 2.641 | 2.546 |
| He i 6678 | 0.415 | 0.412 | 0.146 | 0.145 |
| Total lines | 16.85 | 16.23 | 5.926 | 5.704 |
3.5 Line asymmetry
Very broad wings have been found in Mg ii and in the subtracted profiles of H, H, He i D3 and He i 6678 lines, and double Gaussian (narrow=N and broad=B) fits were used to model them. The contribution of the broad component to the total EW and FWHM of these lines reaches a maximum in the impulsive phase and then decreases. The line profiles are also asymmetric, with the B component often shifted relative to the N. In the impulsive phase we found a blue asymmetry in the lines – the B component appears blue-shifted with respect to the N. At the maximum of the flare , and during the gradual phase a red asymmetry is present, with increasing with time (see Tables 3-6).
Similar broad Balmer emission wings have been seen in dMe stars and chromospherically active binaries connected with flare events, with similar blue or red asymmetries in some cases (Eason et al. 1992; Phillips et al. 1988; Doyle et al. 1988; Gunn et al. 1994a; Abdul-Aziz et al. 1995; Montes et al. 1996b, 1997; Montes & Ramsey (1998); Abranin et al. 1998; Berdyugina et al. 1998) and without obvious line asymmetries in other cases (Hawley & Pettersen 1991). The authors ruled out the possibility of pressure (Stark) effects as the cause and conclude that the profiles are best explained if these broad components and asymmetries are attributed to plasma turbulence or mass motions in the flare. In solar flares, most frequently, a red asymmetry is observed in chromospheric lines and interpreted as the result of chromospheric downward condensations (CDC) (Canfield et al. 1990 and references therein). However, evidence of a blue asymmetry has been also reported (Heinzel et al. 1994) and blue and red asymmetries are observed simultaneously at different positions in a flaring region (Canfield et al. 1990), or at the same position but different times (Ji et al. 1994). Recent line profile calculations (Gan, Rieger & Fang 1993; Heinzel et al. 1994; Ding & Fang 1997) show that a CDC can explain both the blue and red asymmetries. On the other hand, in stellar flares evidence of mass motions have also been reported, in particular a large enhancement in the far blue wings of Balmer lines during the impulsive phase of a stellar flare was interpreted as a high velocity mass ejection (Houdebine, Foing & Rodonó 1990), or high velocity chromospheric evaporation (Gunn et al. 1994b), and red asymetries in the wings of Balmer lines are reported by Houdebine et al. (1993) as evidence of CDC. Broadening and shifts in UV lines during stellar flares, also interpreted as mass motions, have been reported by Simon, Linsky & Schiffer (1980), and Linsky et al. (1989). Thus another possible explanation of the broad components and asymmetries we observed is mass motions in the flare - perhaps an explosive ejection/eruption (blueshift) followed by flows down the flaring loops (redshift). Still, since a CDC can also explain both the blue and red asymmetries observed in this stellar flare, it remains a distinct possibility as well.
4 Conclusions
We have detected a strong flare on LQ Hya in high resolution optical spectra (4800 to 7000 Å) and IUE SWP observations. Such a strong flare is unusual in an early K star like LQ Hya. The flare started on 1993 December 22 between 2:42 UT (quiescent spectrum) and 4:07 UT (end of first enhanced UV spectrum). UV data suggest the impulsive phase began well before the first optical sign at 04:36 UT. The optical chromospheric lines reached their maximum intensity 55 min later, by which time the continuum enhancement had sharply decreased. Thereafter, the optical line emission slowly decreased in a gradual phase that lasted at least until the last observation (07:29 UT). Quiescent C iv flux levels were not recovered after 4 h UT on the following day (though a second flare or rotation of the flaring region beyond the limb may have affected the results).
We detected an optical continuum enhancement that increased toward the blue () and reached a maximum (36%) during the impulsive phase. The UV continuum was enhanced by at least at 1500 Å and 2800 Å.
We analyse the lines by subtracting a quiescent LQ Hya spectrum or that of a modified inactive reference star. The excess H and H emission equivalent widths, in the observed - reference spectra, increase by a factor of 2.7 and 5.8 at maximum, respectively, over the quiescent level. The H/H Balmer decrement is shallower during the flare, changing from 3.15 at the quiescent state to 1.46 at the impulsive and maximum phases of the flare. We observe the He i D3 line, a well known diagnostic of flares, going into emission during the flare, reaching an EW = 0.346 Å at the maximum. We also observe excess emission in He i lines at 4921.9, 5015.7, and 6678.1 Å in the (O-Q) spectra, and in other metal lines such as the Na i D1 and D2, the Mg i b triplet and several Fe i and Fe ii lines.
The more intense lines, H, H, He i D3 and He i 6678, exhibit very broad wings in the subtracted profiles. Their profile are hence not well matched with a single component model; we have used a two Gaussian fit (narrow and broad) to characterize them. For all these lines the contribution of the broad component to the total EW of the line and their FWHM reach a maximum at the impulsive phase and then decrease. Moreover, the line profiles are asymmetric, appearing the broad component blue-shifted in the impulsive phase and red-shifted during the gradual phase, with between the components increasing with time. Mg ii profiles respond similarly. These broad components and asymmetries can be attributed to plasma turbulence or to upward and downward mass motions in the flare. Similar blueshifts may be seen in the C iv line during the impulsive phase of the flare.
Ultraviolet TR lines are enhanced by a factor of , chromospheric lines by a factor of and the far UV continuum by a factor of over background in our UV spectrum just after optical flare maximum. The continuua in our flare-affected UV spectra generally agree with a Si i recombination model.
We estimate the energy released during the flare for all the optical chromospheric lines at 5.7 1033 ergs, indicating that this flare in LQ Hya is more energetic in line emission than an average flare on a dMe star.
Acknowledgments
This work has been partially supported by the Universidad Complutense de Madrid and the Spanish Dirección General de Enseñanza Superior e Investigación Científica (DGESIC) under grant PB97-0259, by NASA grants NAG5-1975 and NAGW-112, HST grant GO-5871.01-94A, and NSF grant AST-9528563. YCU is supported by the Austrian Science Foundation grant S7302. We thank the referee J.G. Doyle for helpful comments, and C.M. Johns-Krull for useful discussions.
References
- [Abdul-Aziz et al. 1995] Abdul-Aziz H., et al., 1995, A&AS, 114, 509
- [1] Abranin E.P., et al., 1998, Astron. Astrophys. Trans., (in press)
- [2] Acampa E., Falciani R., Sambuco A.M., Smaldone L.A., 1982, A&AS, 47, 485
- [3] Ambruster C., Fekel F.C., 1990, BAAS, 22, 857
- [4] Andretta V., Doyle J.G., Byrne P.B., 1997, A&A, 322, 266
- [5] Ayres T.R., Stauffer J.R., Simon T., Stern R.A., et al., 1994, ApJ, 420, L33
- [6] Basri G., Wilcots E., Stout N., 1989, PASP, 101
- [7] Berdyugina S.V., Ilyin I., Tuominen I., 1998, in: Cool Stars, Stellar Systems, and the Sun, Tenth Cambridge Workshop, J.A. Bookbinder & R.A. Donahue, eds., ASP Conf. Ser. 154, San Francisco: ASP, CD-1477
- [8] Basri G., Marcy G.W., 1994, ApJ, 431, 844
- [9] Bopp B.W., Moffett T.J., 1973, ApJ, 185, 239
- [10] Bowyer S., Lampton M., Lewis J., et al., 1996, ApJS, 102, 129
- [11] Brown A., de M. Ferraz M.C., Jordan C., 1984, MNRAS, 207, 831
- [Canfield et al. 1990] Canfield R.C., Kiplinger, A.L., Penn M.J., Wülser J.-P., 1990, ApJ, 363, 318
- [12] Catalano S., 1990, in: Active Close Binaries, C. Ibanoglu, ed., Kluwer Academic Publishers, Dordrecht, The Netherlands, p. 411
- [Ding Fang 1997] Ding M.D., Fang C., 1997, A&A, 318, L17
- [13] Donati J.-F., Semel M., Carter B.D., Rees D.E., Cameron A.C., 1997, MNRAS, 291, 658
- [14] Donati J.-F., 1988, MNRAS, (in press)
- [15] Doyle J.G., Butler C.J., Byrne P.B., van den Oord G.H.J., 1988, A&A, 193, 229
- [16] Eason E.L.E., Giampapa M.S., Radick R.R., Worden S.P., Hege E.K., 1992, AJ, 104, 1161
- [17] Falchi A., Falciani R., Smaldone L.A., 1990, A&AS, 84, 601
- [18] Fekel F.C., Bopp B.W., Africano J.L., Goodrich B.D., Palmer L.H., Quigley R., Simon T., 1986a, AJ, 92, 1150
- [19] Fekel F.C., Moffett T.J., Henry G.W., 1986b, ApJS, 60, 551
- [20] Finkenzeller U., Basri G., 1987, ApJ, 318, 823
- [Gan, Rieger, Fang 1993] Gan W.Q., Rieger E., Fang C., 1993, ApJ, 416, 886
- [21] Gunn A.G., Doyle J.G., Mathioudakis M., Avgoloupis S., 1994a, A&A, 285, 157
- [22] Gunn A.G., Doyle J.G., Mathioudakis M., Houdebine E.R., Avgoloupis S., 1994b, A&A, 285, 489
- [23] Gunn A.G., Doyle J.G., 1997, A&A, 318, 60
- [24] Gunn A.G., Doyle J.G., Houdebine E.R., 1997, A&A, 319, 211
- [25] Haisch B., Strong K.T., Rodonò M., 1991, ARA&A, 29, 275
- [26] Hall J.C., 1996, PASP, 108, 313
- [27] Hawley S.L., Pettersen B.R., 1991, ApJ, 378, 725
- [Heinzel et al. 1994] Heinzel P., Karlický M., Kotrc̣ P., Svestka Z. 1994, Solar Phys. 152, 393
- [28] Henry G.W., Newsom M.S., 1996, PASP, 108, 242
- [29] Houdebine E.R., Foing B.H., Rodonó M., 1990, A&A, 238, 249
- [30] Houdebine E.R., Foing B.H., Doyle J.G., Rodonó M., 1993, A&A, 274, 245
- [31] Huenemoerder D.P., Ramsey L.W. 1987, ApJ, 319, 392
- [32] Hünsch M., Reimers D. 1995, A&A, 296, 509
- [Ji et al. 1994] Ji G.P., Kurokawa H., Fang C., Huang Y.R., 1994, Solar Phys., 149, 195
- [33] Jetsu L., 1993, A&A, 276, 345
- [34] Johns-Krull C.M., Hawley S.L., Basri G., Valenti J.A., 1997 ApJS, 112, 221
- [35] Kunkel W.E., 1970, ApJ, 161, 503
- [36] Landini M., Monsignori Fossi B.C., Pallavicini R., Piro L., 1986, A&A, 157, 217
- [37] Lee T.T., Petrosian V., McTiernan J.M., 1993, ApJ, 412, 401
- [Linsky et al. 1989] Linsky J.L., Neff J.E., Brown A., et al., 1989, A&A, 211, 173
- [38] Machado M.E, Hénoux J.-C., 1982, A&A, 108, 61
- [39] Mirzoyan L.V., 1984, Vistas in Astronomy, 27, 77
- [Mochnacki Schommer 1979] Mochnacki S.W., Schommer R.A., 1979, ApJ, 231, L77
- [40] Montes D., Fernández-Figueroa M.J., De Castro E., Cornide M., 1995a, A&A, 294, 165
- [41] Montes D., Fernández-Figueroa M.J., De Castro E., Cornide M., 1995b, A&AS, 109, 135
- [42] Montes D., De Castro E., Fernández-Figueroa M.J., Cornide M. 1995c, A&AS, 114, 287
- [43] Montes D., Fernández-Figueroa M.J., Cornide M., De Castro E., 1996a, A&A, 312, 221
- [Montes et al. 1996b] Montes D., Sanz-Forcada J., Fernández-Figueroa M.J., Lorente R., 1996b, A&A, 310, L29
- [44] Montes D., Fernández-Figueroa M.J., De Castro E., Sanz-Forcada J., 1997, A&AS, 125, 263
- [45] Montes D., Sanz-Forcada J., Fernández-Figueroa M.J., De Castro E., Poncet A. 1998a, A&A, 330, 155
- [46] Montes D., Saar S.H., Collier Cameron A., Unruh Y.C., 1998b, in: Cool Stars, Stellar Systems, and the Sun, Tenth Cambridge Workshop, J.A. Bookbinder & R.A. Donahue, eds., ASP Conf. Ser., 154, San Francisco: ASP, CD-1508
- [47] Montes D., Martín E.L., 1998, A&AS, 128, 485
- [48] Montes D., Ramsey L.W., 1998, in: ASP Conf. Ser., Solar and Stellar Activity: Similarities and Differences, eds., C.J. Butler J.G. Doyle, (in press)
- [49] Pettersen B.R., Evans D.S., Coleman L.A., 1984, ApJ, 282, 214
- [50] Pettersen B.R., 1989, in: Solar and Stellar flares, B.M. Haisch, M. Rodonò, eds., Dordrecht Kluwer, p. 299
- [51] Phillips K.J.H., Bromage G.E., Dufton P., Keenan F., Kingston A., 1988, MNRAS, 235, 573
- [52] Phillips K.J.H., Bromage G.E., Doyle J.G., 1992, ApJ, 385, 731
- [53] Pye J.P., McGale P.A., Allan D.J., et al. 1995, MNRAS, 274, 1165
- [54] Rice J.B., Strassmeier K.G., 1998, A&A, 336, 972
- [55] Robinson C.R., & Bopp B.W., 1987 in: Fifth Cambridge workshop on cool stars, stellar systems, and the sun J.L. Linsky , R.E. Stencel, eds., Lecture notes in physics, 291, 509
- [56] Saar S.H., Nördstrom B., Andersen J., 1990, A&A, 235, 291
- [57] Saar S.H., Piskunov, N.E., Tuominen I., 1992, in: Cool Stars, Stellar Systems, and the Sun, Seventh Cambridge Workshop, M.S. Giampapa and J.A. Bookbinder, eds., ASP Conf. Ser., 26, 259
- [58] Saar S.H., Piskunov, N.E., Tuominen I., 1994, in: Cool Stars, Stellar Systems, and the Sun, Eighth Cambridge Workshop, J.P. Caillault, ed., ASP Conf. Ser., 64, 661
- [59] Saar S.H., Huovelin J., Osten R.A., Shcherbakow A.G., 1997, A&A, 326, 741
- [60] Saar S.H., J.A. Bookbinder, 1998, in: Cool Stars, Stellar Systems, and the Sun, Tenth Cambridge Workshop, J.A. Bookbinder & R.A. Donahue, eds., ASP Conf. Ser., 154, San Francisco: ASP, CD-1560
- [61] Simon T., Linsky J.L., Schiffer F.H., 1980, ApJ, 239, 911
- [62] Simon T., Fekel F.C., 1987, ApJ, 316, 434
- [63] Strassmeier K.G., Hall D.S., 1988, ApJS, 67, 453
- [64] Strassmeier K.G., Fekel F.C., Bopp B.W., Dempsey R.C., Henry G.W., 1990, ApJS, 72, 191
- [65] Strassmeier K.G., Rice J.B., Wehlau W.H., Hill G.M., Matthews J.M., 1993, A&A, 268, 671
- [66] Strassmeier K.G., Bartus J., Cutispoto G., Rodonò M., 1997, A&AS 125, 11
- [67] Vilhu O., Gustafsson B., Walter F.M., 1991, A&A, 241, 167
- [68] Welty A.D., Ramsey L.W. 1998, AJ, (in press)
- [69] Worden S.P., Schneeberger T.J., Giampapa M.S., Deluca E.E., Cram L.E., 1984, ApJ, 276, 270
- [70] Zirin H., 1988, in Astrophysics of the Sun, (Cambridge University Press)
- [71] Zirin H., Ferland G.J., 1980 Big Bear Solar Obs., 0192