equation[section]
Galaxy destruction and diffuse light in clusters
Abstract
Deep images of the Centaurus and Coma clusters reveal two spectacular arcs of diffuse light that stretch for over 100 kpc, yet are just a few kpc wide. At a surface brightness of th arcsec-2, the Centaurus arc is the most striking example known of structure in the diffuse light component of a rich galaxy cluster. We use numerical simulations to show that the Centaurus feature can be reproduced by the tidal debris of a spiral galaxy that has been tidally disrupted by the gravitational potential of NGC 4709. The surface brightness and narrow dimensions of the diffuse light suggest that the disk was co-rotating with its orbital path past pericenter. Features this prominent in clusters will be relatively rare, although at fainter surface brightness levels the diffuse light will reveal a wealth of structure. Deeper imaging surveys may be able to trace this feature for several times its presently observed extent and somewhere along the tidal debris, a fraction of the original stellar component of the disk will remain bound, but transformed into a faint spheroidal galaxy. It should be possible to confirm the galactic origin of the Centaurus arc by observing planetary nebulae along its length with redshifts close to that of NGC 4709.
keywords:
galaxies: evolution – galaxies: clusters – galaxies: interactions – galaxies: formation.1 Introduction
Detecting diffuse light in clusters has an enigmatic history spanning several decades (de Vaucouleurs, 1960; Frei et al 1994; Thuan & Kormendy 1977; Uson et al 1991; Vílchez–Gómez et al 1994; Bernstein et al 1995; Tyson et al 1995). Using either CCDs or photographic imaging, these observations have been plagued by background subtraction, stray light within the telescope and optics, and atmospheric scattering. This has made a quantitative analysis difficult: the total amount of diffuse light, its colour, or its radial distribution have not yet been accurately measured. These techniques have lead to claims that as much as 70% of the light attached to galaxies may lie in a diffuse component. More recently, individual planetary nebulae have been detected, inbetween cluster galaxies and with redshifts and velocities that place them inside the cluster potential (Arnaboldi et al 1996; Theuns & Warren 1996; Feldmeier et al 1997). Deep HST images of the Virgo cluster have also revealed a large population of freely orbiting, red-giant stars (Ferguson, Tanvir & Hippel 1998). These studies also indicate large quantities of diffuse light exist in clusters.
Intra-galactic stars must have formed within galaxies and have been subsequently ripped out by gravitational tidal forces. Mergers and slow tidal interactions between galaxies are a well studied phenomenon that can produce dramatic tidal tails of stellar debris (c.f. Toomre 1964, Barnes & Hernquist 1992 and references within). Analysis of dark matter halos within a galaxy cluster that formed hierarchically has demonstrated that mergers are very rare within rich virialised environments (Ghigna et al 1998). However, the impulsive and resonant tidal shocks from rapid fly-by encounters between galaxies can also create tidal debris. The cumulative effect of these encounters can cause a dramatic morphological transition between Sc-Sd spirals to dwarf ellipticals/spheroidals (Moore et al 1996, Rakos et al 1997), whereas low surface brightness galaxies, with lower central densities, can be completely disrupted leading to a possible origin of the diffuse intra-cluster light (Moore et al 1999). This process has been named “galaxy harassment”, and extends previous work on slow interactions between galaxies into the impulsive tidal processes that operate in galaxy clusters (Merrit 1985, Valluri 1993, Henriksen & Byrd 1996, Moore et al 1998, Dubinski 1998).
In the absence of further perturbations, stars that are tidally removed from galaxies will orbit in narrow streams that trace the orbital path of the galaxy. In a cluster, the star streams will be subsequently heated and mixed on a time-scale of a few crossing times, i.e. several billion years. We might therefore expect to find prominent features in the intra-cluster light component from recently disrupted galaxies that have accreted into clusters a few billion years ago. However, with only a couple of documented examples, why are prominent features as bright as these so rare?
The properties of the diffuse light, including its quantity, radial distribution, clumpiness and colour, are of great interest for many reasons. As well as constraining the importance of gravitational interactions as a mechanism for morphological transformation, we have the possibility of using thousands of freely orbiting stars for studying the cluster potential. Understanding the orbital biases of stripped stars and their subsequent evolution within a clumpy potential, will be vital in the interpretation of these velocity data.
Recently, Trentham & Mobasher (1998) detected a low surface brightness feature kpc long within the Coma cluster, that may be the result of a high speed encounter between two galaxies. Conselice & Gallagher (1998) also find a wealth of fine scale substructure and faint tidal features in a survey of several nearby clusters. Here we “re-discover” a much more spectacular arc of diffuse light that stretches for over 100 kpc near NGC4709 within the Centaurus cluster. The stacked sequence of photographic images by David Malin were first reported very briefly in the Anglo-Australian newsletter by John Lucey over 16 years ago; no further attention has since been given to these data. Using the same techniques we have also discovered a second feature that lies near the centre of the Coma cluster that is morphologically similar to the Centaurus arc.
This paper is organized as follows. Section 2 presents details of the two newly discovered arcs, including photographic and CCD colour information of the Centaurus arc, ending with a discussion of alternative mechanisms to tides for the origin of these features. Section 3 is an attempt to reproduce the properties of the Centaurus arc, using numerical simulations to follow the disruption of galaxies within a cluster potential. We summarise these results in Section 4.
2 The Images
The Centaurus arc was originally discovered by applying a photographic amplification technique (Malin 1978) to three plates taken by Malcolm Smith at the f/2.66 prime focus of the 4m telescope of the Cerro Tololo Inter-American observatory (CTIO, 1974). The photographic emulsion was Eastman Kodak type IIIaJ, hyper-sensitized by baking in nitrogen before use. Photographically amplified positive derivatives from these plates were combined into one image (Malin 1981) to improve the image quality and minimize processing non-uniformities. The arc was clearly visible on each of the three copies, and its reality was latter confirmed by photographic amplification of IIIaJ plates taken with the 3.9 m Anglo-Australian Telescope and the 1.2 m UK Schmidt telescope.
More recent CCD observations reveal that if this structure lies in the cluster, it is ( arcmin) long and only ( arcsec) wide (Throughout this paper , ). The arc has very low surface brightness ( mag arcsec-2), is red in colour and points towards the active elliptical galaxy NGC4696. The arc’s colour strongly suggests that it is made of stars, so its narrowness is remarkable. The arc is not perfectly straight and has a small curvature along its length.

The top half of Figure 1 shows a negative print of part of the photographically amplified, combined images of the CTIO plates. The arc is the linear feature that extends from the lower left corner (south east) towards the nucleus of NGC4696. The lower image shows the same part of the sky on a single unamplified plate.
The photographs (and CCD frames) show the arc to be diffuse and seemingly devoid of fine structure at the arcsec level. While there are many faint stars and galaxies in the field, there is no apparent enhancement of point-like or diffuse objects along its length. (The point-like source near the centre of the arc is a star). The arc first becomes visible near a small, edge-on S0 galaxy, ESO 322-G102, at a projected distance of about from NCG 4696; the truncation of the arc at this point may be a line-of-sight coincidence, since there is no evidence of any interaction between the arc and ESO 322-G102. Subtraction of the extended light profile of NGC 4696 may reveal the arc on the opposite side of the S0 galaxy.
Spectroscopy of the arc would be extremely difficult in view of its very low surface brightness, however, broadband CCD images of the brightest regions were obtained making it possible to compare the colours of the arc with aged stellar populations. CCD pictures were taken in B, R and I bands with an RCA 350x512 chip at the f/3.3 prime focus of the AAT under photometric conditions on the night of 21/22 June 1990. The CCD scale was arcsec/pixel, and the seeing arcsec. Two sets of overlapping exposures were taken, with total exposure times of 90 minutes in B, 40 minutes in R and 20 minutes in I. Flat fields and bias frames were taken on the same night.
Table 1 lists the surface brightness and colours of the arc as measured from the overlap region of the CCD frames. In each case, the mean surface brightness in three regions along the arc was measured, each roughly arcsec2 and free of obvious foreground stars, and six ‘sky’ regions of similar area straddling the arc and just outside it. The errors quoted in Table 1 are errors on the mean of the three sky-subtracted arc measurements in each filter.
| Surface brightness (mag arcsec-2) | Colour (mag) |
| Arc | |
| Sky (I frame in twilight) | |
The CCD measurements confirm that the arc is extremely diffuse and very faint, reaching no more than 0.7% of the brightness of the night sky. Further out, the arc is even fainter and we estimate that the faintest parts of the structure revealed by the photographic plates are only 0.1% of the night sky brightness.
The same techniques have also been applied to photographic images of the central regions of the Coma cluster (Abell 1656). These have revealed a feature in the diffuse light, close to NGC 4874, that stretches East-West for at least 5 arcmin, (Figure 2). It is curved slightly concave to NGC 4874 in a manner very similar to the curve in the Centaurus cluster feature where it appears closest to NGC 4709. The image was made by combining photographically amplified derivatives from three UK Schmidt plates. Two of the plates (J9946 and J10027) were deep IIIa-J (395-550nm) exposures while one was plate OR9945 covering the range 590-700nm. The linear feature is visible individually on all of the plates, but is much less obvious on the red-light plate. Given the large airmass through which the exposures were necessarily made and the smaller number of plates, this suggests that the surface brightness of the Coma arc is higher than that in the Centaurus cluster. The large airmass has also contributed to the relatively poor seeing in these plates, which is probably why we are unable to confirm the Trentham & Mobasher (1998) feature.
The Coma arc is neither as narrow nor as well defined as that in the Centaurus cluster and two resolved galaxies appear to be embedded in the brightest part of it. Given the large number of galaxies in the field, this could be a line-of-sight coincidence, or one of these could be the remnant nucleus of a disrupted galaxy. We note that this feature in Coma was reported independently by Gregg & West (1998). In the absence of CCD photometry of the Coma arc, and its poorer resolution due to its distance, we shall focus our attention on the origin of the Centaurus arc.

2.1 Possible origins
The Centaurus arc is unlikely to be foreground reflection nebulosity in our own Galaxy. Malin has used his photographic amplifications technique on many fields containing Galactic nebulosity, and notes that the Centaurus feature (at Galactic latitude ) is morphologically quite different. In particular, it lacks the high-frequency ‘crumpling’ characteristic of Galactic cirrus and reflection nebulosity. Also, the arc is almost straight (it deviates from a straight line by at most arcsec in the arcsec length covered by the CCD frames) and points at the nucleus of NGC 4696, the brightest galaxy in the Centaurus cluster.
The region of the arc observed with the CCD has colours consistent with those of K0 stars in the (B-R), (R-I) two-colour diagram (Figure 3, Cousins 1981). If the arc were dominated by optical synchrotron radiation it would be bluer than this, with B-R around 0.7-1.2 as typically seen in BL Lac objects (Moles et al 1985) and the M87 jet (Tarenghi 1981). Whilst the arc might be composed of ionized gas, with most of its light coming from O++ and H+ ions, very unusual line ratios would be needed to produce the observed colours and it would be difficult to account for the I-band emission. Furthermore, it is hard to imagine a long-lived ionizing source which could operate over such a large distance. If light from the arc originated from emission lines, we would also need to account for the collimation of the ionized gas, or the ionizing beam, or both. We therefore conclude that the arc is probably composed of stars with a mean spectral class of around K0.

Could the feature be a gravitational arc from a background galaxy that has been lensed by the combined potential of NGC4696 and NGC4709? In order to produce a gravitationally lensed image this straight, the potential has to be complex, such as would occur in between the combined potential of the two central cDs. Furthermore, a lensed image this close to the massive potential of NGC4709, would produce a much shorter image. Thus, if the mass distribution traces the light distribution to a reasonable extent, then its position and morphology rule out gravitational lensing.
The dimensions of the object rule out a diffuse galaxy that happens to lie along the line of sight – the axial ratios are about sixty to one. If the Centaurus arc is stellar and lies in the cluster, then either the stars formed in situ, or they have been removed from one of the cluster galaxies; since no mechanism is known for the former, we shall concentrate on the latter. In either case, the key challenge for any successful model for its origin is to reproduce both the length and narrowness of the feature.
We can estimate the mass of the stars in the arc from its integrated luminosity. Combining measurements of its area and mean surface brightness gives an estimated total B magnitude of for the integrated light. At the distance of the Centaurus cluster (taken here as ), this is roughly , corresponding to if we assume a mass-to-light ratio of .
The remainder of this paper will be devoted to investigating the possibility that the Centaurus arc consists of stars that have been tidally stripped from a cluster galaxy. Since the total stellar mass of the arc is just a few percent of the stellar mass of an galaxy we have two possibilities for the progenitor galaxy. It may have originated from a single dwarf galaxy that has been completely disrupted and all the original stars form the 100 kpc streak of light. Alternatively, the observed feature may represent part of the tidal debris that has been torn from a more luminous galaxy. In the latter case, the bulk of the tidal debris may extend beyond the current image and may be detectable at lower surface brightness levels.
3 Tides and tails; numerical simulations
We shall use numerical simulations to investigate the possibility that the Centaurus arc is tidal debris from a gravitational interaction between a galaxy and one of the cD galaxies NGC 4696 or NGC 4709. Although their is a wide parameter space to explore, in both morphology and orbits, it is clear that spheroidal galaxies (either dwarf elliptical/dSph or giant ellipticals) are unlikely candidates. Ellipticals are too centrally concentrated to loose a great deal of stars, and their tidal debris will not occupy such a narrow region in phase space.
The position of the Centaurus arc next to the cluster centre suggests that the potential of one of the massive central cD galaxies was responsible for the disruption. However, we can’t rule out the possibility that the encounter took place further from the cluster centre and we are observing the debris passing pericentre. Rather than treat the full cluster potential and its substructure, we shall model the cD galaxy as a single truncated isothermal dark matter halo with a moderate core radius of 50 kpc and mean velocity dispersion of kms-1.

We will study galaxies with global properties that resemble observed spheroidals and disks of varying surface brightness and luminosities (c.f. Moore et al 1999 and Figure 4.). Equilibrium “N-body” galaxy models are constructed using the techniques of Hernquist (1989). To evolve the galaxies in orbit through the cluster potential we use the parallel treecode “PKDGRAV” (Stadel et al , in preparation). When we simulate the galaxies in isolation they are stable and remain in equilibrium. We explore a wide range of orbits that allow us to vary the strength of the impulsive shock and then compare the properties of the tidal debris with the Centaurus data. Following the galaxies for several Gyrs we conclude that orbits with apocentric distance kpc and pericentric distance of kpc produce the longest and thinnest tidal streams. This orbit is close to the typical orbit of “halos within halos” for a hierarchical Universe measure by Ghigna et al (1998).
For the spheroidal models, long streams of debris are obtained, but they are over 3 magnitudes too faint to explain the Centaurus arc. Even after several passages past pericentre, most of the material remains bound to the galaxies. We would require the entire system to be disrupted into a single smooth stream of length kpc in order to explain the Centaurus feature. We were unable to achieve this.
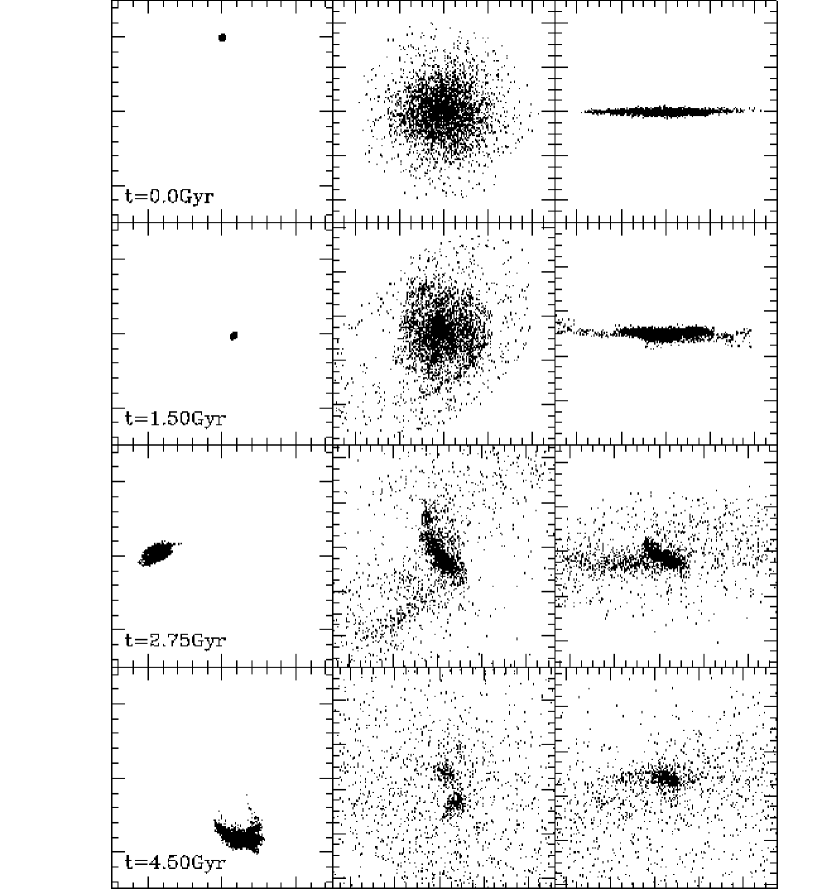
The orbits of the spiral galaxies have an extra degree of freedom, namely the orientation of the disk as the galaxy moves past pericentre. We consider the extreme cases of a disk that is either counter-rotating or co-rotating with respect to the orbital direction. Figure 5 shows the evolution of one of the low surface brightness spirals in a counter-rotating orbit.
The first tidal shock occurs after 1.0 Gyr, yet after 1.5 Gyrs the disk does not appear to be too disturbed. After 2.75 Gyr (almost 2.0 Gyrs after the encounter) the response to the perturbation is clearly apparent and the stripped stars surround the central stellar remnant. Continued heating after several more pericentric encounters almost completely unbinds the system, although the tidal debris never forms narrow features in phase space.
We now change the direction of the orbit through the cluster potential such that the disk is co-rotating with the galaxy’s direction past pericentre. After just 0.5 Gyrs, the morphology of the galaxy shown in Figure 6 has been dramatically altered. Already, most of the disk structure has been destroyed, and the stellar distribution has been significantly heated. However, the most significant change occurs in the appearance of the tidal debris. 1.0 Gyr after the first encounter the tidal debris begins to form long thin tidal tails of stars that have been symmetrically torn from the disk and trace the orbital path of the galaxy. In this case, 90% of the stars have been stripped, although the remaining stars remain bound in a spheroidal configuration with an exponential surface brightness distribution.
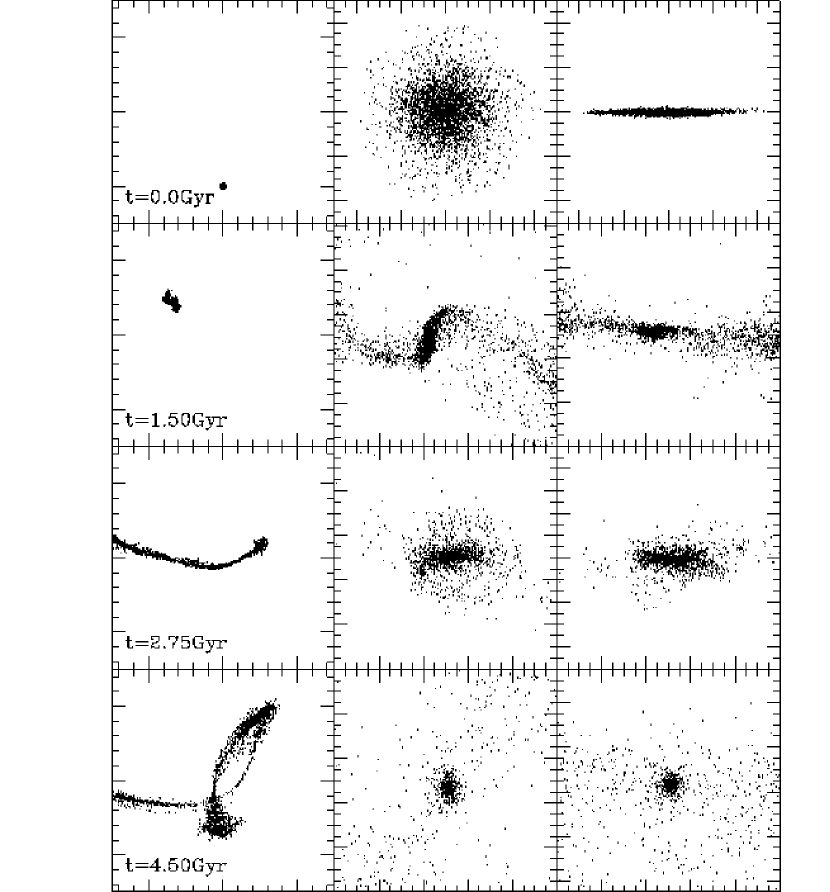

The tidal debris from both HSB and LSB galaxies can create long ( kpc) and thin ( kpc) diffuse arc-like features. Figure 6 shows that the debris has the narrowest dimension and would be most luminous as it is passing pericentre. At this point, the orbits of the stars bunch up because they are moving through the deepest part of the potential. It is this section of the tidal debris that we associate with the Centaurus arc that also lies close to the centre of the cluster potential. We illustrate this in Figure 7.
Because the HSB galaxies are more centrally concentrated they lose less material and the resulting tidal features are not as prominent. Can we distinguish between these two possibilities? At time Gyrs we extract a 100 kpc length of the stellar debris that is just approaching pericentre and then project the data to measure its surface brightness. The central surface brightness of the inner contour of the LSB galaxy is arcsec-2, while for the HSB it is arcsec-2. For this conversion we have assumed a mass to light ratio of . Although the difference is small, they suggest that LSB galaxies produce brighter features although a great deal of uncertainty arises from the assumed mass to light ratios.
A larger fraction of stars were stripped from disks that are co-rotating with their orbit, and the stripped stars formed long narrow streams that resembled the Centaurus arc. We can understand why this happens by considering the relevant dynamical time-scales. The impulsive shock occurs on a time-scale Gyrs, where the impact velocity of the galaxy is as it moves past pericentre kpc. We can compare this time-scale with the time it takes for the disk stars to make half a revolution within the core radius of the galaxy, , , where . For the particular galaxy and orbit simulated here, Gyrs. If the disk is co-rotating, then the encounter occurs closer to a resonance and more energy is imparted to the disk stars, which can subsequently spread further through the cluster potential.
Our simulations showed that the orbits of the stripped stars move closer together as they move through pericentre. This creates the appearance of a “standing wave” near the cluster centre, where the surface brightness of the debris is significantly enhanced. The orbits bunch together near pericentre because the gradient in the cluster potential is larger in the centre. We can make a rough quantitative estimate of the enhancement in surface brightness as follows: Consider two stars in circular orbits near the cluster centre at distances ra1 and ra2, separated by a small radial distance ra. What happens to the separation of the particles as we move the orbits further out into the cluster, but preserve the small energy difference between the two particles? Now the particles orbit at distances rp1 and rp2, this time separated by rp.
The total energy of each orbit () is conserved and equal to Where is the kinetic energy term for each orbit and 222Note that we have use a truncated isothermal spherical potential where is the constant velocity dispersion and is the truncation radius. its corresponding potential energy. Because we are dealing with an isothermal potential, all circular orbits have the same kinetic energy, therefore the difference in total energy for each pair of orbits is given by:
If the energy difference of both orbits is the same then
which leads to
Thus for a given energy difference; orbits tend to get closer together as they move towards the central regions of the potential. For an orbit with apo:peri of 10:1, the enhancement of the surface brightness the tidal stream will be roughly a factor of 10 at pericentre.

Further support for stellar debris of a galactic origin can be found by considering the colours of the Centaurus arc. In Table 2 we give typical colour differences for galaxies of different morphologies across the Hubble diagram (Frei & Gunn 1994; de Blok et al 1995). Once the stars are removed from the galaxy, star formation will be abruptly halted and the stars will fade in a predictable manner. Figure 8 shows how the colour indices fade with time for a given stellar population with known metallicity and IMF (Bruzual & Charlot).
The tidal tails match the appearance of the Centaurus arc Gyr after being stripped from the model galaxies. i.e. the time since the first passage past pericenter. After a Gyr, the amount of fading will be and for B-R and R-I, respectively. We now reconsider the observed values for the arc (see Table 1). We add a further correction for galactic dust reddening using the data of Burstein & Heiles (1982) and Schlegel et al (1998); this brings the values of the colours to:
If we take into account the amount of fading over one Gyr, then the initial stellar colours of the stars in the arc would have been and . These colours, within the uncertainties, are consistent with late type spirals and LSB disk galaxies, providing further support for our model.
| Ellipticals | Sab’s | Scd’s | LSB | |
|---|---|---|---|---|
| B-R | ||||
| R-I |
4 Conclusions
Deep photographic and CCD observations of the Centaurus cluster revealed a spectacular arc of diffuse light. This feature is remarkable given its length and narrowness, arcmin kpc long and arcsec kpc wide. The arc is diffuse with no apparent structure and its colours indicate that it is made of stars. The estimated total mass from its integrated luminosity is and its surface brightness (in mag arcsec-2) is ; ; in the R band and , in the I band. Several possible scenarios for its origin, including foreground reflection nebulae, gravitational lensing or a radio jet, are rejected in favor of a gravitational tidal interaction that created an arc of stellar debris. A second feature with similar morphology is also revealed within the central region of the Coma cluster.
We used numerical simulations to investigate the response of galaxies of different morphologies to tidal shocks as they pass pericentre in a cluster potential. The only scenario that gave rise to tidal debris with the same characteristics of the Centaurus arc was a luminous spiral galaxy with a disk co-rotating with its passage past pericenter. This encounter geometry imparts the maximum energy to the disk stars allowing them to stream away and form long thin tidal tails of stellar debris that trace the orbital path of the galaxy. Only a small fraction of the tidal debris constitutes the Centaurus feature, which is prominent at its current pericentric position where the orbits move closer together.
One could potentially confirm the galactic origin of the Centaurus arc. By taking images along its length using different filters, (e.g. OIII or H) such as discussed in Feldmeier et al (1997), one would expect to find an over abundance of planetary nebulae at similar redshifts to NGC4709; thus confirming the stellar nature and formation mechanism. Deeper images of these features should allow them to be traced to larger extents. Somewhere along the tidal tails lies the remnant spheroidal galaxy surrounded by a cloud of diffuse light that closely resembles the feature reported by Trentham & Mobasher (1998).
Acknowledgments
Carlos Calcáneo–Roldán would like to thank the People of México for there generous support, through a grant by CONACyT, which allows him to continue his research. Ben Moore is a Royal Society research fellow. Computations were carried out as part of the Virgo consortium.
References
- [1] Arnaboldi, M., Freeman, K. C., Mendez, R. H., Capaccioli, M., Ciardullo, R., Ford, H., Gerhard, O., Hui, X., Jacoby, G. H., Kudritzki, R. P. & Quinn, P. J., 1996, ApJ, 472, 145.
- [2] Barnes, J. & Hernquist, L. 1992, ARAA, 30, 705.
- [3] Bernstein, G.M., Nichol, R.C., Tyson, J.A., Ulmer, M.P. & Wittman D., 1995, AJ, 110, 1507.
- [4] Bruzual, A. G. & Charlot, S., 1993, ApJ, 405, 538.
- [5] Bruzual, A. G. & Charlot, S., 1998, in preparation.
- [6] Burstein, D. & Heiles, C., 1982, AJ, 87, 1165.
- [7] Henriksen, M. & Byrd, G. 1996, ApJ, 459, 82.
- [8] Conselice, C. J. & Gallagher, J. S. 1999, AJ, in press (astro–ph/9809390).
- [9] Cousins, A. W. J., 1981, SAAO Circulars, 1(6), 4.
- [10] de Blok, W. J. G., van der Hulst, J. M. & Bothun, G. D., 1995, MNRAS, 274, 235.
- [11] de Vaucouleurs, G., 1960, ApJ, 131, 585.
- [12] Dubinski J., 1998, Ap.J, 502, 141.
- [13] Feldmeier, J. J., Ciardullo, R. & Jacoby, G. H., 1997, ApJ, 479, 231.
- [14] Ferguson, H. C., Tanvir, N. R. & von Hippel, T., 1998, Nature, 391, 461.
- [15] Frei, Z. & Gunn, J. E., 1994, AJ, 108, 1476.
- [16] Ghigna, S., Moore, B., Governato, F., Lake, G., Quinn, T. & Stadel, J., 1998, MNRAS, 300, 146.
- [17] Gregg, M. D. & West M. J., 1998, Nature, 396, 549.
- [18] Gunn, J. E., 1969, BAAS, 1, 191.
- [19] Hernquist, L. & Katz, N., 1989, ApJS, 70, 419.
- [20] Malin, D. F., 1978, Nature, 276, 591.
- [21] Malin, D. F., 1981, Phot. Sci., 29, 199.
- [22] Merritt, D., 1984, AJ, 276, 26.
- [23] Merritt, D., 1985, ApJ, 289, 18.
- [24] Mihos, J. C., McGaugh, S. S. & de Blok, W.J.G., 1997, ApJ Lett, 477, L79.
- [25] Moles, M., Garcia–Pelayo, J. M., Masegosa, J. & Aparicio, A., 1985, ApJS, 58, 255.
- [26] Moore, B., Katz, N., Lake, G., Dressler, A., & Oemler, A. J., 1996, Nature, 379, 613.
- [27] Moore, B., Lake, G. & Katz, N., 1998, ApJ, 495, 139.
- [28] Moore, B., Governato, F., Quinn, T., Stadel, J. & Lake, G., 1998, ApJ Lett., 499, L5.
- [29] Quinn, T., Katz, N., Stadel, J. & Lake, G., 1997, submitted to ApJ, (astro–ph/9710043).
- [30] Rakos, K., Odel, A. & Schombert, J. 1997, ApJ, 490, 201.
- [31] Scheick, X. & Kuhn, J. R., 1994, ApJ, 423, 566.
- [32] Schlegel, D.J., Finkbeiner, D. P., Davis, M., 1998, ApJ, 500, 525.
- [33] Tarenghi, M., 1981, in Optical Jets in Galaxies, ESA SP-162, 145.
- [34] Theuns, T. & Warren, S. J., 1996, MNRAS, 284, L11.
- [35] Thuan, T. X. & Kormendy, J., 1977, PASP, 89, 466.
- [36] Toomre, A. 1964, ApJ, 139, 1217.
- [37] Trentham, N. & Mobasher, B., 1998, MNRAS, 293, 53.
- [38] Tyson, J.A. & Fischer, P., 1995, ApJ Lett., 446, L55.
- [39] Uson, J. M., Boughn, S. P. & Kuhn, J. R., 1991, ApJ, 369, 46.
- [40] Valluri, M. 1993, ApJ, 408, 57.
- [41] Vílchez–Gómez, R., Pelló, R. & Sanahuja, B., 1994, A&A, 283, 37.
- [42] Weil, M.L., Bland–Hawthorn, J. & Malin, D.F., 1997, ApJ, 490, 664.
- [43] Zwicky, F., 1951, PASP, 63, 61.