REGULARITY OF THE LARGE-SCALE STRUCTURE OF THE UNIVERSE
Abstract
-
Tartu Observatory, EE-2444 Tõravere, Estonia
-
Abstract. Recent analysis of the distribution of clusters of galaxies is reviewed. Clusters of galaxies located in rich superclusters form a quasiregular lattice. The power spectrum of clusters of galaxies has a sharp peak at wavelength Mpc corresponding to the lattice step. The peak in the spectrum may be due to processes during the inflationary stage of the structure evolution.
-
Tartu Observatory, EE-2444 Tõravere, Estonia
-
Abstract. Recent analysis of the distribution of clusters of galaxies is reviewed. Clusters of galaxies located in rich superclusters form a quasiregular lattice. The power spectrum of clusters of galaxies has a sharp peak at wavelength Mpc corresponding to the lattice step. The peak in the spectrum may be due to processes during the inflationary stage of the structure evolution.
1 Introduction
Galaxies and systems of galaxies are formed due to initial density perturbations of different scale. Short perturbations of a scale of several Megaparsecs give rise to the formation of galaxies, medium scale perturbations lead to the formation of clusters of galaxies. Perturbations of a characteristic scale of Mpc are related to superclusters of galaxies. Still larger perturbations have a lower amplitude and modulate densities and masses of smaller systems (Frisch et al 1995).
We use the term superclusters of galaxies for the largest relatively isolated density enhancements in the Universe (Einasto et al 1997b). Superclusters consist of filamentary chains of galaxies, groups and clusters of galaxies, and voids between them. Superclusters are not completely isolated in space. Galaxy and cluster filaments connect neighbouring superclusters to a single network. Superclusters and voids form a continuous web which extends over the whole observable part of the Universe.
Let us accept the inflationary paradigm, and assume that the Universe is dominated by cold dark matter (CDM) and that initial density perturbations have a Gaussian distribution. Under these assumptions large-scale high- and low-density regions should be randomly distributed. It was a great surprise when Broadhurst et al (1990) found that the distribution of high-density regions in a small area around the northern and southern Galactic pole is fairly regular: high- and low-density regions alternate with a rather constant step of 128 Mpc. The power spectrum of galaxies of the Broadhurst survey has a sharp peak on the scale equal to the step of supercluster network along the line of sight. Recent analysis of deep galaxy and cluster samples has shown that the power spectrum of these objects has also a spike on similar scale. The presence of such a spike is difficult to explain.
In this review I shall give a summary of recent work on the distribution of galaxies and clusters of galaxies on large scales. The distribution is characterised quantitatively by the power spectrum of density perturbations of these objects. Our goal is to explain the spike in the observed power spectrum.
2 The distribution of high-density regions
Here we shall discuss the distribution of high-density regions in the Universe. High-density regions of the Universe can be located by clusters in very rich superclusters.
The Abell-ACO cluster sample (Abell 1958, Abell, Corwin and Olowin 1989) is presently the largest and deepest sample of extragalactic objects which covers the whole sky out of the Milky Way zone of avoidance. Thus the study of the distribution of Abell-ACO clusters is of special interest. We have used the compilation of all available redshifts of Abell-ACO clusters by Andernach and Tago (1998, in preparation), and the supercluster catalogue by Einasto et al (1997b) based on this compilation.
The distribution of Abell-ACO clusters shows that very rich superclusters form a fairly regular lattice (Einasto et al 1997b, 1998d). In Figures 1 and 2 we give the distribution of superclusters consisting of 8 and more clusters of galaxies. A regular lattice is very well seen in the southern Galactic hemisphere. In the northern hemisphere the regularity can be best seen if we use a thin slice as in Figure 1.
Figure 2: Distribution of clusters in high-density regions in supergalactic coordinates. A 100 Mpc thick slice is shown to avoid projection effects. Only clusters in superclusters with at least 8 members are plotted. The supergalactic plane coincides almost exactly with the Galactic equatorial plane; Galactic zone of avoidance is marked by dashed lines. 
Clusters of galaxies in less rich superclusters and isolated clusters are basically located in walls between voids formed by very rich superclusters, see Figure 2. Their distribution complements the distribution of very rich superclusters, together they form a fairly regular lattice. Cells of this lattice have a characteristic diameter about 120 Mpc.
Figure 4: Distribution of Abell-ACO and APM clusters in high-density regions in supergalactic coordinates. Abell-ACO clusters in superclusters with at least 8 members are plotted; APM clusters are plotted if located in superclusters of richness 4 and higher. The supergalactic plane coincides almost exactly with the Galactic equatorial plane and marks the Galactic zone of avoidance. In the left panel some superclusters overlap due to projection, in the right panel only clusters in the southern Galactic hemisphere are plotted and the projection effect is small. 
A regular distribution of objects in high-density regions has been detected so far only for Abell-ACO clusters of galaxies. It has been argued that this sample is distorted by selection effects and that the regular location of clusters may be spurious. To check this possibility we compare the distribution of Abell-ACO clusters with that of APM clusters. Results for clusters in rich superclusters are shown in Figure 2. This comparison shows that all rich superclusters are well seen in both cluster samples. There is a systematic difference only in the distribution of more isolated clusters since the APM sample contains some clusters also in less-dense environment (in voids defined by Abell-ACO clusters) as seen in Figure 2.
Figure 2 demonstrates also why the overall regularity of the distribution of APM clusters is much less pronounced. The APM sample covers only a small fraction of the volume of the Abell-ACO cluster sample: APM sample is located in the southern hemisphere and even here it covers a smaller volume. Thus it is not surprising that the grand-design of the distribution of high-density regions is not well seen in the APM sample.
This comparison of the distribution of Abell-ACO and APM clusters shows that Abell-ACO clusters are good tracers of the large-scale distribution of high-density regions. Presently the Abell-ACO sample provides the best candidate to a fair sample of the Universe.
3 The power spectrum of galaxies and clusters of galaxies
Einasto et al (1998a) have analysed recent determinations of power spectra of galaxies and clusters of galaxies; a summary is given in Figure 1. Here power spectra of different objects are vertically shifted to coincide amplitudes near the wavenumber Mpc-1. On medium scales spectra have a negative spectral index; near the scale Mpc or wavenumber Mpc-1 spectra have a turnover; on very large scales the spectral index approaches the theoretically predicted value .
Figure 6: Power spectra of galaxies and clusters of galaxies scaled to match the amplitude of the 2-D APM galaxy power spectrum (Einasto et al 1998a). Spectra are shown as smooth curves. Bold lines show spectra for clusters data: short dashed line for Abell-ACO clusters according to Einasto et al (1997a), long-dashed line according to Retzlaff et al (1998), dot-dashed line for APM clusters (Tadros et al 1998); thin lines for galaxies: short dashed line for IRAS galaxies (Peacock 1997), long-dashed line for SSRS-CfA2 galaxy survey (da Costa et al 1994), dot-dashed line for LCRS (Landy et al 1996). The solid thick line shows the mean power spectrum, the dashed thick line indicates the power spectrum derived from the APM 2-D galaxy distribution (Peacock 1997, Gaztañaga and Baugh 1998). 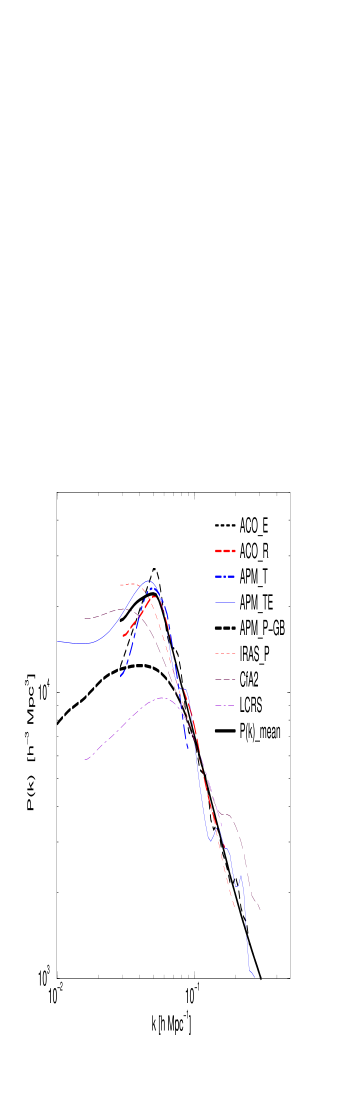
A closer inspection shows that after scaling samples have different amplitudes near the turnover. Cluster samples as well as APM and SSRS-CfA2 galaxy samples have a high amplitude near the maximum. Spectra of cluster samples have here a sharp spike. In contrast, IRAS and LCRS galaxy samples have a much shallower transition of lower amplitude; the power spectrum calculated from the 2-D distribution of APM galaxies has also a shallow maximum. The reason for this difference is not fully clear. It is possible that the spatial distribution of different objects is different. On the other hand, it is not excluded that differences may be partly caused by disturbing effects in data reduction. For instance, the window function of the LCRS is very broad in Fourier space which can smear out the spike in the power spectrum.
We have formed two mean power spectra of galaxies. One mean spectrum is based on cluster samples and APM and SSRS+CfA2 galaxy samples, it has a relatively sharp maximum at Mpc-1, and a power law behaviour on medium scales with index . Cluster samples cover a large volume where rich superclusters are present; we call this power spectrum as characteristic for populations in high-density regions, and designate the spectrum . The second mean power spectrum was derived from spectra of the LCRS sample, the IRAS galaxy sample, and the APM 2-D sample. These catalogs sample regions of the Universe characteristic for medium-rich superclusters, we designate this spectrum . Both mean power spectra are shown on Figure 3.
4 Reduction of mean power spectra to matter
It is well known that the evolution of matter in low- and high-density regions is different. Gravity attracts matter toward high-density regions, thus particles flow away from low-density regions, and density in high-density regions increases until contracting objects collapse and form galaxies and clusters of galaxies. The collapse occurs along caustics (Zeldovich 1970). Bond, Kofman and Pogosyan (1996) demonstrated that the gravitational evolution leads to the formation of a web of high-density filaments and under-dense regions outside of the web. The contraction occurs if the over-density exceeds a factor of 1.68 in a sphere of radius which determines the mass of the system or the galaxy (Press & Schechter 1974). In a low-density environment the matter remains primordial. This difference between the distribution of the matter and galaxies is called biasing. The gravitational character of the density evolution of the Universe leads us to the conclusion that galaxy formation is a threshold phenomenon: galaxies form in high-density environment, and in low-density environment the matter remains in primordial dark form.
The power spectrum of clusters of galaxies has an amplitude larger than that for galaxies and matter. We can define the bias parameter through the power spectra of mass, , and of the clustered matter, ,
where is the wavenumber in units of Mpc-1, and the Hubble constant is expressed as usual, km s-1 Mpc-1. In general the biasing parameter is a function of wavenumber .
Gramann & Einasto (1992), Einasto et al (1994) and Einasto et al (1998b) investigated the power spectra of matter and simulated galaxies and clusters. They showed that the exclusion of non-clustered matter in voids from the population shifts the power spectrum of the clustered matter in high-density regions to higher amplitude. The bias factor calculated from equation (1) is surprisingly constant, and can be found from the fraction of matter in the high-density clustered population, ,
Figure 8: Left: Power spectra of simulated galaxies. The solid bold line shows the spectrum derived for all test particles (the matter power spectrum); dashed and dotted bold lines give the power spectrum of all clustered particles (sample Gal-1), and clustered galaxies in high-density regions (sample Clust). Thin solid and dashed lines show the power spectra of samples of particles with various threshold densities and sampling rules, see Table 1 and text for details. Right: the biasing parameter as a function of wavenumber, calculated from definition eqn. (1). Samples and designations as in left panel. 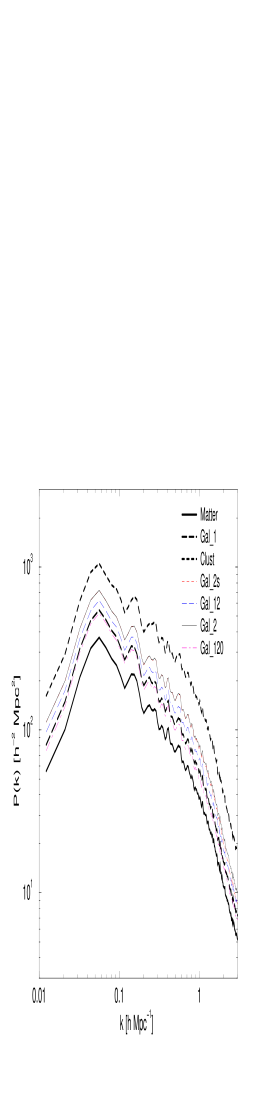
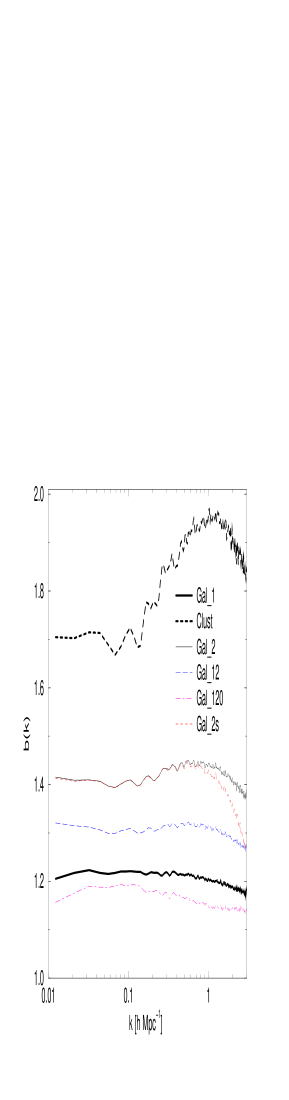
In Figure 4 we show the power spectra and related biasing factors for several simulated galaxy populations, calculated using various threshold densities to separate the unclustered matter in voids and the clustered matter associated with galaxies in high-density regions (Einasto et al 1998b). In calculating densities a small smoothing length Mpc was used; in this case the clustered matter associated with galaxies and their dark haloes is not mixed with non-clustered matter in voids. This analysis shows that biasing factor is almost independent of the scale, and can be calculated from equation (1). The flow of matter from low-density regions was studied by Einasto et al (1994) and Einasto et al (1998b). They showed that this flow depends slightly on the density parameter of the structure evolution model. In the standard CDM model the speed of void evacuation is slightly faster than in open CDM models and spatially flat CDM models with cosmological constant. The present epoch of the model was found using the calibration through the parameter – rms density fluctuations within s sphere of radius 8 Mpc. This parameter was determined for the present epoch for galaxies, . Using this estimate and CDM models with lambda term and density parameter Einasto et al (1998b) get , and .
5 Primordial power spectrum of matter
The semi-empirical power spectrum of matter, found from galaxy and cluster surveys and reduced to the matter, can be used to compare with theoretical models. Such analysis has been done by Einasto et al (1998c). CDM models with and without cosmological constant, mixed dark matter models, and open CDM models were used for comparison. Models were normalised to four year COBE observations; a Hubble parameter was used; the density in baryons was taken (in units of the critical density); the density parameter was varied, the model was kept flat using cosmological constant . In mixed DM models the density of neutrinos was ; in open models the density parameter was varied between and .
The observed power spectrum is influenced on small scales by non-linear evolution of the structure, on these scales the spectrum was reduced to linear case using analytical models, the best agreement was achieved by a MDM model with density parameter . In Figure 5 we show the semi-empirical linear power spectra of matter, which represent galaxy populations in high- and medium-density regions. These empirical spectra are compared with analytical power spectra for MDM models calculated for various density parameter values from 0.25 to 1.0.
Figure 10: The semi-empirical matter power spectra compared with theoretical and primordial power spectra. Left: present power spectra; right: primordial spectra; for MDM models. Solid bold line shows the linear matter power spectrum found for regions including rich superclusters, ; dashed bold line shows the linear power spectrum of matter for medium dense regions in the Universe. Model spectra with are plotted with thin lines; for clarity the models with and are drawn with dashed lines. Primordial power spectra are shown for the peaked matter power spectrum, ; they are divided by the scale-free spectrum, . The mean error of semi-empirical power spectra is about 11 %. 

The comparison of observed and theoretical power spectra gives us also the possibility to calculate the primordial or initial power spectra
where is the transfer function. In right panels of Figure 5 we plot the ratio of the primordial power spectrum to the scale-free primordial power spectrum, , where . Only results for the peaked power spectrum are shown. The primordial power spectrum calculated for the shallower power spectrum is flatter; on large and small scales it is similar to the spectrum shown in Figure 5.
The main feature of primordial power spectra is the presence of a spike at the same wavenumber as that of the maximum of the observed power spectrum. On scales shorter than that of the spike the primordial spectrum can be well approximated by a straight line (on log–log plot), i.e. by a tilted model with index , if ; and , if . This approximation breaks, however, down if we consider the whole scale interval. Additionally, there is a considerable difference in the amplitude of the primordial spectrum on small and large scales. For most values of the density parameter the amplitude on small scales is lower than on large scales; for very low values of the effect has opposite sign.
In conclusion we can say that it seems impossible to avoid a break in the primordial power spectrum. If the peaked power spectrum , based on cluster and deep galaxy data, represents the spectrum of a fair sample of the Universe, then the break of the primordial power spectrum is sudden, otherwise it is smooth. The relative amplitude of the break, and the respective change in the power index of the spectrum depends on models and cosmological parameters used. In the framework of the inflationary paradigm the primordial power spectrum is generated during the inflation. A broken scale primordial power spectrum suggests that inflation may be more complicated than thought so far. One possibility for a broken scale primordial power spectrum has been suggested by Lesgourgues et al (1997). Future deep surveys of galaxies will fix the initial power spectrum of matter more precisely. Presently we can say that a broken-scale primordial power spectrum deserves serious attention.
Acknowledgments
I thank H. Andernach, R. Cen, M. Einasto, S. Gottlöber, A.Knebe, V. Müller, A. Starobinsky, E. Tago and D. Tucker for fruitful collaboration and permission to use our joint results in this talk. This study was supported by the Estonian Science Foundation.
References
-
Abell G 1958 Astrophys. J. Suppl. 3 211
-
Abell G, Corwin H and Olowin R 1989 Astrophys. J. Suppl. 70 1 (ACO)
-
Bond J R, Kofman L and Pogosyan D 1996 Nature 380 603
-
Broadhurst T J, Ellis R S, Koo D C and Szalay A S 1990 Nature 343 726
-
da Costa L N, Vogeley M S, Geller M J, Huchra J P and Park C 1994 Astrophys. J. 437 L1
-
Einasto J, Einasto M, Gottlöber S, Müller V, Saar V, Starobinsky A A, Tago E, Tucker D, Andernach H and Frisch P 1997a Nature 385 139
-
Einasto J, Einasto M, Tago E, Müller V, Knebe A, Cen R, Starobinsky A A and Atrio-Barandela F 1998b Astrophys. J. (submitted)
-
Einasto J, Einasto M, Tago E, Starobinsky A A, Atrio-Barandela F, Müller V, Knebe A and Cen R 1998c Astrophys. J. (submitted)
-
Einasto J, Einasto M, Tago E, Starobinsky A A, Atrio-Barandela F, Müller V, Knebe A, Frisch P, Cen R and Andernach H and Tucker D 1998a Astrophys. J. (submitted)
-
Einasto J, Saar E, Einasto M Freudling W and Gramann M 1994a Astrophys. J. 429 465
-
Einasto M, Einasto J, Tago E, Tucker D and Andernach H 1998d (in preparation)
-
Einasto M, Tago E, Jaaniste J, Einasto J and Andernach H 1997b Astron. and Astrophys. Suppl. 123 119
-
Frisch P, Einasto J, Einasto M, Freudling W, Fricke K J, Gramann M, Saar V and Toomet O 1995 Astron. Astrophys. 296 611
-
Gaztañaga E and Baugh C M 1998 Mon. Not. R. astr. Soc. 294 229
-
Gramann M and Einasto J 1992 Mon. Not. R. astr. Soc. 254 453
-
Landy S D, Shectman S A, Lin H, Kirshner R P, Oemler A A and Tucker D 1996 Astrophys. J. 456 L1
-
Lesgourgues J, Polarski D and Starobinsky A A 1997 Mon. Not. R. astr. Soc. (in press) [astro-ph/9711139]
-
Peacock J A 1997 Mon. Not. R. astr. Soc. 284 885
-
Press W H and Schechter P L 1974 Astrophys. J. 187 425
-
Retzlaff J, Borgani S, Gottlöber S, Klypin A and Müller V 1998 New Astron. [astro-ph/9709044]
-
Tadros H, Efstathiou G and Dalton G 1998 Mon. Not. R. astr. Soc. 296 995 [astro-ph/9708259]
-
Zeldovich Ya B 1970 Astron. Astrophys. 5 84
-