On accretion flow in Soft X-ray Transients
Abstract
We have analyzed archival Ginga data of a number of Soft X-ray Transient sources and modelled them in an attempt to constrain the geometry and physical properties of accretion. Our models include a self-consistent description of X-ray reprocessing, linking the properties of the reflected continuum and those of the iron fluorescence K line, and allowing for relativistic smearing of spectral features. We derive constraints on the inner extent of the disk and its ionization, assuming a generic geometry of a central X-ray source and an external accretion disk.
Fitting our models to the data we have found that in some sources – GS 1124-68 (Nova Muscae 1991) and GS 2000+25 – the evolution during decline proceeded in qualitative agreement with recent theoretical models based on advection-dominated solutions of accretion flow. These models link the high/soft–low/hard transition with a change of geometry, most importantly, the inner radius of the optically thick disk. Quantitatively, our analysis requires serious revision of the model assumptions. A remarkably exceptional case is that of GS 2023+338, where the source behavior both during outburst and decline was quite different than the other, more “standard” ones.
1. Introduction
Accretion flow around black holes in compact objects (both active galaxies and stellar sources) clearly proceeds through at least two phases: optically thick, cooler plasma producing a soft thermal component, and optically thin, hot plasma where hard X-rays/-rays are produced (see Mushotzky et al. 1993 and Tanaka & Lewin 1995 for reviews).
The geometrical configuration of the two phases is still uncertain. Simple possibilities include pure radial and pure vertical stratification of the flow, but more complicated geometries, with partial overlap are also considered. Localized active regions above the disk, appearing due to e.g. magnetic activity, are also considered (Galeev et al. 1979; Stern et al. 1995).
The commonly made assumption that the observed hard X-ray spectra are due to the inverse Compton process requires an input of soft photons from the optically thick plasma to the optically thin one. The reverse interaction must then also take place: the hard X-rays will illuminate the optically thick plasma (Guilbert & Rees 1988) and they will be reflected and reprocessed. As a result, a continuum spectral component is formed by Compton reflection, with spectral features due to emission/absorption by heavy elements (primarily iron) superimposed on it.
Studying the effects of such reprocessing can be extremely useful as a tool for constraining the spatial distribution of the two phases of accreting plasma. The amplitude of the reflected component constrains the solid angle subtended by the optically thick plasma from the X-ray source. The shape of the reflected continuum below keV, and the energy and strength of iron spectral features around 7 keV give information about ionization state of the reflecting plasma. Possible broadening/smearing of spectral features can constrain the plasma velocity field if it can be distinguished from e.g. broadening due to Comptonization.
Black hole Soft X-ray Transients (SXT) are particularly suited to this kind of analysis. Those are a sub-class of X-ray binaries that undergo occasional, dramatic outbursts. During the subsequent decline phase the mass accretion rate, which is thought to be the most important parameter, decreases roughly exponentially, with a typical e-folding time scale of days. During the decline they go through a sequence of well defined states characterized by distinct spectral and timing properties (review in Tanaka & Shibazaki 1996).
2. Data
For our analysis we use archival Ginga data of a number of SXT. The data combine broad band (1 to 20–30 keV) with moderate spectral resolution (18% at 6 keV), very good statistics due to large effective area of the LAC detector () and systematic uncertainties of the instrument below 1%. Background subtraction can pose a problem for bright sources, due to the contamination of the background monitors by source counts. We have developed a method to estimate the background, described in some detail in Życki et al. (1998b).
3. Models

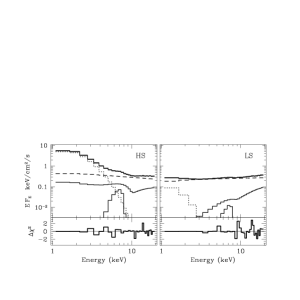
Our model of X-ray reprocessing, described in details in Życki et al. (1998b), self-consistently combines the model for Compton–reflected continuum and Monte Carlo computations of the iron K line. The main model parameter is the ionization parameter, , where is the illuminating flux and electron density. The amplitude of the component is expressed as a solid angle of the reflector, normalized to , . The effects of relativistic smearing are computed convolving the total reprocessed spectrum with relativistic line profiles implemented in XSPEC as the “diskline” model. The main parameter here is the inner disk radius in units of , assuming a fixed illumination emissivity (we assume ). Figure 1. shows typical model spectra.
4. Results
4.1. Low/hard state
The results are shown in Table 1. The reprocessed component is significantly present in the spectra. Its amplitude is significantly smaller than 1, typical values being 0.3 – 0.7. It is rather weakly ionized, corresponding to mean ionization level of iron FeXVII i.e. only M-shell electrons removed. Relativistic smearing of the reprocessed component is significant in some of the spectra, and is consistent with decreasing in time, as the sources progressed through the decline phase. Even at the beginning of decline in GS 2023+338 the smearing is less than expected from a disk extending down to the last stable orbit at , typical values being (see Figure 2. and Życki et al. 1997), although is compatible with in Nova Muscae (Życki et al. 1998a).
| sp. st. | Source | obs. date | /dof | ||||
| LS | GS 1124 | 23/07/91 | 15.3/24 | ||||
| LS | GS 2023 | 19/06/89 | 23.1/23 | ||||
| LS | GS 2000 | 16/12/88 | – | 20/24 | |||
| HS | GS 1124 | 18/05/91 | 13.5/22 | ||||
| HS | GS 2000 | 18/10/88 | 15/21 | ||||
| VHS | GS 1124 | 11/01/91 | 26.6/31 | ||||
| VHS(?) | GS 2023 | 30/05/89 | 25.7/27 |
4.2. High/soft state
In the high state spectra the major difference in the reprocessed component is its strong ionization (Table 1.). Dominant iron ions are usually He- and H-like ones. Consequently, the K line and absorption edges are much stronger in the composite spectra. The amplitude is also larger, close to 1. Relativistic smearing is significant, but the values of differ between different objects. The fact that, for GS 2000+25, (which is not expected given the assumed i.e. without the boundary condition term; Shakura & Sunyaev 1973) may suggest that an additional broadening of that component (e.g. due to Comptonization) takes place.
We find that the soft component of the continuum spectrum cannot be described by either pure black body or multi-temperature (disk) blackbody spectrum. Additional power law tail is required, which can be modelled as additional Comptonization of a (disk) black body. This differs from results of Ebisawa et al. (1994) who were able to fit the disk blackbody to the spectra but they were using the smeared edge model with a narrow gaussian to model the iron spectral features, rather than a reprocessing model.
4.3. Very high state
Nova Muscae showed an example of Very High State spectrum at the peak of its outburst (Jan–Feb 1991). On 11th Jan the soft continuum component again cannot be modelled as a (disk) blackbody, so we assume a Comptonized blackbody instead (Figure 3., middle panel). The presence of the reprocessed component is then again highly statistically significant although its amplitude is not well constrained from above, in particular if radial distribution of ionization is allowed for. The reflection is strongly ionized and smeared, similarly to high state spectra (Table 1.). Thus although the overall spectrum is dominated by the hard power law () as in LS, the properties of both the soft component and the reprocessing are similar to HS, so the suggested histeretic behavior of SXT (Miyamoto et al. 1995) does not seem to be complete.
5. The exceptional case of GS 2023+338

GS 2023+338 was clearly an unusual source, showing fast and chaotic flux and spectral variability, and no clear soft, thermal component even when its luminosity was very high (Tanaka & Lewin 1995).
The spectrum of GS 2023+338 at the peak of its outburst was rather unusual: it can be described by an optically thick comptonization of a disk blackbody radiation of rather high temperature, keV in a rather cool plasma cloud, keV, . Comparison with spectra of Nova Muscae at a similar luminosity level (Figure 3.) suggests that the actual mass accretion rate in GS 2023 might have been super-Eddington. The hypothesis that the observed emission is a (quasi-thermal) disk radiation is not however easily compatible with the presence of spectral features due to highly ionized iron, since in such a geometry disk irradiation is rather ineffective.
The short time-scale (few sec) flux and spectral variability can be attributed to strong and rapidly variable photo–electric absorption. During one the episodes of such strong absorption on 30th May, the source spectrum is consistent with a presence of a soft thermal component of temperature keV, and a steep power law tail, . Such spectra are typically observed in high/soft states of GBH (Figure 4.; Życki et al. 1998c).
During its decline from outburst the source showed a fairly regular, exponential decline of the luminosity ( days) with again rapid variability due to photo-electric absorption superimposed on it. The amplitude of the reprocessed component decreases with time, in rough correlation with decreasing level of relativistic smearing, i.e. the behavior is consistent with increasing. However, the power law spectral index remains practically constant, in sharp contrast to the behavior of GS 1124-68, GS 2000+25 and GX 339 (Życki et al. 1998b).

6. Discussion
The results presented in previous Sections clearly suggest that the geometry of accretion and the physical state of reprocessing material change as sources make transition between hard and soft states. The most significant changes to the reprocessing are those of ionization of the reflector and the amplitude of reflection. In the low/hard state the solid angle of the reprocessor from the X-ray source is smaller and the reprocessor is colder than in the high/soft state. The amount of relativistic smearing does not show clear, statistically significant changes between the transitions, but is consistent with increasing as the amplitude decreases.
We can compare the above results with predictions of models proposed for the spectral transitions.
The observed changes are qualitatively expected in the models of Mineshige (1996) and Esin et al. (1997). These models assume predominantly radial stratification of the flow, with optically thick disk extending only outside certain transition radius. The central, hot solution derives from advection dominated accretion flow solutions although when applied to typical low state, it has radiative efficiency of . The transition radius (which can be identified with our ) has to decrease with increasing to explain softer spectra when sources are brighter, and this also explains larger amplitude of the reprocessed component and its strong ionization in high state. The behavior of we find from relativistic smearing is also consistent with that prediction. Thermal radiation emitted by the disk can by Comptonized by hot upper layer of the disk, giving rise to the observed steep power law tail.
Quantitatively, however, the values of we derive are rather smaller than those postulated by Esin et al. In particular, in the low state we derive , while they assume . Esin et al. (1998) argue that the smaller values are still compatible with their model but this claim has not been verified by actual data modelling.
Relatively small values of we derive indicate that there must exist significant overlap between the central hot X-ray source and external cool disk i.e. the hot source has to extend much further out than : otherwise the energy release within the source would be much too small to account for the overall energetics and spectral shape (Gierliński et al. 1997; review in Poutanen 1998). Perhaps the hot plasma forms a corona at large distances. The transition between the disk and the corona at large distances could result from e.g. the thermal instability of X-ray irradiated plasma, as considered by Witt et al. (1997).
An alternative geometry was proposed by Di Matteo et al. (1998). They suggest that magnetic flares above the disk produce the hard X-ray radiation, the disk itself always extends to the last stable orbit, and the hard/low – soft/high transition is due to changes in characteristic height of the flares. In order to account for harder spectra in the low state they postulate that the flares are higher above the disk in this state. This however does not naturally explain why the reflection amplitude is smaller in the hard state unless the flares are strongly concentrated towards the inner edge of the disk, so a significant fraction of photons is lost within the central hole. An alternative explanation, that the inner disk is strongly ionized and so the iron spectral features are weak, does not seem to be supported by data analysis, at least in Cyg X-1 (Done & Życki 1998).
7. References
Di Matteo T. et al. 1998, MNRAS, submitted (astro-ph/9805345)
Done C., Życki P. T. 1998, MNRAS, submitted
Ebisawa K. et al. 1994, PASJ 46, 375
Esin A. A., McClintock J. E., Narayan R. 1997, ApJ 489, 865
Esin A. A., Narayan R., Cui W., Grove J. E., Zhang S.-N. 1998, ApJ 505, 854
Galeev A. A., Rosner R., Vaiana G. S. 1979, ApJ 229, 318
Gierliński M. et al. 1997, MNRAS 288, 958
Guilbert P. W., Rees M. J. 1988, MNRAS 233, 475
Mineshige S. 1996, PASJ 48, 93
Miyamoto S. et al. 1995, ApJ 442, L13
Mushotzky R. F., Done C., Pounds K. A. 1993, ARA&A 31, 717
Poutanen J. 1998, in Theory of Black Hole Accretion Discs, eds. M. A. Abramowicz, G. Björnsson, J. E. Pringle (CUP, Cambridge) (astro-ph/9805025)
Shakura N. I., Sunyaev R. A. 1973, A&A 24, 337
Stern B. E. et al. 1995, ApJ 449, L13
Tanaka Y., Lewin W. H. G. 1995, in X–Ray Binaries, eds. W. H. G. Lewin, J. van Paradijs, E. van den Heuvel, (CUP, Cambridge)
Tanaka Y., Shibazaki N. 1996, ARA&A 34, 607
Witt H. J., Czerny B., Życki P. T. 1997, MNRAS 288, 848
Życki P. T., Done C., Smith D. A. 1997, ApJ 488, L113
Życki P. T., Done C., Smith D. A. 1998a, ApJ 496, L25
Życki P. T., Done C., Smith D. A. 1998b, MNRAS, submitted (astro-ph/9811106)
Życki P. T., Done C., Smith D. A. 1998c, in preparation