Testing the FR I/BL Lac unifying model with HST observations
Abstract
Hubble Space Telescope (HST) observations provide a novel way of testing unified models for FR I radio sources and BL Lac objects. The detection of extended dust discs in some radio galaxies provides information on their jet orientation. Given this, the strength of the compact nuclear sources of FR I and BL Lacs can be compared with model predictions.
As a pilot project towards using HST information in testing unified models, we selected five radio galaxies which show extended nuclear discs in the HST images. The relative orientation of the projected radio-jets and of the extended nuclear discs indicates that they are not perpendicular, as the simplest geometrical model would suggest, but that they form an angle of with the symmetry axis of the disc: a significant change of orientation occurs between the innermost AGN structure and the kpc-scale. Nevertheless, the discs appear to be useful indicators of the radio source’s orientation since the angles formed by the disc axis and the jet with the line of sight differ by only .
At the center of each disc an unresolved nuclear source is present. We compared its luminosity with the optical core luminosity of BL Lacs selected for having similar host galaxy magnitude and extended radio luminosity. The BL Lac cores are between and times brighter than the corresponding radio galaxies ones.
The FR I/BL Lac core luminosity ratio shows a suggestive correlation with the orientation of the radio galaxies with respect to the line of sight. The behavior of this ratio is quantitatively consistent with a scenario in which the emission in the FR I and BL Lac is dominated by the beamed radiation from a relativistic jet with Doppler factor , thus supporting the basic features of the proposed unification schemes.
Several observational tests, based on the method proposed here, can strengthen our conclusions and improve the statistical significance of the findings presented.
keywords:
galaxies:active - jets - nuclei - photometry - BL Lacertae objects:general1 Introduction
Unification schemes focus on the essence of Active Galactic Nuclei (AGN), by separating physical properties from geometrical/orientational effects. In fact, if anisotropic emission occurs, intrinsically identical sources observed at different orientations manifest different properties.
The most promising unifying model for weak radio–loud AGN identifies low luminosity Fanaroff–Riley (1974), FR I radio sources as the parent population of BL Lac objects. The non–thermal continuum emission of BL Lacs would be in fact dominated by beaming effects, resulting from the observation of plasma moving at relativistic speed at a small angle with respect to its direction of motion (Blandford & Rees 1978). FR I radio galaxies would then represent the mis-oriented counterparts of BL Lacs (e.g. Urry & Padovani 1995 for a recent review).
Circumstantial evidence for this unification model includes the power and morphology of the extended (supposedly unbeamed) radio emission of BL Lacs (e.g. Antonucci & Ulvestad 1985, Murphy et al. 1993, Kollgaard et al. 1992) and the properties of their host galaxies (e.g. Ulrich 1989; Abraham, McHardy & Crawford 1991; Stickel et al. 1991, 1993; Falomo et al. 1997) which are similar to those of FR I. Furthermore, the quantitative agreement among degrees of beaming (angles and velocities) required by different observational properties (e.g. Ghisellini et al. 1993) and the comparison of number densities and luminosity functions of the parent and beamed populations in different bands (e.g. Padovani & Urry 1990, 1991; Urry, Padovani & Stickel 1991; Celotti et al. 1993), are basically consistent with the proposed scheme.
In this framework, we expect non-thermal emission from the jet, although not amplified or even de-amplified, to be present also in FR I. In the case of the nearest FR I radio source Centaurus A, the estimate of the incident continuum on highly ionized filaments (Morganti et al. 1991, 1992) and the detection of a polarized infrared nuclear component (Bailey et al. 1986), suggest that indeed highly beamed emission might be present in this radio galaxy. However these results do not appear to be conclusive, since both effects can be accounted for without requiring non–thermal collimated emission (Sutherland, Bicknell & Dopita 1993, Schreier et al. 1996, Packham et al. 1996).
Thanks to HST data, it is now possible, for the first time, to usefully compare the FR I nuclear emission with that observed in BL Lacs, taking also into account their orientation. Depending on the jet speed and direction with respect to the line of sight, the FR I intensity is expected to be orders of magnitude weaker than in a corresponding BL Lac object. While at ground based resolution such a weak nuclear non-thermal component would be totally swamped by the stellar emission of the host galaxy, the high spatial resolution of HST allows us to detect point sources at the center of a typical radio galaxy as faint as V 25 mag.
At the same time, the HST observations have revealed the presence of extended nuclear discs in several radio galaxies (Jaffe et al. 1993; De Koff et al. 1995; De Juan, Colina & Golombek 1996). These structures have been naturally identified with the reservoir of material which will ultimately accrete into the central black hole (e.g. Jaffe et al. 1993). Although the precise relationship between the symmetry axis of these discs and that of the sub-parsec scale accretion discs is not yet established, they can represent indicators for the orientation of the central engine. By combining the information on the relative intensity and orientations of the nuclear component of the parent and beamed objects, it is possible to test its consistency with the considered unifying scheme.
And this is the aim of this paper. As a pilot project, we selected five radio galaxies which show extended nuclear discs in the HST images and we then compare the intensity of the optical and radio nuclear emission of the sample of 5 FR I radio galaxies with those observed in the corresponding BL Lacs, where the latter ones have been selected on the basis of extended/unbeamed properties similar to their putative parent galaxy.
The description of the HST data for the FR I radio galaxies is the subject of Section 2, while in Section 3 we discuss the geometrical disc properties of the extended nuclear discs and their relationship with the orientation of the central sources. In Sections 4 and 5 we give a detailed description of the comparison between radio galaxies and BL Lacs and in Section 6 we present the results. A discussion of the findings together with our conclusions and future prospects are presented in Section 7.
2 HST observations
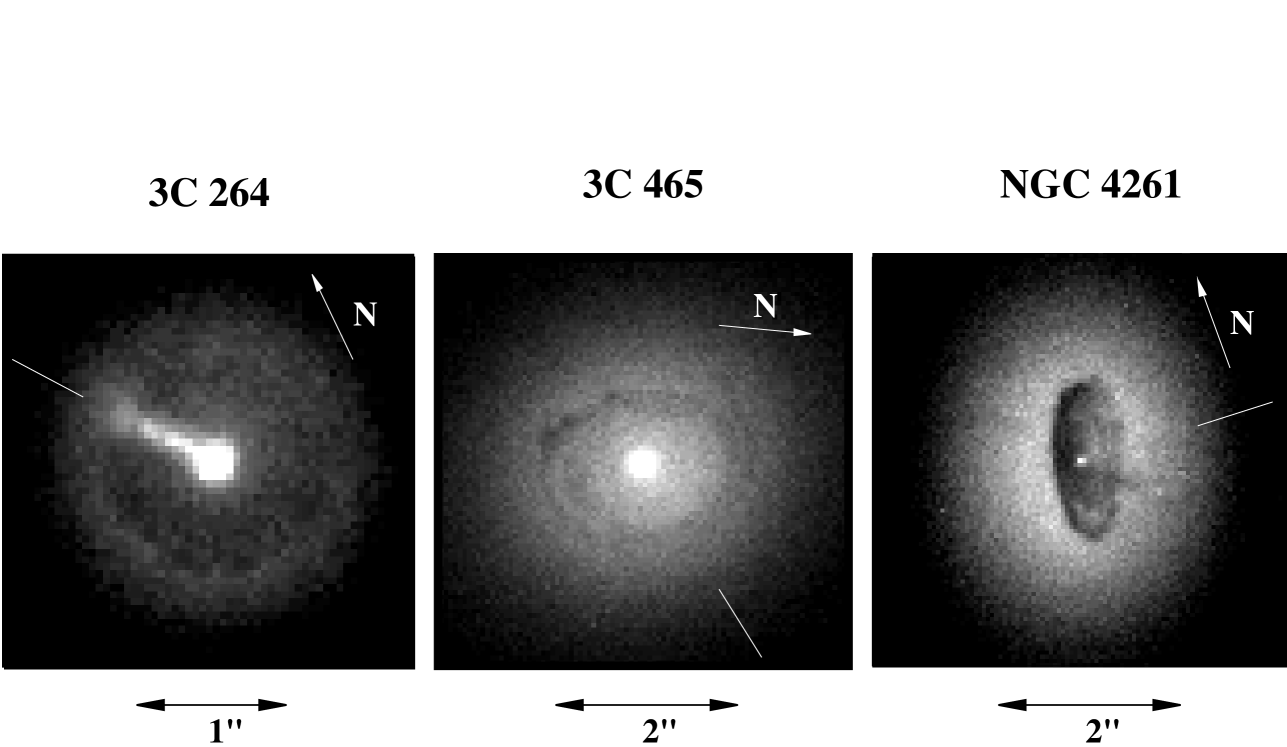
We select five FR I radio galaxies in which archival HST images (available up to May 1997) revealed the presence of an extended nuclear disc, namely 3C 31, 3C 264, 3C 465, NGC 4261 and NGC 7052. The images for these objects were taken using the Wide Field and Planetary Camera 2 (see Table 1 for a log of the observations). The pixel size of the Planetary Camera is 0′′.0455 and the 800 800 pixels cover a field of view of . Observations were obtained in either a medium or broad-band filter for each source. For 3C 31 and 3C 465 narrow-band images centered on the redshifted H emission are also available.
The data were processed through the PODPS (Post Observation Data Processing System) pipeline for bias removal and flat fielding (Burrows et al. 1995). Individual exposures in each filter were combined to remove cosmic rays events. The final images are presented in Fig. 1.
![[Uncaptioned image]](/html/astro-ph/9811407/assets/x1.png)
| Name | Date | Filter | Range (Å) | texp (s) |
|---|---|---|---|---|
| 3C 264 | 24/12/94 | F702W | 6000–8000 | 280 |
| 3C 31 | 21/01/95 | F702W | 6000–8000 | 280 |
| 01/09/95 | FR680N | 6960–7050 | 600 | |
| 3C 465 | 23/01/95 | F702W | 6000–8000 | 280 |
| 23/08/95 | F675N | 6700–6770 | 600 | |
| NGC 4261 | 13/12/94 | F547M | 5200–5800 | 800 |
| NGC 7052 | 23/06/95 | F814W | 7000–9000 | 1400 |
At the center of each disc the HST images reveal the presence of a compact nuclear source. In three cases (3C 264, 3C 31 and 3C 465) this component is sufficiently bright, allowing us to derive its brightness profile. From this we measure FWHM ranging from 0′′.06 to 0′′.07, i.e. unresolved with the HST resolution at 7020 Å. The upper limit to the physical size of these structures, about one half of the resolution, is 10 – 15 pc (cosmological parameters km s-1 Mpc-1 and have been adopted throughout the paper).
Flux densities of these central sources are obtained with aperture photometry and by adopting the internal WFPC2 flux calibration, which is accurate to better than 5 per cent. The dominant photometric error is the determination of the background in regions of varying absorption and steep brightness gradients, particularly for the faintest nuclei, which results in a typical uncertainty of 20 per cent.
The narrow-band observations of 3C 31 and 3C 465 are used to remove the line contamination from the most prominent emission lines included in the spectral range covered by the broad-band filter, i.e. H and [N II]. For 3C 31 the line emission contributes for 45 per cent to the total measured flux density, while for 3C 465 it accounts for only 20 per cent. The luminosities corresponding to these corrected flux densities are given in column 5 of Table 2.
Line contamination is not expected to be significant for NGC 4261, observed with the F547M filter, which covers a relatively line-free spectral region (5200 - 5800 Å). However, this is not the case for 3C 264 and NGC 7052 which were observed in the spectral range 6000 - 8000 Å and 7000 - 9000 Å , respectively.
| Name | MR | Log Pext | Log Lo | Log Lr | |
|---|---|---|---|---|---|
| (1) | (2) | (3) | (4) | (5) | (6) |
| 3C 264 | 0.0216 | -22.70 | 25.21 | 37.96 | 23.26 |
| 3C 31 | 0.0168 | -22.79 | 25.11 | 36.78 | 22.89 |
| 3C 465 | 0.0291 | -23.32 | 25.90 | 37.36 | 23.66 |
| NGC 4261 | 0.0074 | -22.92 | 24.29 | 35.34 | 22.28 |
| NGC 7052 | 0.0164 | -22.10 | 23.59 | 36.19 | 22.39 |
Data for the five selected FR I radio galaxies: (1) name, (2) redshift, (3) galaxy R-magnitude, (4) extended radio power at 5 GHz in W Hz-1, (5) optical core luminosity in erg s-1 Å-1 at the wavelength indicated in Table 1, (6) radio core luminosity in erg s-1 Hz-1 at 5 GHz.
3 The relationship between discs and jets orientation
Let us now explore the geometrical relationship between disc and radio axes and, in particular, whether and at which level of accuracy the disc orientation can be considered an indicator of the jet direction.
In the simplest scenario radio jets are ejected along the rotation axis of the central black hole, which also defines the orientation of the inner accretion disc. If the extended nuclear discs are coplanar with the inner ones, we expect the radio jets to be perpendicular to these structures. When projected onto the plane of the sky, the radio jets axis should therefore appear perpendicular to the (apparent) major axis and parallel to the minor axis of the disc.
In order to test this hypothesis, we have derived, from high resolution radio maps published in the literature (Morganti et al. 1987; Morganti et al. 1993; Lara et al. 1997) the position angle of the radio jets for the five radio galaxies. There are no significant differences between the directions of pc and kpc jets (e.g. Jones & Wehrle 1997). In Table 5 we report the position angles relative to the brighter radio jet.
| Name | Main Jet | Disc major | Disc incl. | Disc minor | Jet/Disc | Minimum | Median | Median orientation |
|---|---|---|---|---|---|---|---|---|
| P.A.() | axis () | () | axis | offset | disc warp | disc warp | difference () | |
| 3C 264 | 27 | -100* | 15 | -10 | 37 | 9 | 31 (10-61) | 20 |
| 3C 31 | -20 | -45 | 35 | 45 | -65 | 31 | 44 (32-63) | 24 |
| 3C 465 | -54 | 10 | 45 | -80 | 26 | 17 | 24 (19-38) | 16 |
| NGC 4261 | -92 | -15 | 65 | -105 | 13 | 10 | 15 (12-25) | 10 |
| NGC 7052 | -165 | 65 | 72 | 155 | 40 | 36 | 39 (36-47) | 19 |
* The major axis of 3C 264 has been determined as the separating line between the less and more obscured halves of the disc.
The inclination of the extended nuclear discs with respect to the line of sight is estimated by fitting ellipses to the sharp edges of these absorption structures and with the reasonable assumption that they are intrinsically circular. The typical uncertainty in the estimated disc ellipticity is 5 per cent. In Table 5 we report the derived discs inclinations (i.e. the angle between the disc symmetry axis and the line of sight) with relative errors. From the same fitting procedure we also derived the position angle of the disc axis.
Before exploring in more detail the geometrical relationship between discs and jets, it is useful to derive some additional information on the geometry of the system. In all of our five cases, one half of the disc produces a stronger obscuration than the other. This can be used to identify which side of the disc itself is closer to us. Furthermore, one radio jet is brighter than its opposite, an asymmetry which is commonly ascribed to relativistic motion of the jet plasma at kpc scale. Thus, for both the disc and the radio axes, we have no 180 degree position angle ambiguity.
Inspection of Table 5 shows that the main jet and disc axes are highly correlated. This result, that the radio jet is always on the near side of the dusty disc, is important since it adds even more weight to the relativistic beaming explanation for the brightness and depolarization asymmetries of radio jets (Garrington et al 1988; Morganti et al, 1997). It also suggests a causal connection between the dusty disc, which may possibly have an origin external to the galaxy, and the properties of the AGN. The radio jets, though reasonably well aligned with the disc minor axes, are not exactly parallel. This implies that either/both the overall AGN disc structure warps significantly from the central to the extended accretion discs or/and that the observed radio jets are not perpendicular the nuclear discs.
Two questions therefore arise at this stage: first of all, what is the amplitude of the disc warps? and secondly, are the extended discs useful indicators of the jet orientation? We will address these questions in the next two sections.
3.1 Discs warp angles
If jets and discs orientations were completely unrelated we could expect a random distribution of the differences in the projected directions of main jet and disc minor axis, spanning between -180 and 180 degrees. Conversely, the measured offsets are found only between -65 and +37. This indicates that discs and jets, although not perpendicular, bear some geometrical relationship, which we will quantify in the following.
It is possible to directly estimate the minimum intrinsic angle between the disc and the jet axis which can produce the observed disc/jet offset. This, which might be interpreted as the minimum amplitude of the disc warp from sub–pc to kpc scale, can be expressed as
where is the orientation of the jet with respect to the line of sight which minimizes and is given by
, , and are the (observed/projected) angles defining the disc and jet orientation (see Table 5).
Adopting the values reported in Table 5, the minimum warp angles range between 9 and 36 degrees. Note that the warp angle can be smaller than the observed projected offset. For example, in the case of 3C 31 an offset of 65 degrees can be reproduced with a warp angle of only 30 degrees.
Furthermore, only a range of can produce any observed offset. As an example, in Fig. 2 we show the expected offset in the case of 3C 465 () for different values of the warp angles. An offset of 26∘ can be observed only for . More precisely, for each object it is possible to estimate the probability of observing the measured disc/jet offset for different values of the warp angle, as shown in Fig. 3. This probability is highly peaked at warp angles close to their minimum value and then quickly decreases for larger angles. The central values and the ranges of angles including 68% of these probability distributions are reported in Table 5.
It is important to notice that, from a simply geometrical point of view, large warp angles are favored because of their statistical weight (which is proportional to sin). Conversely, our analysis points towards small values of degrees, clearly indicating that discs and jets are not randomly oriented one with respect to the other. The inclination of discs can therefore be reasonably used to estimate the jet orientation. The accuracy of this estimate is discussed in the next session.


3.2 Jet and disc orientation
The angle which is relevant, in order to establish how good an indicator of orientation the extended nuclear discs are, is the difference in the orientations, , of the jet axis and the disc axis with respect to the line of sight. We estimated the median value of (reported in the last column of Table 5) by adopting the probability distribution of warp angles derived in the previous section. We can conclude that the disc orientation can be used of indicator of the jet orientation with an uncertainty of 15 degrees. Furthermore, since there is no bias favoring a particular range of orientation, this uncertainty can be simply considered as a random error in the determination of the radio axis.
4 Comparison between radio galaxies and BL Lacs
4.1 The selection of the beamed counterparts
Within the considered unification model, FR I and BL Lacs are essentially a single class of objects only viewed at different orientations. But, when comparing randomly selected pairs of objects, a large scatter in their properties is obviously expected. However, correlations between the core radio power and both the extended radio and host galaxy luminosities have been established (Giovannini et al. 1988). This implies than when we select FR I and BL Lacs with identical isotropic quantities, their beamed properties will be distributed within approximately the scatter in the above correlation.
Data relative to the isotropic properties for the five FR I radio galaxies are reported in Table 2. Absolute R magnitudes (aperture corrected, Sandage 1972), are derived from Sandage (1973) and Impey & Gregorini (1993). Radio luminosities are estimated from flux densities given by Impey & Gregorini (1993) and Kühr et al. (1981).
We then select a sample of BL Lacs for which both extended radio and galaxy optical flux densities are reported in the literature. The data are summarized in Table 3. Magnitudes of the BL Lacs host galaxies are taken from Wurtz et al. (1996). They have been scaled according to our assumptions on the cosmological parameters and Pence’s (1976) K-correction has been applied.111Given the level of accuracy reached in the comparison of BL Lacs and FR I properties, we can neglect here the small correction between the r-Gunn (used by Wurtz et al. 1996) and the standard R Johnson filters. The galaxy magnitudes span between and . Luminosities of the extended radio emission at 5 GHz were taken from Perlman & Stocke (1993) and have been similarly corrected, adopting an energy spectral index of 0.7. They cover the range W Hz-1.
In order to select the BL Lacs objects to compare with each of the FR I galaxies, we plot all the sources (FR I and BL Lacs) in the host galaxy R–magnitude (MR) vs extended radio power at 5 GHz (Pext) plane (Fig. 4). Here the FR I radio galaxies are all located in the portion of the MR – Pext plane covered by BL Lac objects. The BL Lac counterparts of each radio galaxy have been then chosen among those which differ by less than a factor of two in both radio and optical luminosities. For 3C 264 and 3C 465, which lie in a relatively more sparsely populated region of the plane, we allow for the slightly larger difference in MR of 1 mag. We thus identified between 2 and 5 beamed counterpart for each ‘parent’ radio galaxy. The complete list of all the ‘relative’ BL Lacs (with their optical and radio core properties) is reported in Table 3.

| Name | MR | Log Pext | Log Lo | Log Lr | |
|---|---|---|---|---|---|
| (1) | (2) | (3) | (4) | (5) | (6) |
| 0548–322 (R) | 0.069 | -22.44 | 24.32 | 40.33 | 23.90 |
| 0851+202 (R) | 0.306 | -21.40 | 23.74 | 41.83 | 26.84 |
| 1400+162 (R) | 0.244 | -22.33 | 25.87 | 40.98 | 25.56 |
| 1407+599 (X) | 0.495 | -23.52 | 25.11 | 40.43 | 25.08 |
| 1443+638 (X) | 0.299 | -22.64 | 24.19 | 40.01 | 24.32 |
| 1458+228 (X) | 0.235 | -22.53 | 23.57 | 40.91 | 24.63 |
| 1538+149 (R) | 0.605 | -23.93 | 26.17 | 41.38 | 27.27 |
| 1552+203 (X) | 0.222 | -23.41 | 24.25 | 40.50 | 24.62 |
| 2007+777 (R) | 0.342 | -22.60 | 24.92 | 41.33 | 26.53 |
| 2143+070 (X) | 0.237 | -22.71 | 24.59 | 40.43 | 24.82 |
| 2200+420 (R) | 0.069 | -22.83 | 23.58 | 40.57 | 25.68 |
| 2254+074 (R) | 0.190 | -23.26 | 24.13 | 40.87 | 25.61 |
Data relative to BL Lacs: (1) name and selection band (R=radio selected, X=X–ray selected, from Perlman & Stocke 1993), (2) redshift, (3) galaxy magnitude R, (4) extended radio power at 5 GHz in W Hz-1, (5) optical core luminosity in erg s-1 Å-1 at 5000 Å, (6) radio core luminosity in erg s-1 Hz-1 at 5 GHz.
4.2 Comparison of the core properties
The core optical luminosities for the radio galaxies are estimated from HST observations (see Section 2), while the radio core luminosities are from VLBI observations by Giovannini, Feretti & Comoretto (1990) and Jones et al. (1981). Radio and optical core emission of the selected BL Lac objects were taken from Giommi & Padovani (1993). For BL Lacs, energy spectral indices in the radio and in the optical bands were adopted to estimate the K–correction ().
The list of the FR I–BL Lac pairs, together with the results of the comparisons for each of the association FR I–BL Lac, are presented in Table 4. In particular, in columns 3 and 4 the ratios of the parent FR I and BL Lac core luminosities , are reported, for the optical and radio bands, respectively. These measured ratios (which can be as large as ) clearly indicate that any optical non-thermal emission in FR I radio galaxies is dramatically fainter than in BL Lacs with similar extended properties. There appears to be no relation between the estimated and the spectral type/selection band of the considered BL Lac objects.
| Name | Relatives | Ro | Rr |
|---|---|---|---|
| (1) | (2) | (3) | (4) |
| 3C 264 | 1407+599 | 2.23e2 | 6.61e1 |
| 2007+777 | 1.77e3 | 1.86e3 | |
| 3C 31 | 1407+599 | 3.54e3 | 1.55e2 |
| 2007+777 | 2.81e4 | 4.37e3 | |
| 3C 465 | 1400+162 | 1.12e3 | 7.94e1 |
| 1538+149 | 1.12e4 | 4.07e3 | |
| NGC 4261 | 0548–322 | 9.27e4 | 4.17e1 |
| 1443+638 | 4.64e4 | 1.10e2 | |
| 1552+203 | 1.47e5 | 2.19e2 | |
| 2143+070 | 1.17e5 | 3.47e2 | |
| 2254+074 | 2.92e5 | 2.14e3 | |
| NGC 7052 | 0851+202 | 2.99e5 | 2.82e4 |
| 1458+228 | 3.59e4 | 1.74e2 | |
| 2200+420 | 1.64e4 | 1.95e3 |
Summary of the results, for each FR I – BL Lac pair: (1) Radio galaxy; (2) associated BL Lacs; (3) BL Lac vs FR I core luminosity ratio in the optical band; (4) core radio luminosity ratio.
Furthermore, we stress that these are only lower limits to the actual ratios of BL Lac/FR I jet luminosities, since an unknown fraction of the optical emission associated to the central regions of radio galaxies can be either stellar in origin and/or might be produced by the innermost regions of an accretion disc.
The ratios at radio wavelengths are significantly smaller (with typical values – 104) than those measured in the optical band, and also in this case they must be considered lower limits as there might be radio emission not associated with the relativistic jet.
¿From Table 4 we can also see that the spread of the optical ratios for a given FR I radio galaxy is about an order of magnitude. This scatter includes and is larger than the dispersion in the correlation between core and extended radio-luminosity in radio–galaxies, which shows a logarithmic scatter of only (Giovannini et al. 1988).
5 Evidence for beamed emission in FR I
On the basis of the results of the Section 3, it becomes meaningful to examine whether there is any dependence of the estimated luminosity ratios, and , on the orientation of the radio galaxy. Either the presence or absence of a trend would be an important clue for the understanding of the amount of beamed vs isotropic radiation fields in radio galaxies.
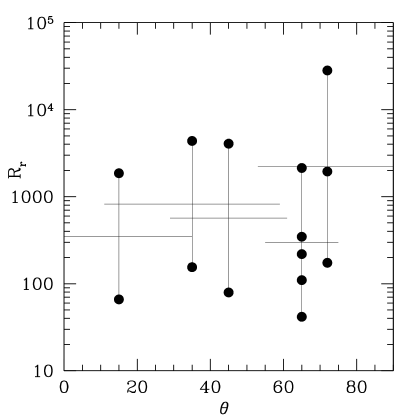
In Fig. 5 we show the ratio between the optical core luminosity of the five FR I radio galaxies and the corresponding BL Lacs as a function of the radio galaxy inclination angle. The vertical bar for each radio galaxy has been obtained by considering all the BL Lacs–FR I pairs, as indication of the scatter. The horizontal bars represent instead the median disc warp angles, to take into account the uncertainty on the relative orientation of the jet axis and the line of sight discussed in Section 4. Similarly, we estimated the ratio between the core luminosity of radio galaxies and BL Lacs at radio wavelengths, (see Fig. 6 and Table 4).
Figure 5 shows that there is a large increase of the optical ratio with the inclination of the nuclear discs. The trend is qualitatively in the sense expected if the emission from the central nuclei observed in the radio galaxies is the less beamed counterpart of the jet emission observed in BL Lacs. Unfortunately, with only 5 objects, the correlation is not formally statistically significant and the results are only suggestive. In addition to beaming, other explanations of the trend seen in Fig 5. are possible and these are discussed in the next section.

5.1 Alternative explanations for a vs dependence
There are at least two other possible interpretations of a dependence of on other than beamed synchrotron emission: we might be observing the anisotropic emission from a thick accretion disc; alternatively, a central source, such as a stellar cusp, might be obscured by an optically and geometrically thick absorbing structure whose optical depth varies with . In both cases the correlation between and would be due to a dependence of the observed core luminosity on inclination which is not to ascribe to beaming.
Let us consider these alternative explanations in turn. It has been shown that thick accretion discs might produce a significantly anisotropic radiation field (e.g. Sikora 1981, Madau 1988). However, although this anisotropy can be large at UV and X-ray wavelengths, a face-on disc would appear only a few times brighter than an edge-on disc in the optical band. Given the much larger dependence on inclination we observe this effect does not appear to dominate in this context.
We now examine the expected trend of to explore the possible role of absorption. At least two cases are viable and the central source might be: i) of fixed luminosity; ii) a fixed fraction of the total starlight, . Almost independently of the adopted normalization a trend of luminosity with inclination is present (see Fig. 7) with an decrease in of approximately two orders of magnitude from low to high values of .
If absorption is the main cause of this behavior, the optical depth of any obscuring material must increase with . Adopting a standard gas-to-dust ratio, for which the extinction is related to the neutral hydrogen column density by , the trend of luminosity with inclination is reproduced if increases, approximately linearly, by cm-2 from to . While this value can be quantitatively plausible, it is very tightly constrained: an increase in by only an extra factor of 3 would lead to a much stronger dependence of , with a change by six orders of magnitudes between the low and high inclination galaxies. On the other hand, a decrease of the same factor in would not produce a significant change of with . We think that the required quite well defined dependence of the absorbing material optical depth on its geometrical structure in different objects which are also of different radio and optical luminosities, makes this interpretation unappealing.
We conclude that both of these alternatives appear implausible and that the observed anisotropy is most likely produced by the effect of Doppler beaming.

6 Discussion
| Name | Relatives | Error | |||
|---|---|---|---|---|---|
| (1) | (2) | (3) | (4) | (5) | (6) |
| 3C 264 | 1407+599 | 15 | 8.7 (6.5) | 10.3 (6.7) | 40 % |
| 2007+777 | 12.8 (9.0) | 24.9 (12.9) | |||
| 3C 31 | 1407+599 | 35 | 6.3(4.4) | 5.7(3.6) | 30 % |
| 2007+777 | 9.1 (5.8) | 13.4 (6.6) | |||
| 3C 465 | 1400+162 | 45 | 4.1 (3.0) | 3.8 (2.8) | 25 % |
| 1538+149 | 6.1 (4.1) | 10.4 (5.1) | |||
| NGC 4261 | 0548–322 | 65 | 6.5 (4.0) | 2.3 (1.7) | 15 % |
| 1443+638 | 5.8 (3.6) | 3.0 (2.0) | |||
| 1552+203 | 7.0 (4.2) | 3.6 (2.3) | |||
| 2143+070 | 6.7 (4.1) | 4.0 (2.4) | |||
| 2254+074 | 7.8 (4.6) | 6.3 (3.3) | |||
| NGC 7052 | 0851+202 | 72 | 7.0 (4.1) | 10.6 (4.5) | 15 % |
| 1458+228 | 4.9 (3.2) | 3.0 (2.0) | |||
| 2200+420 | 4.3 (2.9) | 5.5 (2.9) |
Summary of the results, for each FR I – BL Lac pair: (1) Radio galaxy; (2) associated BL Lacs; (3) radio galaxy orientation, as inferred from the nuclear disc with respect to the line of sight (in degrees); estimated in the optical (4) and radio (5) bands; (6) relative error on deriving from uncertainties on . The values of Lorentz factors reported in the Table refer to the cases and , the latter shown in parenthesis (see Section 6.1 for the definition of ).
It is now possible to compare, at least at the zero order, the quantitative predictions of the beaming model concerning the dependence of luminosity on the inclination angle. In the simplest scenario, the beamed emission originates from a relativistic jet described by a single Lorentz factor , which, by hypothesis, is the same for BL Lac and FR I. In this case the ratio between a BL Lacs and its parent radio galaxy luminosity is given by
where the angles are measured with respect to the beaming (jet) axis, is the spectral index in the considered energy band and the plasma velocity. The exponent depends on the geometrical and temporal structure of the emitting plasma, e.g. whether the emission region can be better approximated as a continuous jet or an individual ’blob’ of plasma; plausibly in a realistic situation .
The comparison with the observed values of reported in Table 4, therefore allows to estimate the minimum jet Lorentz factors consistent with dimming the jet emission (assumed to be produced by a BL Lac observed along the jet axis) by the observed ratio when moving from to . The resulting lower limits on the jet Lorentz factor, for each FR I–BL Lac pair, in the two energy bands and for different values of are reported in Table 5 and shown in Fig. 8.

The formal estimate of a lower limit for corresponds to . However, it is unlikely that all BL Lacs jets are so closely aligned with the line of sight. We therefore self-consistently estimated a less conservative , considering as the average angle within the 1/ beaming cone. The resulting are 15 - 25 per cent larger than .
Several sources of error are involved in the calculation of , but they are all dominated by the uncertainties in the jet orientation and by any intrinsic scatter between isotropic and beamed properties. The former ones translate into an error of per cent on , increasing for smaller , while the values of obtained by using different associated BL Lacs for the same radio galaxy are spread by less than 25 per cent. Photometric errors are negligible in view both of the variability of BL Lacs and the weak dependence of on the derived ratios .
In Fig. 9 we plot the expected curves for different values of , within the estimated range. Clearly, these curves completely bracket the measured luminosity ratios, and follow the general trend.
The dependence of (i.e. the luminosity ratio in the radio band) on , presented in Fig. 6, is considerably weaker than in the optical band with an overall increase of about one order of magnitude. This might be in part expected in the beaming scenario, since the lower spectral index of radio () with respect to optical () emission makes the anisotropy less pronounced at these wavelengths. However, the limits on derived from the radio ratios are overall comparable with, although with a larger spread than, the optical ones.
The main point we would like to stress is that the derived Lorentz factors, both in the optical and radio bands, are completely consistent with those derived by other means (as superluminal velocities, synchrotron self–Compton model, core dominance parameters, number densities estimates, e.g. Ghisellini et al. 1993). Note that the main constraint on the values of derived above is imposed by the large range spanned by , independently of the particular shape of the dependence.
We conclude that our results can be well accounted for if the optical nuclear sources seen in these FR I radio-galaxies are indeed the un-beamed counterpart of BL Lac objects, in agreement with the basic features of the unifying scheme for these two classes of objects.

7 Summary and future prospects
Two are the main results of this paper. We examined the relative orientation of the observed nuclear dusty disc structures observed with HST for five radio galaxies with that of their (VLA) radio jets. We find that, though these two axis are not parallel, they are clearly related. The most probable intrinsic disalignement/warp is between 20 and 40 degrees. Interestingly, this quite consistent with theoretical expectations (Natarajan & Pringle 1998). However, this misalignment translates into an angular difference between the directions of the line of sight with respect to the jet and disc axis of only 10 - 20∘. The nuclear discs are therefore reasonable indicators of the symmetry axis of the system.
The second finding we would like to emphasize is that the optical radio-galaxies cores are between and times fainter than those seen in BL Lac objects with matching extended properties and that this ratio shows a suggestive dependence on the radio galaxy orientation. Although extinction might reasonably play a role, we think it is rather implausible that this is the main cause of this trend. Conversely, this dependence can then be ascribed to the presence of an anisotropic nuclear component in radio galaxies, the counterpart of the beamed emission which dominates in BL Lac objects. Indeed, these results can be successfully accounted for if we are seeing emission from a relativistic jet with a Lorentz factor . These values are consistent with those derived from both the ratios of the nuclear radio luminosities and the quantitative predictions of the BL Lac/ FR I unified model.
Several observational tests can be performed to confirm and strengthen our findings.
First of all, the prevalence of non-thermal over stellar emission in the central regions of FR I can be confirmed through a spectral analysis, e.g. by measuring the amplitude of the 4000 Å calcium II break. Moreover, the central sources seen in the FR I are expected to show the typical behavior of the BL Lac cores. i.e. large polarization and fast variability.
Clearly, information on a much larger sample of FR I radio sources will be very helpful to improve the statistical significance of our results since many more FR I–BL Lac pairs can then be formed. It will also be possible to compare the nuclear luminosity of radio galaxies with similar extended properties but with different orientation. This will allow a much better determination of the curve and provide further clues on the FR I and BL Lacs relationship. In particular the luminosity ratio dependence on angle can set upper limits to any isotropic/non–beamed emission, a critical and unknown parameter when comparing the luminosity functions of FR I and BL Lacs (Padovani & Urry 1991; Urry, Padovani & Stickel 1991; Celotti et al. 1993). In fact, the presence of any isotropic emission would cause to saturate to a constant when this component becomes dominant at large . Furthermore, the dependence would constraint the height of any obscuring torus, since it will enable us to establish the largest value of for which we have a direct view of the FR I nuclei. Finally, the comparison with a large enough (and complete) sample of FR I can be performed statistically even without indication on the orientation of the individual objects. The distribution of the observed ratios, rather than individual values, would then be compared with that expected from a random orientation of radio galaxies in the sky. This improvement in the sample of FR I is expected to be produced by the snapshot survey of B2 radio galaxies currently under execution with HST.
Acknowledgments
We thank the referee, Ian Browne, for his criticisms and suggestions, which greatly helped improving the paper. Both ACs acknowledge the Italian MURST for financial support.
References
Abraham R.G., McHardy I.M., Crawford C.S., 1991, MNRAS, 252, 482
Antonucci R.R.J., Ulvestad J.S., 1985, ApJ, 294, 158
Bailey J., Sparks W.B., Hough J.H., Axon D.J., 1986, Nat, 322, 150
Blandford R.D., Rees M.J., 1978, in BL Lac Objects, A.N. Wolfe, ed., Univ. Pitt. Press (Pittsburgh), p. 328
Burrows C.J., et al., 1995, WFPC2 Instrument Handbook, Version 3.0, Space Telescope Science Institute
Celotti A., Maraschi L., Ghisellini G., Caccianiga A., Maccacaro T., 1993, ApJ, 416, 118
De Juan L., Colina L., Golombek D., 1996, A&A, 305 776
De Koff S., Baum S., Sparks W.B., Biretta J., Golombek D., Macchetto F.D., McCarthy P.J., Miley G.K., 1995, BAAS, 187, 1202
Falomo R., Urry C.M., Pesce J.E., Scarpa R., Giavalisco M., Treves A., 1997, ApJ, 476, 113
Fanaroff B.L., Riley J.M., 1974, MNRAS, 167, 31p
Garrington S.T., Leahy J.P., Conway R.G., Laing R.A., 1988, Nat, 331, 147
Ghisellini G., Maraschi L., 1989, ApJ, 340, 181
Ghisellini G., Padovani P., Celotti A., Maraschi L., 1993, ApJ, 407, 65
Giommi P., Padovani P., 1993, MNRAS, 277, 1477
Giovannini G., Feretti L., Comoretto G., 1990, ApJ, 358, 159
Giovannini G., Feretti L., Gregorini L., Parma P., 1988, A&A, 199, 73
Impey C., Gregorini L., 1993, AJ, 105, 853
Jaffe W., Ford H.C., Ferrarese L., Van den Bosch F., O’Connell R.,W. 1993, Nat, 364, 213
Jones D.L., Sramek R.A., Terzian Y., 1981, ApJ, 246, 28
Jones D.L., Wehrle, A.E., 1997, ApJ, 484, 186
Kollgaard R.I., Wardle J.F.C., Roberts D.H., Gabuzda D.C., 1992, AJ, 104, 1687
Kühr H., Witzel A., Pauliny-Toth I.I.K, Nauber U., 1981, A&AS, 45, 367
Lara, L., Cotton W.D., Feretti, L., Giovannini, G., Venturi, T., Marcaide, J.M., 1997, ApJ, 474, L179
Madau P., 1988, ApJ, 327, 116
Morganti R., Fanti, C., Fanti, R., Parma, P., de Ruiter, H.R., 1987, A&A, 183, 203
Morganti R., Fosbury R.A.E., Hook R.N., Robinson A., Tsvetanov Z., 1992, MNRAS, 256, 1
Morganti R., Robinson A., Fosbury R.A.E., di Serego Alighieri S., Tadhunter C.N., Malin D.F., Hook R.N., 1991, MNRAS, 249, 91
Morganti, R., Killeen, N.E.B., Tadhunter, C.N., 1993, MNRAS, 263, 1023
Morganti R., Parma, P., Capetti, A., Fanti, R., de Ruiter, H.R., 1997, A&A 326, 919
Murphy D.W., Browne I.W., Perley R.A., 1993, MNRAS, 264, 298
Natarajan P., Pringle, J.E., 1998, ApJL, in press
Packham C., Hough J.H., Efstathiou A., Chrysostomou A., Bailey J.A., Axon D.J., Ward M.J., 1996, MNRAS, 278, 406
Padovani P., Urry C.M., 1990, ApJ, 356, 75
Padovani P., Urry C.M., 1991, ApJ, 368, 373
Pence W., 1976, ApJ, 203, 39
Perlman E.S. , Stocke J.T., 1993, ApJ, 406, 430
Sandage A., 1972, ApJ, 178, 1
Sandage A., 1973, ApJ, 183, 711
Schreier E.J., Capetti A., Macchetto F.D., Sparks W.B., Ford H.J., 1996, ApJ, 459, 535
Sikora M., 1981, MNRAS, 196, 257
Stickel M., Kühr H., 1993, A&A, 98, 39
Stickel M., Padovani P., Urry C.M., Fried J.W., Kühr H., 1991, ApJ, 374, 431
Sutherland, R.S., Bicknell, G.V., Dopita, M.A., 1993, ApJ, 414, 506
Ulrich M-H, 1989, in BL Lac Objects: 10 years after, Maraschi L., Maccacaro T. & Ulrich M.-H. eds, Springer-Verlag, p. 45
Urry C.M., Padovani P., 1995, PASP, 107, 803
Urry C.M., Padovani P., Stickel M., 1991, ApJ, 382, 501
Wurtz R., Stocke J.T., Yee H.K.C., 1996, ApJS, 103, 109