Distant clusters of galaxies in the ESO Imaging Survey
Abstract
ABSTRACT. The results of a search for distant clusters of galaxies performed using the I-band data obtained by the ESO Imaging Survey (EIS) are presented. Cluster candidates are identified using a matched filter algorithm, that provides not only an objective detection criterion, but also the means to estimate the cluster redshift and richness. A preliminary sample of distant clusters has been obtained, containing 252 cluster candidates with estimated redshift in the interval (median redshift ) over an area of approximately 14 square degrees. The adopted selection criteria for the inclusion of cluster candidates in this sample has been in general conservative, as the primary concern has been the reliability of the candidates rather than the completeness of the sample.
ABSTRACT. The results of a search for distant clusters of galaxies performed using the I-band data obtained by the ESO Imaging Survey (EIS) are presented. Cluster candidates are identified using a matched filter algorithm, that provides not only an objective detection criterion, but also the means to estimate the cluster redshift and richness. A preliminary sample of distant clusters has been obtained, containing 252 cluster candidates with estimated redshift in the interval (median redshift ) over an area of approximately 14 square degrees. The adopted selection criteria for the inclusion of cluster candidates in this sample has been in general conservative, as the primary concern has been the reliability of the candidates rather than the completeness of the sample.
1 Introduction
One of the primary goals of the recently completed ESO Imaging Survey (EIS; Renzini & da Costa 1997) has been the preparation of a sample of optically-selected clusters of galaxies over an extended redshift baseline. Such a sample could be used for many different studies, ranging from the evolution of the galaxy population in clusters, to the evolution of the abundance of galaxy clusters, a powerful discriminant of cosmological models. Until recently, only a handful of clusters were known at redshifts ; visual searches for high redshift clusters were conducted by Gunn et al. (1986) and Couch et al. (1991), but their samples are severely incomplete beyond ; at higher redshifts targeted observations in fields containing known radio-galaxies and QSOs have produced a handful of cluster identifications (e.g. Dickinson 1995; Francis et al. 1996; Pascarelle et al. 1996; Deltorn et al. 1997). The first objective search for distant clusters was conducted by Postman et al. (1996; hereafter P96) using the 5-m telescope of the Palomar Observatory. In that survey 10 of the 79 cluster candidates that were identified have estimated redshift . Further evidence for the existence of clusters at high redshift has been obtained from X-ray (e.g. Gioia & Luppino 1994; Henry et al. 1997; Rosati et al. 1998), optical (e.g. Connolly et al. 1996; Zaritsky et al. 1997) and infrared (Stanford et al. 1997) searches. However, the existing samples are still small, and their selection effects largely unknown. In this paper we briefly describe a large sample of optically-selected cluster candidates, obtained applying a matched filter algorithm to the catalogs of objects detected on single 150 sec. EIS V- and I-band exposures. The sample includes 252 candidates, identified over an area of 14.4 deg2. Further details on this work can be found in Olsen et al. (1998a,b; hereafter O98a,b), and in Scodeggio et al. (1998).
2 Observations and Data Reduction
EIS observations were conducted using the EMMI camera on the ESO 3.5m New Technology Telescope. Observations were carried out over four pre-selected patches of the sky, spanning a wide range in right ascension, and cover a total area of 17 deg2 in I-band. Only small sub-areas were covered also by V- and B-band observations (3.5 and 1.5 deg2, respectively). For this reason we concentrate here our attention mostly on the I-band data. EIS observations consist of a sequence of 150 sec exposures; however each point of a patch is imaged twice, for a total integration time of 300 sec, using two frames shifted by half an EMMI-frame both in right ascension and declination. The easiest way of visualizing the global geometry of this mosaic of frames is to consider two independent sets of them, forming contiguous grids (in the following referred to as odd and even frames), superposed and shifted by half a frame both in right ascension and declination. The data reduction is carried out automatically through the EIS pipeline, described in Nonino et al. (1998; hereafter N98). This pipeline produces both coadded images and fully corrected single frames, using the astrometric and photometric solution derived from the global data reduction process. The astrometric solution is found relative to the USNO-A1 catalog. The internal accuracy of the astrometric solution is better than 0.03 arcsec, although the absolute calibration suffers from the random and systematic errors of the reference catalog. The photometric calibration is done in a two step procedure, first bringing all the frames to a common photometric zero-point, taking advantage of the overlap between the frames, then making an absolute calibration based on external data. The internal accuracy of the photometric calibration is mag. The current absolute calibration uncertainty is mag. Further details can be found in N98. Among the various object catalogs produced by the EIS pipeline, we use in this work the so-called odd and even catalogs, which are single entry catalogs listing all objects detected in the odd or even frames. The reliability and completeness of these catalogs are discussed in N98. Based on that analysis, it was estimated that the single-frame odd and even I-band catalogs are 95% complete to ; with a differential completeness at this magnitude of 80% (the V-band ones have similar completeness to ). At this limiting magnitude the contamination from spurious objects is estimated to be approximately 20%, with total contamination of the catalog of 5%. The object classification was shown to be reliable to . Below that limit the object classification is not reliable any more, and all detected objects fainter than are taken to be galaxies. Already at this magnitude the fraction of stars is found to be 25% of the total number of objects, and taking into account the steep rise of the galaxy number counts faintward than , the contamination of the galaxy catalog by stars can be considered negligible.
3 Cluster detection
Candidate galaxy clusters are objectively identified using a procedure based on the matched filter algorithm described by P96. The details of this EIS cluster finding pipeline are discussed by O98a, and only a brief summary is given here. The filter is derived from an approximate maximum likelihood estimator, obtained from a model of the spatial and luminosity distribution of galaxies within a cluster. This distribution, as a function of magnitude and radial distance from the cluster center , is represented as
| (1) |
where is the cluster projected radial profile, is the cluster luminosity function, and measures the cluster richness. The parameters and are the apparent magnitude corresponding to the characteristic luminosity of the cluster galaxies, and the projected value of the cluster characteristic scale length. From this model one can represent the observed galaxy distribution as where is the background number counts, and write an approximate likelihood of having a cluster at a given position as
| (2) |
The functional dependence of on the redshift-dependent parameters and provides the mean of estimating the cluster candidate redshift. By evaluating the function for each element of a two-dimensional array a filtered image of the input galaxy catalog is created (the “Likelihood map”). This procedure is repeated a number of times, with the parameters and tuned for different cluster redshift values. Significant peaks in the likelihood maps are identified independently in each map, using SExtractor. A minimum size criterion is adopted, whereby only peaks where more than pixels have values above the detection threshold are considered as potential detections. The value of is set to correspond to the area of a circle with radius , while the value of is kept constant at 2. These parameters were optimized using simulations described in O98a. The lists of peaks identified in the various Likelihood maps are then compared, and peaks detected at more than one filter redshift are associated on the basis of positional coincidence. From this association, likelihood versus curves are created, and the redshift and richness estimates for each candidate are derived locating the peak of the corresponding likelihood versus curve. Two richness parameters are derived for each candidate, following P96. The first is obtained from the matched filter procedure itself, using the parameter , while a second independent richness estimate is obtained to reproduce more closely the conventional Abell richness parameter. The final cluster candidates sample is then composed of those objects that persist for at least three filter redshift tunings, and that have a richness estimate . Simulations have shown these to be quite conservative selection criteria, as noise peaks are most likely to be associated with small values of the inferred richness, and to be detected only for one (or few) particular redshift tuning of the matched filter (see O98a for details).
4 Results

The total sample of EIS cluster candidates, detected in I-band over the four EIS patches, consists of 252 objects with estimated redshift in the range . The total area over which the search was carried out is of 14.4 deg2, and therefore the inferred density of candidates is of 17.5 deg-2. This value is slightly larger than that found by P96, and could result from the somewhat deeper magnitude limit achieved by EIS, with respect to the P96 data. The distribution of estimated redshifts for this total sample is shown in Figure 1. The median estimated redshift is , and coincides with the value for the P96 sample. Note however that the two redshift distributions differ somewhat, with the EIS sample showing a more extended tail beyond (upper panel of Figure 2). A similar comparison can be carried out also with the sample of X-ray selected clusters of Rosati et al. (1998). Using the cluster confirmations and redshift measurements obtained up to December 1997 for that sample (Rosati, private communication), we can see once again a general agreement (the median redshift of the clusters in the Rosati et al. sample is also ), and a more extended tail of high redshift objects in the EIS sample (lower panel of Figure 2). Spectroscopic observations are now necessary to determine what fraction of EIS cluster candidates are real objects, and to determine more accurately their redshift. For applications of cosmological interest, it is also interesting to consider the distribution of rich (and presumably most massive) clusters. This is presented in Figure 1 as the shaded portion of the histogram. From this distribution it is possible to deduce that the comoving density of cluster candidates is changing only very mildly as a function of redshift.

Over an area of 2 square deg. the search for cluster candidates has been performed also using V-band data, independently from the search in I-band. Afterwards the V and I-band candidate lists were compared, and V-band detections associated to I-band ones. Of the 19 candidates with estimated redshift , 17 ( 90%) are also detected in V-band; for those with estimated redshift , only 4 out of 16 are detected in V-band. This result is not surprising since the V-band data are relatively shallower the I-band ones. Using the rule of thumb that the data should reach at least one magnitude fainter than at the redshift of a given cluster to allow for its detection, one can translate the galaxy catalog limiting magnitudes adopted in the cluster search into limiting redshifts for cluster detection. The I-band limit of then translates into a limiting redshift between (no-evolution model) and (passive evolution model), whereas the V-band limit of translates into a limiting redshift between (no-evolution) and (passive evolution).
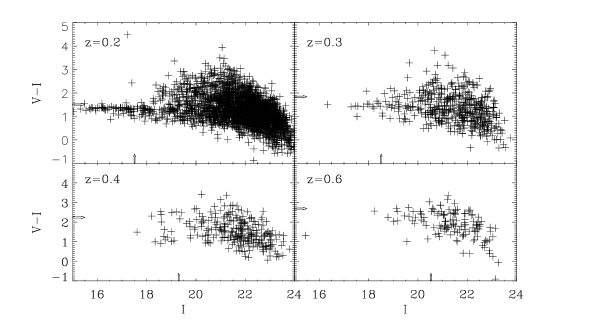
The availability of data in two passbands provides also an alternative way of confirming cluster candidates and their estimated redshifts, based on the detection of the sequence of cluster early-type galaxies in a Color-Magnitude (CM) diagram. In order to investigate this possibility, a V-I vs I CM diagram was produced for each cluster candidate, showing all galaxies within a radius of 0.75 h-1 Mpc (H0 = 75 km s-1/Mpc) from the nominal cluster center. Fig. 3 shows four examples of such diagrams, illustrating cases with estimated redshift in the range . At low redshift, the sequence of early-type galaxies is clearly visible, but at the evidence for a CM relation is, in most cases, less compelling. In total, out of 35 cluster candidates in the region of overlap of the V- and I-band images, there are 19 with evidence for a CM relation, with estimated redshifts extending out to . Furthermore, the redshift estimates based on the color and on the matched filter seem to agree, in most cases, within 0.1. However, there are at least four cases where there is a strong suggestion that the matched filter has overestimated the redshift.
Acknowledgments
Our most sincere thanks to the whole EIS team, for the great effort and dedication shown in carrying out the survey over a very tight timetable, without sacrifice of its overall quality and value.
References
- [1] Connolly A.J., et al., 1996, ApJ, 473, L67
- [2] Couch W.J., Ellis R.S., MacLaren I., Malin D.F., 1991, MNRAS, 249, 606
- [3] Deltorn J.-M., Le Fevre O., Crampton D., Dickinson M., 1997, ApJ, 483, L21
- [4] Dickinson M., 1995, in Buzzoni A., Renzini A., Serrano A., eds., Fresh Views of Elliptical Galaxies. ASP, San Francisco, p. 283
- [5] Francis P.J., et al., 1996, ApJ, 457, 490
- [6] Gioia I.M., Luppino G.A., 1994, ApJS, 94, 583
- [7] Gunn J.E., Hoessel J.G., Oke J.B., 1986, ApJ, 306, 30
- [8] Henry J.P., et al., 1997, AJ, 114, 1293
- [9] Nonino M., et al., 1998, submitted to A&A; astro-ph/9803336 (N98)
- [10] Olsen L.F., et al., 1998a, submitted to A&A; astro-ph/9803338 (O98a)
- [11] Olsen L.F., et al., 1998b, submitted to A&A; astro-ph/9807156 (O98b)
- [12] Pascarelle S.M., at al., 1996, ApJ, 456, L21
- [13] Postman M., et al., 1996, AJ, 111, 615 (P96)
- [14] Renzini A., da Costa L. N. 1997, Messenger 87, 23
- [15] Rosati P., Della Ceca R., Norman C., Giacconi R., 1998, ApJ, 492, L21
- [16] Scodeggio M., et al., 1998, submitted to A&A; astro-ph/9807336
- [17] Stanford S.A., et al., 1997, AJ, 114, 2232
- [18] Zaritsky D., Nelson A.E., Dalcanton J.J., Gonzalez A.H., 1997, ApJ, 480, L91