Nuclear Disks of Gas and Dust in Early Type Galaxies and the Hunt for Massive Black Holes: Hubble Space Telescope Observations of NGC 6251
Abstract
We discuss Hubble Space Telescope optical images and spectra of NGC 6251, a giant E2 galaxy and powerful radio source at a distance of 106 Mpc (for km s-1 Mpc-1). The galaxy is known to host a very well defined dust disk (O’Neil et al. 1994); the exceptional resolution of our and images allows a detailed study of the disk structure. Furthermore, narrow band images centered on the H+[NII] emission lines, reveal the presence of ionized gas in the inner 0′′.3 of the disk. We used the HST/Faint Object Spectrograph with the 0′′.09 aperture to study the velocity structure of the disk. Dynamical models were constructed for two extreme (in terms of central concentration) analytical representations of the stellar surface brightness profile, from which the mass density and corresponding rotational velocity are derived assuming a constant masstolight ratio M⊙/L⊙. For both representations of the stellar component, the models show that the gas is in Keplerian motion around a central mass M⊙, and that the contribution of radial flows to the velocity field is negligible.
1 Introduction
Nuclear disks of ionized gas, a few pc in diameter, provide an efficient and powerful alternative to stellar dynamical studies in constraining the central potential of early type galaxies (Ferrarese, Ford & Jaffe 1996, Harms et al. 1994, Bower et al. 1998, van der Marel & van den Bosch 1998). Since the seminal papers by Sargent et al. (1978) and Young et al. (1978) dynamical modeling of the stellar kinematics has been the tool of choice in searching for massive black holes (BH). However, the method is complicated since the stellar orbital structure is unknown and difficult to derive from the observational data (intensity, velocity and velocity dispersion) because of lineofsight projections. More seriously, the well known degeneracy between velocity anisotropy and varying masstolight ratio undermines the hope of nailing down the presence of a massive BH, at least in the brightest, pressure supported ellipticals (Sargent et al. 1978, Richstone & Tremaine 1985, van der Marel 1994).
A new chapter in the search for massive BH was written when the Wide Field and Planetary Camera on board the Hubble Space Telescope (HST) was pointed at NGC 4261, a giant elliptical galaxy and powerful radio source 30 Mpc away. The images showed a regular, flattened disk of dust and gas, 230 pc in diameter (Jaffe et al. 1993): even if the gas can easily be perturbed by non gravitational forces (shocks, radiation pressure, winds, magnetic fields; Fillmore, Boronson & Dressler 1986), the regular and flattened structure of the disk implies that circular motion in the central potential of the galaxy should dominate the velocity field. Compared to the stellar system, the disk is twodimensional, so that complications connected to the projection of the orbital velocities are not an issue, nor are ambiguities associated with the presence of velocity anisotropy. Finally, the bright emission lines from the disk are easy to detect.
These promises were fulfilled when Harms et al. (1994) used the HST/Faint Object Spectrograph (FOS) to find that the disk of ionized gas discovered in the Virgo cD galaxy M87 (Ford et al. 1994), is indeed in Keplerian motion around a M⊙ central mass, a result confirmed by later observations with higher spatial resolution (Macchetto et al. 1997, Ford & Tsvetanov 1998). The astonishingly high of M⊙/L⊙ within the inner 6 pc lead Ford & Tsvetanov to conclude that the central mass must be in the form of a BH. Spectroscopic data for NGC 4261 (Ferrarese et al. 1996) also point to a Keplerian velocity field and a M⊙ central mass, likely a BH given the high value of M⊙/L⊙ within 15 pc. Since then, two more BHs have been discovered using HST kinematics of ionized gas disks. Bower et al. (1998) derived a BH mass of M⊙ for NGC 4374, the second brightest radio galaxy in Virgo. Van der Marel & van den Bosch (1998) discovered a M⊙ BH in NGC 7052, an E4 galaxy 59 Mpc away.
This paper discusses HST images and spectra of the giant elliptical NGC 6251, host of one of the most spectacular radio sources in the sky (Waggett, Warner, & Baldwin 1977). At a distance of 106 Mpc (for H0 = 70 km s-1 Mpc-1), this is the farthest galaxy for which the presence of a massive BH has been investigated. O’Neil et al. (1994) discovered a small ( 1′′.4 in diameter) disk of dust in the central region of NGC 6251. Interestingly, NGC 6251 is one of the first galaxies (with M87) for which the presence of a nuclear black hole was claimed, 20 years ago, by Peter Young and his collaborators (Young et al. 1979), based on the steepening of the surface brightness profile towards the center. The study of the kinematics of the ionized gas associated with the dust disk allows us to check the black hole claim.
NGC 6251 is an E2 galaxy with m13.6 mag (RC3, de Vaucouleurs et al. 1991) and a heliocentric velocity km s-1 (from ZCAT, Huchra et al. 1992). Optical and UV images have been obtained by Young et al. (1979), Bender, Doebereiner, & Moellenhoff (1988), Crane et al. (1993), and Crane & Vernet (1997), but it is because of its radio morphology that the galaxy gained immediate popularity. Waggett et al. (1977) identified it as the parent galaxy of one of the largest radio sources in the sky: the radio lobes, which show the marked Sshape geometry expected as the result of precession of the feeding jet, extend for 1∘.2 in the plane of the sky (over 2 Mpc projected). The northwest lobe is connected to the small diameter radio core by a bright, well collimated radio jet extending for 4′.4 (130 kpc). The kpc radio structure was studied by Owen & Laing (1989), Jones et al. (1986), Willis, Wilson, & Strom (1978) and Perley, Bridle, & Willis (1984). A kpcscale counterjet was seen in the VLA maps by Perley et al. (1984), however, a parsec scale counterjet so far has not been detected with the VLBI (Readhead, Cohen, & Blandford 1978, Cohen & Readhead 1979, Jones et al. 1986, Jones & Wehrle 1994). Jones & Wehrle (1994) used this observation to conclude that the jet must lie within 45∘of our line of sight, based on Doppler boosting arguments.
Xray observations are discussed by Worrall & Birkinshaw (1994), Birkinshaw & Worrall (1993) and Turner et al. (1997). The gas in the 0.22.0 keV regime shows a resolved thermal component probably undergoing a cooling flow, plus an unresolved nonthermal component originating from the inner region of the parsec scale radio jet.
This paper is organized as follows: Section 2 deals with the details of the HST/WFPC2 data: planning, acquisition, reduction and a discussion of the images. The spectra are described in §3, where line fitting procedures are applied to derive central velocity, velocity dispersion, line profiles and fluxes from the emission lines. Different models to the velocity pattern of the emission line gas are discussed in §4, and compared in §4.1, where we conclude that the best fitting models imply the presence of a M⊙ central mass, probably a black hole in view of the presence of an active nucleus. Notes on the accretion mechanisms, and the origin and morphology of the dust and gas can be found in the remaining of §5. A summary is drawn in §6.
2 HST/WFPC2 Imaging
2.1 Observations and Data Reduction
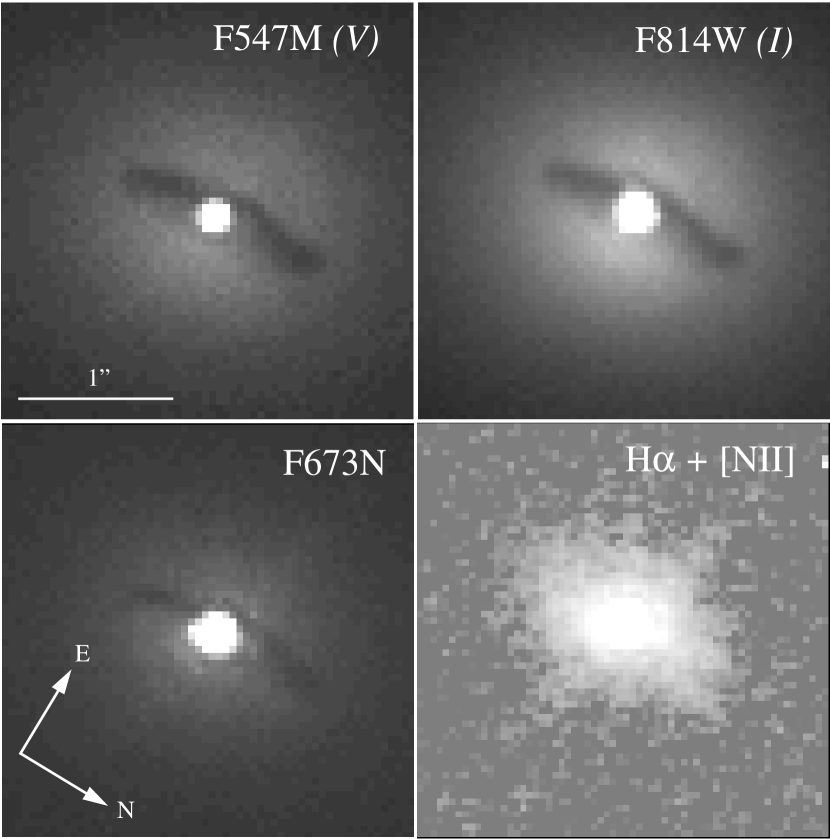
Narrow band and continuum images of NGC 6251 were obtained on 1996 September 13 with the HST/Wide Field and Planetary Camera 2 (WFPC2, Biretta et al. 1996). The F673N filter (central wavelength c=6732 Å, FWHM = 47 Å) was used to map the H+[NII] emission line region, while the F547M (c=5476 Å, = 483 Å) and F814W (c=7921 Å, = 1488 Å) filters covered the emissionline free continuum on both sides of the H+[NII] emission.
The galaxy nucleus was placed on the 800800 pixel Planetary Camera (PC) chip, the highest resolution of the four WFPC2 CCDs: at a 0.046 arcsec/pix scale, each PC pixel covers 24 parsecs at the distance of NGC 6251. The gain and read out noise of the camera are 7 e-/DN and 7 respectively. The total exposure times of the observations are 1400 s in F547M, 1000 s in F814W, and 5700 s in F673N. To facilitate cosmic ray removal, the continuum and narrow band images were broken into two and four consecutive exposures respectively.
Routine calibration was performed by the standard HST pipeline and consisted of correction of small A/D errors, subtraction of a bias level for each chip, subtraction of a superbias frame, subtraction of a dark frame, correction for shutter shading effects, and division by a flat field (see Holtzman et al. 1995a for a detailed discussion). Based on the centroids of fifteen point sources present in the field of view, back to back images taken with the same filter are registered to within 0.02 pixels. In averaging back to back images, pixels deviating more than three times the local sigma calculated from the combined effects of Poisson statistic and read out noise, were identified as cosmic rays, and replaced with the lowest of the input values. Images taken with different filters are shifted by up to one pixel with respect to each other, and were aligned by performing a bilinear interpolation in both x and y directions. The calibrated, combined, and cosmic ray cleaned F547M, F673N and F814W images are shown in Figure 1, and will be discussed in §2.2. The F547M image is also shown in Figure 2.
Photometric calibration was performed as outlined by Holtzman et al. (1995b). F547M and F814W counts were transformed to and magnitudes respectively, and F673N counts to fluxes. The accuracy of the photometric zero points is 0.1 mag in and and 5% in the F673N fluxes. As further processing, we derived the isophotal parameters, the reddening map and the pure emission line map as follows. Isophotal parameters (position angle, center, ellipticity and Fourier coefficients) were derived using the IRAF task ELLIPSE, and are shown in Figure 3. The right ascension, declination and position angle of the isophotes, averaged between 1′′.5 and 4′′, can be found in Table 1. The same table lists the coordinates of the nucleus, calculated as the flux centroid within a three pixel radius aperture. Figure 4 shows the brightness profile and color profile, both integrated along the galaxy isophotes, as a function of the isophotal semimajor axis.
A reddening map was derived from the and images, in the assumption that the reddening law follows Cardelli, Clayton and Mathis (1989), that , and that there is no discontinuity in the (dereddened) color of the stellar population across the boundary of the dust region. Figure 4 shows that the color increases towards the center by about 0.01 mag/arcsec between 2′′ and 6′′. The same trend was assumed within the dusty regions in calculating the reddening map. Finally, since the nucleus and stellar population have different colors, the nucleus was removed prior to calculating the reddening map, as described below. The TinyTim software (Krist 1995) was used to construct theoretical PC PSFs for each filter and with the appropriate amount of telescope jitter (jitter information is recorded by the onboard telemetry and was never larger than 7 mas for our observations). Since the PC PSF is undersampled (the FWHM is of the order 1.5 pixels), the observed count distribution is critically dependent on the PSF center within a pixel. To avoid subpixel interpolation in matching the data, the theoretical TINYTIM PSF was subsampled by a factor ten, matched to the data and then rebinned. This produces fits accurate to 0.1 pixels.
A contour plot of the absorption , assuming that only half of the starlight is attenuated by dust, is overplotted on the F547M image in Figure 5. For a typical dust to gas ratio and dust properties, the average optical extinction in the disk, mag, is in excellent agreement with the neutral hydrogen column density derived by Birkinshaw & Worrall from ROSAT data. The reddening map, adequately scaled to account for differential dust absorption, was used to deredden the F547M, F673N and F814W images. The major and minor axes profiles in the central three arcsec before and after reddening correction are shown in Figure 6.
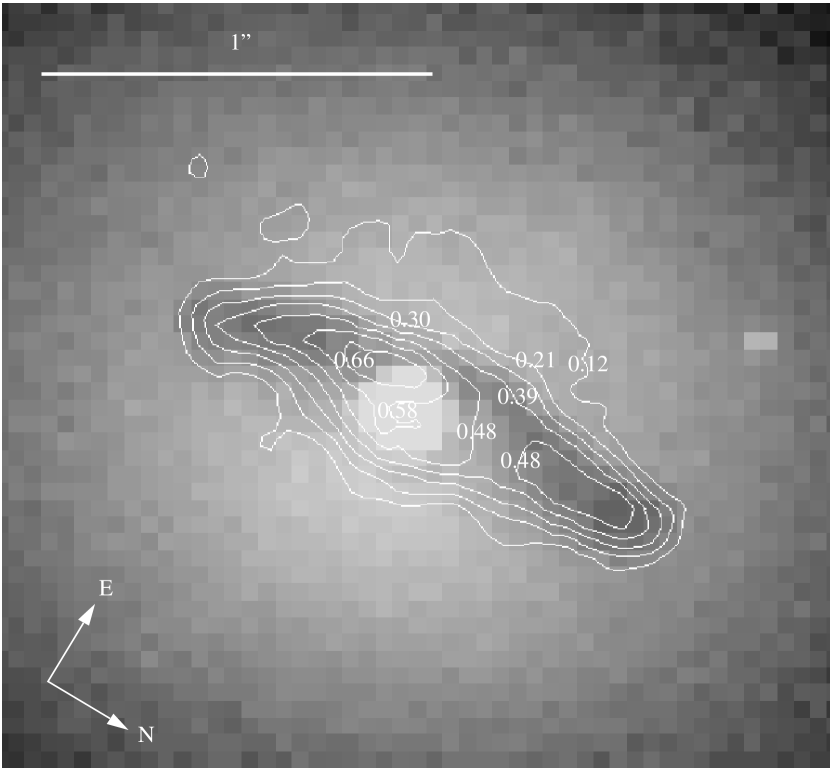
Finally, a map of the line emitting region was obtained. The and extinction corrected images were averaged and scaled so to match the median counts of the onband F673N image in a circular annulus between 1′′.5 and 4′′.0 from the nucleus. The resulting continuum image was then subtracted from the onband image to produce the emission line map shown in Figure 1.
2.2 Description of the WFPC2 Images: Dust and Gas Structure
The most striking feature unveiled by the WFPC2 images shown in Figure 1 is certainly the well defined nuclear dust structure, strongly reminiscent of the dust disk seen in NGC 4261 (Jaffe et al. 1993, Ferrarese, Ford & Jaffe 1996). The major and minor axis of the structure extend for 1′′.43 (730 pc) and 0′′.34 (170 pc) respectively: their ratio implies an angle of 76∘ between the normal to the disk and the line of sight, assuming the dust is distributed in a thin circular disk.
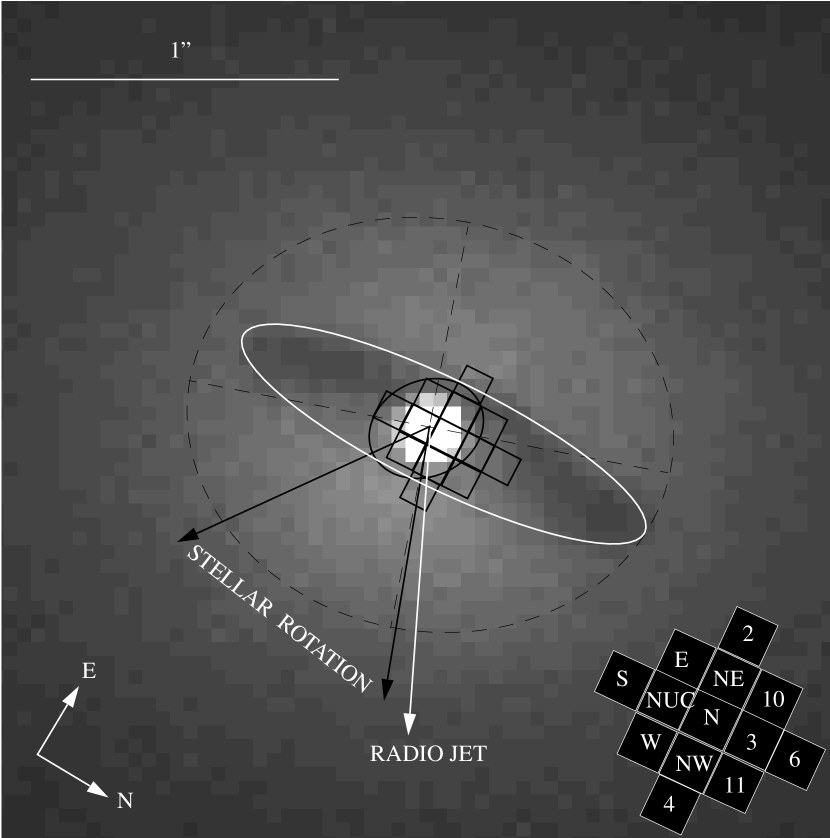
As is the case for the NGC 4261 dust disk, the NGC 6251 disk is not perfectly uniform nor symmetric. This was already noted by Crane and Vernet (1997), who further mention the possibility that the disk is warped. The north tip of the disk bends slightly to the east. The west side is brighter than the east side, which is easily interpreted as an inclination effect: since the line of sight to the far side of the disk encounters more unobstructed stars, that side will appear brighter. Within the errors, the position of the nucleus coincides with the isophotal center of the galaxy and with the radio core as measured by Jones & Wehrle (1994, precessed to J2000), but the disk is shifted slightly to the north with respect to the stellar isophotes. Also, the disk and the galaxy isophotes are not coaxial, and the disk minor axis is not aligned with the parsec scale radio jet. Quantitatively, the misalignment between the major axes of the disk and the stellar isophotes is 16∘.72∘.4, while the minor axis of the disk and the radio jet are misaligned by 23∘.12∘.4. This last observation is of particular interest, since it implies that the jet is not perpendicular to the plane defined by the edge of the disk. If the jet is accelerated and collimated by an accretion disk threaded by a large scale, perpendicular magnetic field (e.g. Blandford 1993), then the non perpendicularity between the jet and the dust disk implies that either the disk is severely warped, or that there is no continuity between the 100pc scale dust disk and the subparsec scale inner accretion disk. Figure 2 shows the best fitting elliptical contour to the edge of the disk, and the directions of the isophotal axes, of the parsec scale radio jet (from Jones et al. 1986, precessed to the epoch of the WFPC2 observations, 1996.7) and of the acceptable range for the stellar rotation axis (from Heckman et al. 1985, precessed to 1996.7). All position angles and coordinates are also summarized in Table 1.
The dust mass in the disk is estimated as where is the surface area of the disk and the visual mass absorption coefficient is mag cm2 g-1 (Sadler & Gerhard 1985). The mean in the disk, mag, corresponds to mag for , giving a total dust mass M⊙. For a Galactic gas to dust ratio, , the total mass in the disk is M⊙.
The nuclear emission, probably of nonthermal origin, is unresolved in all images, while the H+[NII] emitting region (Figure 1) is clearly extended. This is shown in Figures 7a-c, which plot the radial profiles of the nucleus and the ionized gas region (after continuum subtraction, §2.1), compared to the best matching PSF radial profile. The reddeninguncorrected magnitudes of the nucleus are mag and mag. To derive reddening corrected magnitudes, we need to add the foreground (galactic) extinction to the mean internal extinction in the disk ( mag). According to Schlegel et al. (1998) the foreground reddening in the direction of NGC 6251 is mag (note that this agrees with the Burstein & Heiles (1984) value of mag), or mag for . Therefore the total extinction to the nucleus of NGC 6251 is mag, and the unreddened magnitudes of the nucleus are mag and mag. The H+[NII] flux is erg cm-2 s-1, corresponding to a line luminosity of erg s-1 at a distance of 106 Mpc. This is comparable to the line luminosity of the gas disk in NGC 4261 (Ferrarese et al. 1996). It is also typical of AGNs with similar radio luminosity (Baum & Heckman 1989).
3 HST/FOS Spectra
3.1 Observations and Data Reduction
Thirteen spectra covering the central 0′′.3 of NGC 6251 were obtained on 1997 January 11 using the HST/FOS (Keyes et al. 1995). The PAIRB square aperture, with projected dimensions on the sky 0′′.09 0′′.09 (corresponding to parsecs at the distance of NGC 6251), was used to map a 33 grid, including the nucleus and aligned with the major axis of the dust disk (position angle 4∘). Four additional spectra were obtained 0′′.18 on either side of the center of the 33 grid, along the major and minor axes of the dust disk. The position of the apertures with respect to nucleus are shown in Figure 2. The nucleus was acquired through a 4stage peakup (Keyes et al. 1995), using sequentially the 1′′.0PAIR, 0′′.5PAIR, 0′′.25PAIR and 0′′.1PAIR apertures. While the original intent was to place the center of the aperture grid on the nucleus, analysis of the map formed by the peakup steps and dwells shows that the acquisition procedure was only partially successful, and that the center of the grid is offset by 0′′.05 to the north and 0′′.02 to the west with respect to the nucleus, due to malfunctioning of the onboard acquisition software. In the remainder of this paper the aperture positions will be referred to as labeled in Figure 2.
The grating used, G780H, covers the wavelength region between 6270 Å and 8500 Å. A spectral resolution of 4.85 0.02 Å was derived from the average FWHM of sixteen emission lines in seven wavelength calibration spectra taken during the observing sequence. All spectra are quarterstepped, a procedure in which the spectrum is stepped onto the linear array of 512 diodes by onequarter of the diode width (1.43 Å) along the dispersion direction. All exposure times should have been 2050 seconds; in practice, to maximize telescope efficiency, positions 3 and E were exposed for 1950 s, positions N and NUC were exposed for 2060 s and position W for 2460 s.
The spectra were calibrated by the standard HST pipeline as described by Keyes et al. (1995). The calibration includes pairedpulse correction, background and scattered light subtractions, and flat fielding. In order to achieve a higher accuracy in the wavelength scale than allowed by the standard processing, we observed arc lamp spectra either immediately before or after each science spectrum. For each arc lamp spectrum, dispersion coefficients were computed following the procedure outlined by Kriss (1994). The dispersion coefficients assigned to each science spectrum are the mean of the coefficients of the two arc spectra immediately preceding and following it, weighted by the time lapsed between the middle of the science exposure and the arc spectra. According to a convention adopted for the FOS, all wavelengths are vacuum wavelengths.
The largest zero point difference between arc lamp spectra is 0.45 Å, corresponding to 20 km s-1 at 7000 Å. This defines the accuracy of our wavelength scale, and is consistent with the FOS wavelength accuracy limit reported by Keyes et al. (1995). However, there is a 2.3 Å shift between the standard (pipeline processing) wavelength zero point and the average of the zero points derived from our arc lamps. This is likely due to the nonrepeatability in the position of the filtergrating wheel (estimated to be 0.35 diodes, Keyes et al. 1995).
Inverse sensitivity curves are not available for the 0′′.1 aperture, therefore flux calibration is not performed by the pipeline processing. Rough fluxes for the 0′′.1 aperture are obtained by using the inverse sensitivity curve for the 0′′.25 FOS square aperture, multiplied by the ratio of the throughputs of the two apertures (0.47, Keyes et al. 1995). Since this ratio is calculated for point sources, it can be off by as much as a factor (the ratio of the sky projected areas of the two apertures) in the extreme case of a source with uniform surface brightness. In addition, even for point sources, the throughput ratio is strongly dependent (varying by up to 50%) on the centering of the source within the aperture. For these reasons, all absolute fluxes reported in this paper should be used with extreme caution. However, relative fluxes are correct to within a few percent.
3.2 Description of the FOS Spectra: Emission Line Fitting
The HST/FOS spectra described in §3.1 provide an almost complete coverage of the emitting line region shown in Figure 1. The nuclear spectrum is plotted in Figure 8. Emission lines of [OI]6300,6364, H, [NII]6548,6584, [SII]6717,6731 and [OII]7325 are detected. As for NGC 4261 (Ferrarese, Ford, & Jaffe 1996), which also hosts a very well defined dust disk, the [NII]+H complex has broad wings superimposed on narrower lines, and the [NII] lines are strong compared to H. As discussed in more detail in the next section, the heavy blending of the H and [NII] lines and the presence of the broad wings make estimating accurate line fluxes rather difficult. In addition, important diagnostic lines, such as [OIII]5007 and H, fall outside the wavelength coverage of the spectra. However, given the (admittedly not ideal) [SII]6717,6731/H, [OII]7325/H and [NII]6584/H line ratios derived in §3.2.1, the diagnostic plot of Dopita & Southerland (1995) show that NGC 6251 lies near the upper limit of the region defined by LINERS and well outside the region populated by Seyfert galaxies, pointing to shocks as the likely cause of ionization for the gas (Contini 1997, Dopita & Southerland 1995, Allen, Dopita, & Tsvetanov 1998).
The aim of the FOS observations is to obtain a high spatial resolution map of the velocity field in the central region, to constrain the central potential. To achieve this, accurate fitting of the emission lines is necessary. Because of the target miscentering (§3.1) and the rapid decrease in the H+[NII] surface brightness with radius, we cannot successfully measure emission lines from the six apertures which are not adjacent to the nucleus. The [NII]+H complex is detected at 1.5 at positions 2, 10 and 11, and 2 at positions 3 and 4, but due to the low S/N and the low resolution of the spectra, none of the lines can be accurately measured. The spectra at the remaining seven aperture positions which will be used in the dynamical modeling are shown in Figure 9.
3.2.1 Fits to the The Nuclear Spectrum
The line synthesis program SPECFIT (Kriss 1994) is used to fit the spectra. Emission lines are modeled with a Gaussian with four degrees of freedom: flux, centroid, FWHM and a skew parameter. The continuum is approximated with a power law, described by two free parameters (slope and flux at a specified wavelength). Fitting is done interactively via Chisquare minimization using a Marquardt algorithm. In the fit, the ratio of the central wavelengths of lines in doublets ([OI], [NII] and [SII]), is constrained to be equal to the ratio of the corresponding rest vacuum wavelengths. Also, the FWHMs of lines in doublets are set equal. Because of the relative low spectral resolution of our data, the H+[NII] complex is not fully resolved, and in order to constrain the fit, we fixed the redshift and FWHM of the H and [NII] lines to be the same. Because of the limited S/N in the [OI] and [SII] lines, the shape parameter for all lines is set equal to the shape parameter of [NII]6584. Finally, the [NII]6584/[NII]6548 flux ratio is fixed to the theoretical value of three. These constraints bring the number of free parameters for the seven emission lines plus the continuum down from 30 to 15.
Figure 10a shows the best fit to the nuclear spectrum obtained under the assumptions listed above. The broad wings in the [NII]+H complex are not reproduced by the model. To obtain a better fit, we added a broad H component to the model with all four parameters set free, therefore increasing the total number of parameters to 19. The best fit under these conditions is shown in Figure 10b, and is a clear improvement over our previous attempt. Quantitatively, the reduced for the first model (without broad H) is 1.92, while the introduction of the broad H line brings down to 1.41. The parameters of the fit are listed in Table 2. Within the errors, all narrow lines have the same redshift, which is however km s-1 lower than the systemic velocity of the galaxy, km s-1 (Huchra et al. 1992). The broad H line is very asymmetric, with a steep blue side and a more gradually declining and more extended red side. In contrast, no significant asymmetry is seen in the narrow emission lines. The peak of the broad H line is blueshifted by 870 km s-1 () with respect to the narrow H, however, because of the marked asymmetry, the midpoint of the line at half intensity is redshifted by 850 km s-1 from the frame of the narrow lines.
There are several possibilities for the origin of the broad H component. Chen & Halpern (1989) and Chen, Halpern, & Filippenko (1989) studied the emission profiles generated by a relativistic Keplerian accretion disk around a supermassive black hole. Their models predict that the line profile will split into a doublepeaked structure due to rotation, that the blue peak will be stronger than the red peak due to relativistic beaming, and that there will be a net gravitational redshift of the line profile. A sample of 12 radio galaxies with broad emission lines which can be reproduced in the Keplerian disk framework is discussed by Eracleous & Halpern (1994). The fractional redshift measured for NGC 6251 is comparable to the mean shift observed for the Eracleous & Halpern sample, but the FWHM of the NGC 6251 broad line ( km s-1) is smaller than observed for typical disklike emitters ( km s-1 with the distribution peaking at km s-1). Alternative mechanisms leading to double peaked or asymmetric line profiles are biconical or spherical radial outflows (Zheng, Sulentic, & Binette 1990, Zheng, Veilleux, & Grandi 1991; see however Livio & Xu 1997) and massive binary black holes (Begelman, Blandford, & Rees, 1980). Higher spectral resolution and S/N data are necessary to perform detailed modeling and discriminate between the alternatives mentioned above.
3.2.2 Fits to the OffNuclear Spectra
The fit to the N spectrum (which has comparable S/N to the nuclear spectrum, and higher than any of the other spectra) was carried out as described for the nucleus111No corrections to the fluxes were adopted for contamination of the offnuclear spectra by light scattered from the wings of the PSF of the narrow nuclear components, which for a perfectly centered point source amounts to 12% and 2% of the nuclear light in apertures 0′′.09 and 0′′.13 away respectively. These estimates are strongly dependent on the centering of the point source within the central aperture, and are likely to be overestimates in our case, since the narrow emission line region is clearly extended. As was the case for NGC 4261 (Ferrarese et al. 1996) errors on the central wavelength and FWHM derived from neglecting this effect are small compared to internal uncertainties on the same quantities.. We found that, while the central velocity for the narrow lines is significantly different from the nuclear values (see Table 2), the FWHM, redshift and shape of the (unconstrained) broad H line are consistent with what measured at the nuclear location. This confirms the hypothesis that the broad H line originates from an unresolved region at the nuclear location, and what is seen in the offnuclear spectra is due to the wings of the FOS PSF. For all remaining spectra, due to the considerable decrease in the S/N ratio, it was necessary to constrain the fit by fixing the central velocity, shape and FWHM (but not the flux) of the broad H line to the nuclear values. Figure 11 shows the fits to all seven spectra; the free parameters for each emission line are listed in Table 2. The fluxes of the broad H emission are found to decline with increasing distance from the nucleus in a fashion consistent, within the quoted errors, with what is expected for a point source centered at the northern edge of the NUC aperture, which coincides with the nuclear position (§3.1).
4 Determination of the Central Mass
4.1 The Keplerian Disk Model
This section will make use of the gas velocities measured at the seven FOS aperture locations discussed above to probe the presence of a central mass concentration. We will make the simple assumption that the velocity field is determined by the combined potentials of the stars and of the central black hole, and ignore, for the time being, the possible presence of radial flows, which will be discussed in §4.2. We will further assume that the gas is confined in a thin disk.
The rotational velocity expected from the stellar potential in which the disk is embedded can in principle be derived from the observed surface brightness profile, once a suitable assumption is made for the stellar masstolight ratio. In practice, the procedure is nonunique since the presence of both the dust disks and the nonthermal nucleus prevents us from performing a complete isophotal analysis and therefore determining the surface brightness profile in the critical inner 0′′.5 (§2.1). Figure 12 shows the best fits to the surface brightness profile between 0′′.5 and 3′′.5, using two different analytical functions. The first, represented by the solid line, is the sum of two exponential functions of the type and, in the assumption of spherical symmetry, can be deprojected analytically to give the luminosity density plotted in the lower panel of Figure 12. The second fit to the surface brightness profile is performed using the Hernquist model (Hernquist 1990). The two functions give fits of similar quality, however, the extrapolated central brightness and luminosity density predicted by the Hernquist model are a factor three and ten higher respectively than given by the double exponential profile.
Do the two fits described above give reasonable representations of the luminosity density for a galaxy like NGC 6251? It is now widely recognized that a well defined relationship exists between the central slope of the brightness profile and the absolute magnitude of the host galaxy (e.g. Ferrarese et al. 1994). In particular, Gebhardt et al. (1996) used a nonparametric approach to determine the logarithmic slope of the luminosity density dlog/dlogr at 0′′.1 for 42 early type galaxies observed with the uncorrected HST. At the absolute magnitude of NGC 6251 ( mag), they find an average slope of dlog/dlogr , while the complete range in slopes spanned by the observed galaxies is dlog/dlogr . The double exponential and the Hernquist models applied to NGC 6251, shown in Figure 12, give dlog/dlogr and respectively. We can therefore safely assume that the true stellar mass density, and therefore the mass of the central point source, are within the limits defined by the two models. If anything, in fact, the Hernquist models produces a slope which is steeper than observed for a galaxy of the type of NGC 6251, while marginally smaller slopes than given by our double exponential fit can be observed. Therefore, if we err in determining the central luminosity density and mass, we err on the safe side: our lower estimate on the central mass will indeed represent a hard lower limit.
Before proceeding, we can provide a further check to the claim that the real brightness profile is within the limits set by the two fits shown in Figure 12, by pushing our measurement of the brightness profile closer to the nucleus using the dereddened images (§2.1), or the brightness profile along the minor axis of the dust disk. Note however, that neither method will allow us to bring our measurements inside the inner 0′′.2, which are contaminated by the bright nucleus. The brightness profile along the minor axis of the dust disk is shown by the open circles and the crosses in Figure 12 222The distance along the minor axis of the disk has been projected to a distance along the semimajor axis of the isophotes, by using at each radius the values of position angle and ellipticity derived in §2.1. Inside 0′′.5, where the isophotes are not determined, we assumed a position angle of 25∘ and an ellipticity of 0.1, corresponding the the innermost measured values., while the brightness profile derived from the dereddened images is shown by the open triangles. The minor axis profile agrees well with the double exponential fit, corresponding to our adopted lower limit on the luminosity density. The dereddened brightness profile falls in between the two fits, and therefore within the range of luminosity densities considered in our analysis. Even if we do not feel confident enough to use these data in constraining the fits (the position angle and ellipticity of the isophotes are not known inside 0′′.5, and assumptions on the intrinsic color of the galaxy had to be made in dereddening the images), our findings give us confidence that our two models for the stellar component indeed include the correct answer.
The projected rotational velocity due to a central mass MBH is given by Harms et al. (1994) as a function of the angle between the normal to the disk and the line of sight, and of the position angle of the disk major axis. For our analysis, we introduce two more free parameters, the displacements and of the central aperture relative to the center of the disk.
The expected rotational velocity due to the central mass and to the stellar potential is calculated at each aperture position, for both of the stellar models described above. The stellar masstolight ratio is assumed to be constant and equal to M⊙/L⊙ (Faber & Gallagher 1979). The position angle and inclination of the disk are varied between 1∘ and 90∘ in 1∘ increments, and the misplacements , are sampled in 1/5 of an aperture width (0′′.018) increments. For each combination of , , and , the component of rotational velocity due to the stellar potential, once projected on the plane of the sky, is subtracted from the measured velocity, and the result, , is compared to the projected velocity due to a central point source.
From this point on, we followed the procedure adopted by Ferrarese et al. (1996). Combinations of model parameters providing a good fit to the data will produce a linear correlation between (normalized to ) and ; the adopted values of , , and are then the ones for which the of the least square fit (weighted by the errors on the observed velocities) is minimized. The solution is calculated independently for the double exponential and the Hernquist representations of the stellar component. For the double exponential, the best fitting model corresponds to ∘ 10∘, ∘ 15∘, and . A plot of the predicted velocities versus the observed velocities (corrected for the velocity component due to the stellar potential as described above) is given in Figure 13; the data is indeed very well fit by a straight line, confirming the assumption of Keplerian motion in the disk. As discussed in Ferrarese et al. (1996), the slope and yaxis intercept of the least square fit to the data points give the central mass and the galaxy systemic velocity respectively: M⊙ and km s-1. When the Hernquist models is adopted, the best fit gives ∘ 10∘, ∘ 15∘, , , M⊙, and km s-1. The double exponential and Hernquist models give fits with comparable , corresponding to a 99% confidence level, but of course the derived central mass is smaller in the case of the Hernquist model (which predicts a much higher central stellar luminosity density) than in the double exponential model. Note that given the errors derived above for the inclination and position angle of the gas disk, and the errors associated with the subtraction of the continuum and nuclear light in producing a pure emission line image (§2.1), the emission line map shown in the lower right panel of Figure 1, and the outline of the gas disk derived from the kinematical analysis (Figure 2) are in full agreement with each other.
The parameters predicted by the Keplerian disk model for the two mass distributions described above are summarized in Table 3. The velocity models and the data points are shown in Figures 14 for the double exponential model and Figure 15 for the Hernquist model. The velocities have been deprojected using the best fitting values for the inclination and position angle of the disk. In both figures, the dotted line shows the orbital velocity due to the stellar potential. For comparison, the dotdashed line is the rotational velocity due the potential of the disk itself, which is negligible given the disk small mass, M⊙. The final expected velocity, taking into account the black hole, the stars and the (negligible) contribution of the dust disk, is shown by the thick solid line.
4.2 NonGravitational Motions
When compared to the stars, the drawback of using ionized gas to constrain the central potential is that gas is easily pulled around by nongravitational motions. Especially when only a few velocity data points are available, the danger of mistaking radial out/inflows for circular motion needs to be taken seriously. In NGC 6251, a high degree of gas turbulence is testified by the large line widths, which are one order of magnitude larger than the (presumably) rotational velocities, implying that in spite of the fact that the outer dust disk appears fairly flat, the inner parts must be geometrically thick, and the possibility of radial flows cannot be excluded.
We consider the simple case in which the gas is moving radially in a biconical region with velocity , where is the half opening angle of the cone and are polar coordinates measured relative to the cone apex and the cone axis respectively. The exponent allows us to model both outflows () and inflows () with varying acceleration, while the exponent controls the angular dependence of the velocity. In projecting on the plane of the sky, the inclination of the cone axis with respect to the line of sight, and the position angle of the projected cone axis, come in as additional parameters. The fits are performed using the same procedure as for the Keplerian disk model. The parameters providing the best fit are , , ∘ 10∘, ∘ 15∘, and ∘ 10∘, giving the velocities plotted in Figure 16 as a function of the observed velocities. The biconical flow model and the Keplerian disk model are discussed and compared in the next section.
5 Discussion
5.1 Comparison of the Velocity Models
The dynamical models presented in the previous section are based on seven emission lines. Errorbars on the measured velocities are large, and constraining the model parameters is tricky. However, the Keplerian disk model does a superior job in fitting the data than the biconical flow model. This claim is based on the following observations.
In the biconical flow model, the velocities measured at the W and E positions are not reproduced in spite of the large inclination and opening angle of the cone: according to the reduced , the model can be rejected at the 40% confidence level. The inferred systemic velocity, km s-1, provides a bad match to the ZCAT value of km s-1; finally, the position angle of the cone axis is misaligned by ∘ with respect to the axis of the radio jet, implying that the radio jet and the ionized gas are not collimated by the same mechanism. We conclude that outflows (or inflows), if present, do not dominate the velocity field in the inner 0′′.2.
For both stellar models, the Keplerian disk model reproduces the data at the 99% confidence level. It predicts a systemic velocity, , in complete agreement with the ZCAT value. It places the center of the gas disk at the exact position of the flux centroid determined in a completely independent manner (cf. §3.1). In fact, while formally we have used a six parameter fit to our seven velocity data points, three of those parameters are well determined from independent measurements, and have been left free to vary as a consistency check. It appears as if the only failed prediction of the model is the misalignment, by ∘, between the minor axis of the disk and the radio jet, and even this might not be a serious problem. The disk of ionized gas predicted by the model is seen more face on (by ∘) than the larger dust disk, and the position angles of the two disks are misaligned by ∘. This implies that the entire structure is tilted and warped, and it is therefore not unjustified to assume that the warp persists inwards and that at the parsecsize scales, which are inaccessible even at HST resolution, the disk indeed becomes perpendicular to the parsec scale radio jet. Possible causes for the warping of the disk will be discussed later §5.3.
As discussed in the previous section, the two stellar models adopted to reproduce the kinematics of the disk of ionized gas, encompass the range of stellar mass density expected for a galaxy with the luminosity of NGC 6251. Hence, the inferred masses for the central point source, M⊙ and M⊙, represent an upper limit and a hard lower limit respectively to the true central mass. The mass to light ratio in the inner 46 pc (corresponding to the FOV of the FOS aperture) is M⊙/L⊙ if the Hernquist model is adopted, and M⊙/L⊙ for the double exponential model. We conclude that the kinematical data imply the presence of a central mass concentration, M⊙, supporting the central hypothesis of the AGN paradigm, according to which the nuclear activity is powered by a massive black hole. Radial flows play, if anything, only a secondary role. Note also that, since the kinetic energy trapped in the turbulent motion of the gas has not been accounted for, any number derived here for the central mass is likely an underestimate of the true value.
5.2 The Accretion Mechanism
Advection dominated accretion flows (ADAF, Narayan & Yi 1995, Abramowicz et al. 1995, Narayan, Yi, & Mahadevan 1995) have received considerable attention in the past few years as a plausible mechanism to reconcile the observational limits on black hole masses and accretion rates in low luminosity AGNs, with the surprisingly small amount of energy radiated by the active nucleus (Fabian & Canizares 1988, Reynolds et al. 1996, Lasota et al. 1996, Di Matteo & Fabian 1997). At very low accretion rates (, where is the accretion rate corresponding to the Eddington luminosity, and is the ShakuraSunyaev viscosity parameter), ADAF results in a radiative efficiency times smaller than expected from a standard thin accretion disk (Di Matteo & Fabian 1997). This is a consequence of the fact that in ADAF the cooling timescale for the ions exceeds the inflow timescale, and most of the thermal energy is advected inwards rather than being radiated locally. ADAF have been successfully advocated to reproduce the nuclear luminosity and spectral energy distribution of M87, NGC 4258 and M60 (Reynolds et al. 1996, Lasota et al. 1996, Di Matteo & Fabian 1997)
Is ADAF necessary to explain the nuclear nonthermal luminosity observed for NGC 6251, in the light of the newly determined estimate of the central mass? ROSAT/PSPC observations (Birkinshaw & Worrall 1993) place lower limits on the central pressure and proton density of the ISM of N m-2 and cm-3 respectively. Assuming normal cosmic composition ( = 1.18), these limits give a Bondi (1952) accretion rate of M⊙ yr-1. Converted at 10% radiation efficiency, the corresponding accretion luminosity is for a M⊙ black hole333The value quoted is likely a lower limit to the Bondi’s accretion rates, since lower limits to the pressure and density of the ISM have been used. If the physical parameters of the ISM in M87 are taken as characteristics, then the Bondi’s accretion rate and accretion luminosity for NGC 6251 would be a factor five higher than quoted in the text. This does not change the qualitative nature of our arguments..
Radio, optical and Xray measurements of the nuclear nonthermal luminosity are plotted in Figure 17. The radio data are from VLBI observations by Jones et al. (1986) with 20 mas resolution, the optical data are as derived in §2.1 ( 0′′.1 resolution), while the Xray data are ROSAT/PSPC measurements by Birkinshaw & Worrall (1993)444The ROSAT data include only the unresolved component at 1 keV corresponding to model 4a of Birkinshaw and Worrall with 25′′ resolution, and ASCA data from Turner et al. (1997) between 2 keV and 10 keV. The spectral energy distribution of M87 (which can only be explained in a ADAF scenario) is also shown for comparison (Reynolds et al. 1996). The nonthermal nuclear flux is 30 times brighter in NGC 6251 than in M87 at every wavelength. A rough lower limit to the total luminosity of NGC 6251 is calculated assuming spectral indexes () , 0.52, 1.0, and 1.26 in the radio, optical, 0.52 keV and 2 keV10 keV Xray ranges respectively 555The radio and Xray spectral indexes are from Jones et al. (1986), Birkinshaw & Worrall (1993) and Turner et al. (1997), while the optical spectral index is a simple fit to the and dereddened fluxes for the nucleus given in §2.1, and integrating the resulting spectral energy distribution for keV (the upper frequency of the ASCA observations). The result, erg s-1, is compatible with Bondi’s lower limit, and therefore accretion through a standard, geometrically thin, accretion disk is consistent with the observations.
ADAF might still be taking place, but would require an accretion rate larger than the Bondi’s value, in order to account for the observed luminosity. Indeed, given the difficulty encountered by standard accretion disk models in reproducing the hard Xray component (Krolik 1998), ADAF might be necessary to account for the observed ratio of optical to Xray luminosity (Lasota et al. 1996). The accretion rate required for NGC 6251 in an ADAF scenario, M⊙ yr-1, is compatible with the 0.3 M⊙ yr-1 mass deposition rate estimated by Birkinshaw & Worrall (1993) from the cooling flow of the thermally unstable, extended, hot ISM.
5.3 The Warping of the Disk and the Origin of the Dust
In §5.1, we concluded that the dust/gas structure seen in the nuclear region of NGC 6251 is warped: the angle between the normal to the disk and the line of sight varies from ∘ in the inner region to ∘ in the outer parts, and the position angle of the major axis changes by ∘. We will discuss this observation in the framework of three different scenarios.
5.3.1 Triaxiality
Evidence for triaxiality is difficult to obtain. Even if not direct proof, the small isophotal twist (Figure 3), the slight misalignment of the radio jet and the isophotal minor axis (Figure 2) and the fact that NGC 6251 is not rotationally supported (, Heckman et al. 1985) are consistent with the presence of some degree of triaxiality. Since the kinematical signature of triaxiality is a misalignemt between the apparent rotation axis and minor axis of the galaxy, high S/N, high dispersion spectra taken along the apparent major and minor axis of the galaxy would provide additional information as to the existing level of triaxiality. Note that the presence of a massive black hole is expected to destroy triaxiality (Merritt & Quinlan 1998), but the process would proceed on timescales longer than a Hubble time for a giant elliptical such as NGC 6251.
The settling time of the gas in an axisymmetric galaxy is of the order yr (Tohline, Simonson, & Caldwell 1982). Since under the assumption of axisymmetry the equilibrium configuration must lie on the symmetry plane perpendicular to the rotation axis, the misalignment between the principal axes of the galaxy and the axes of the dust disk, and the warping of the disk are difficult to explain if the origin of the gas in internal, and can be explained in a merging scenario only if the gas has been acquired within the past few years.
However, in a triaxial galaxy which is slowly tumbling around one of its principal axis (as could be the case for NGC 6251, which has a rotational velocity of km s-1, Heckman et al. 1985), four dynamically different stable solutions are possible (van Albada, Kotanyi, & Schwarzschild 1982, SteimanCameron & Durisen 1984). When the dust and gas occupy the anomalous orbits which have an axis roughly perpendicular to the system’s rotation axis, a change in orientation of the anomalous plane with radius leads to warping of the dust structure. The sense and appearance of the warp depends on the orientation of the tumble axis, tumble rate, axis ratio, and radial mass distribution of the galaxy.
A detailed modeling of the rotation figure of NGC 6251 is beyond the scope of this paper, but we note that triaxial tumbling systems have been invoked to reproduce the warping of the dust disks in NGC 5128 and M84 (van Albada et al. 1982), and might therefore be responsible for the peculiar geometry of the NGC 6251 dust disk.
5.3.2 Merging
An external origin for the dust in early type galaxies is generally advocated (e.g. Goudfrooij et al. 1994, van Dokkum & Franx 1995). A search of the CfA ZCAT redshift catalog (Huchra et al. 1992) shows that NGC 6251 is in a low density environment. The nearest cluster, ZW 1609+8212, is over 8 Mpc away in projected distance and has several thousand km s-1 higher redshift. Within Mpc (the median pairwise radius of loose groups, Ramella, Geller, & Huchra 1989, Zabludoff & Mulchaey 1998) three objects are found, none of which with known redshift. However, the luminosity in the resolved thermal Xray gas in NGC 6251 is erg s-1 in the 0.52.5 keV range (Birkinshaw & Worrall 1993, Worrall & Birkinshaw 1994) typical of loose groups (Mulchaey & Zabludoff 1998), but is concentrated in a region (3′ kpc) much smaller than the typical median pairwise radius of loose groups. The possible implication is that NGC 6251 is the evolutionary endpoint of a loose group, in which all galaxies have coalesced to form a giant elliptical (Toomre 1977; Weil, & Hernquist 1994).
Whether or not the above scenario has in fact taken place, there is one major difficulty with the hypothesis that the dust and gas in NGC 6251 has been assimilated from dwarf systems. In NGC 6251, and any other LINER, the [NII] emission is always stronger than H. Even the most extreme (in terms of strength of the magnetic field and shock velocity) shock ionization models of Dopita & Southerland (1995) cannot reproduce [NII]/H flux ratios higher than 1.5, assuming solar abundances for the gas. For NGC 6251, [NII]/H is , implying that the gas metallicity is at least solar, and possibly a factor a few higher. On the other hand, the typical metallicity range spanned by dwarf systems is between 1/10 to 1/100 solar (Caldwell et al. 1992, Lisenfeld & Ferrara 1998); it is therefore unlikely that dwarf systems are progenitors of the gas seen in NGC 6251.
5.3.3 Radiation driven warping
The arguments in §5.3.1 and §5.3.2 seem to imply that an external origin for the dust is unlikely, and therefore the warping of the dust/gas disk could correspond to a stable configuration in a triaxial system. We now consider a further possibility. An accretion disk which is illuminated by a central radiation source will become unstable to warping, provided that the disk is optically thick to both absorption and reemission of radiation (Pringle 1996, Maloney, Begelman, & Pringle 1996, Livio & Pringle 1997). If the disk is optically thick, the radiation absorbed at a particular point in the disk will be reemitted by the same point perpendicularly to the disk surface. If the initial configuration of the disk is perturbed, so that the disk is illuminated in a nonuniform manner, the backreaction of radiation will produce a net torque and induce warping instabilities in the disk, which will start to wobble or precess. This mechanism is successful in explaining the pointsymmetric morphology observed in some planetary nebulae (Livio & Pringle 1997), the warping of the disk of water masers in NGC 4258 (Maloney et al. 1996), and of the Pictoris disk (Armitage & Pringle 1997).
The time scale for the instabilities to set in is given by Livio & Pringle as a function of the mass of the disk, and the radius, mass and luminosity of the central object. By taking the values in §2.2 for the radius and mass of the disk, and replacing the Schwarzschild radius as the radius of the central object, the timescale for the instabilities to set in is yr. The calculation assumes a M⊙ black hole, radiating erg s-1. Our assumption are more likely to lead to an underestimate than an overestimate of , since the disk is not optically thick at all wavelengths (), and the radiation field is not necessarily isotropic. Radiation induced warping is therefore not playing a significant role in shaping the disk.
However, if the disk becomes optically thin at the boundary between the inner gas disk and the outer dust disk, then would drop by the ratio of the masses of the two disks, or about a factor . In this case, radiation driven warping would affect the inner, ionized gas dominated, part of the disk, while the outer part would be left unperturbed. Interestingly, the value of in this case, a few yr, is of the same order of magnitude as the precession period yr quoted by Jones et al. (1986) to explain the Sshaped symmetry of the large scale radio lobes. This would be expected if the jet is emerging perpendicular to the disk, and therefore changes its direction on timescales as the disk precesses.
In conclusion, radiation warping might be responsible for the twisting between the inner and outer parts of the disk, by acting on the optically thick ionized gas disk. It would not, however, influence the shape and orientation of the outer dust disk.
6 Conclusions
This paper discusses HST optical images and spectra of NGC 6251, a giant E2 galaxy and powerful radio source at a distance of 106 Mpc (for km s-1 Mpc-1). The and WFPC2 images, which have 0′′.1 (51 pc) resolution, show a well defined dust disk, 730 pc in diameter, whose normal is inclined by 76∘ to the line of sight. A significant ionized gas component is confined to the central of the disk. The FOS 0′′.09 square aperture was used to map the velocity of the gas in the central 0′′.2. Dynamical models have been constructed assuming two different analytical representations for the stellar brightness profile, designed to encompass the acceptable range of central luminosity density for a galaxy of the type and luminosity of NGC 6251. For both representations of the stellar mass density (and therefore stellar potential), the kinematics of the gas imply the presence of a central mass concentration, to M⊙, likely a black hole given the presence of nuclear activity. The contribution of radial flows to the velocity field is negligible. The bolometric nonthermal luminosity of the nucleus is higher than the lower theoretical constraint given by accretion at the Bondi rate and 10% efficiency (appropriate for a conventional thin accretion disk). Therefore, advection dominated flows do not necessarely have to be advocated to account for the energy output, given the newly determined black hole mass estimate.
The dynamical modeling also shows that the inner parts of the disk, dominated by the ionized gas, are significantly twisted with respect to the outer, dusty regions. Neither are perpendicular to the radio jet; however, the perpendicularity at the parsec scale remains to be tested. Even if the Xray properties of NGC 6251 make it a possible candidate for the evolutionary endpoint of the coalescence of a loose group, it is unlikely that the metal rich gas in NGC 6251 could have been assimilated from metal poor dwarf galaxies, and an internal origin for the dust and gas seems more likely. Cooling flows have been advocated (Birkinshaw & Worrall 1993) and a stable warped configuration for the dust/gas disk is possible in the presence of a tumbling triaxial potential. We also considered the role of radiation driven warping in shaping the disk, and concluded that it has a negligible effect, at least in the outer, dust dominated, regions.
The models presented in this paper are based on seven emission lines. Errorbars on the measured velocities are large, and constraining the model parameters is tricky. A total of fourteen orbits of HST time were spent in obtaining the NGC 6251 spectra, therefore higher quality data would be prohibitively expensive. At a distance of Mpc, NGC 6251 represents the limit to which the search for massive black holes could be pushed with the HST/FOS: a second trip deep inside the NGC 6251 gas disk with HST/STIS will undoubtedly enlighten the picture.
References
- (1) Abramowicz, M.A., et al. 1995, ApJ, 438, L37
- (2) Allen, M. G., Dopita, M. A., & Tsvetanov, Z. I. 1998, astroph/9801040
- (3) Armitage, P. J., & Pringle, J. E. 1997, ApJL, 488, L47
- (4) Baum, S. A., & Heckman, T. 1989, ApJ, 336, 702
- (5) Begelman, M. C., Blandford, R. D., & Rees, M. J. 1980, Nature, 287, 307
- (6) Bender, R., Doebereiner, S., & Moellenhoff, C. 1988, A&AS, 74, 385
- (7) Biretta, J., et al. 1996, Wide Field and Planetary Camera 2 Instrument Handbook, version 4.0 (Baltimore: STScI)
- (8) Birkinshaw, M., & Worrall, D. M. 1993, ApJ, 412, 568
- (9) Blandford, R. D. 1993, in Astrophysical Jets, ed. D. Bulgarella, M. Livio, & C. O’Dea (Cambridge: Cambridge Univ. Press), 15
- (10) Bondi, H. 1952, MNRAS, 112, 195
- (11) Bower, G. A., et al. 1998, ApJL, 492, L111
- (12) Burstein, D., & Heiles, C. 1984, ApJS, 54, 33
- (13) Caldwell, N., Armandroff, T. E., Seitzer, P., & da Costa, G. S. 1992, AJ, 103, 840
- (14) Cardelli, J. A., Clayton, G. C., & Mathis, J. S. 1989, ApJ, 345, 245
- (15) Chen, K., & Halpern, J. P. 1989, ApJ, 344, 115
- (16) Chen, K., Halpern J.P., & Filippenko, A. V. 1989, ApJ, 339, 742
- (17) Cohen, M. H., & Readhead, A. C. S. 1979, ApJL, 233, L101
- (18) Contini, M. 1997, A&A, 323, 71
- (19) Crane, P., et al. 1993, AJ, 106, 1371
- (20) Crane, P., & Vernet, J. 1997, ApJ, 486, L91
- (21) de Vaucouleurs, G., de Vaucouleurs, A., Corwin, H. G., Buta, R. J., Paturel, G., & Fouque, P. 1991, Third Reference Catalog of Bright Galaxies (New York: Springer)
- (22) Di Matteo, T., & Fabian, A. C. 1997, MNRAS, 286, L50
- (23) Dopita, M. A., & Southerland, R. S. 1995, ApJ, 455, 468
- (24) Eracleous, M., & Halpern, J. P. 1994, ApJS, 90, 1
- (25) Faber, S. M., & Gallagher, J. S. 1979, ARA&A, 17, 135
- (26) Fabian, A. C., & Canizares, C. R. 1988, Nature, 333, 829
- (27) Ferrarese, L., van den Bosch, F., Ford, H.C., Jaffe, W., O’Connell, R.W. 1994, A.J., 108, 1598
- (28) Ferrarese, L., Ford, H. C., & Jaffe, W. 1996, ApJ, 470, 444
- (29) Fillmore, J.A., Boronson, T.A., & Dressler, A. 1986, ApJ, 302, 208
- (30) Ford, H. C., & Tsvetanov, Z. I. 1998, astroph/9801180
- (31) Ford, H. C., et al. 1994, ApJ, 435, L27
- (32) Gebhardt, K., et al. 1996, AJ, 112, 105
- (33) Goudfrooij, P., Hansen, L., Jorgensen, H. E., Norgaard-Nielsen, H. U. 1994, A&AS, 105, 341
- (34) Harms, R., et al. 1994, ApJ, 435, L35
- (35) Heckman, T. M., Illingworth, G. D., Miley, G. K., & van Breugel, W. J. M. 1985, ApJ, 299, 41
- (36) Hernquist, L 1990, ApJ, 356, 359
- (37) Holtzman, J. A., et al. 1995a, PASP, 107, 156
- (38) Holtzman, J. A., et al. 1995b, PASP, 107, 1065
- (39) Huchra, J., Geller, M., Clemens, C., Tokarz, S., and Michel, A. 1992, Bull. Inf. C.D.S. 41, 31
- (40) Jaffe, W., Ford, H. C., Ferrarese, L., van den Bosch, F., & O’Connell, R. W. 1993, Nature, 364, 213
- (41) Jones, D. L., & Wehrle, A. E. 1994, ApJ, 427, 221
- (42) Jones, D. L., et al. 1986, ApJ, 305, 684
- (43) Keyes, C.D., et al. 1995, Faint Object Spectrograph Instrument Handbook (Baltimore: STScI)
- (44) Kriss, G. A. 1994, in Astronomical Data Analysis Software and Systems III, ASP Conf. Ser. 61, ed. D. R. Crabtree, R. J. Hanish, & J. Barnes, (San Francisco: ASP), 437
- (45) Krist, J. 1995 in Astronomical Data Analysis Software and Systems IV, eds. Shaw, R.A, Payne, H.E., and Hayes, J.J.E., Astronomical Society of the Pacific, San Francisco, 349.
- (46) Krolik, J. H. 1998, astroph/9801135
- (47) Lasota, J.P., et al. 1996, ApJ, 462, 142
- (48) Lisenfeld, U., & Ferrara, A. 1998, ApJ, 496, 145
- (49) Livio, M., & Pringle, J. E. 1997, ApJ, 486, 835
- (50) Livio, M., & Xu, C. 1997, ApJ, 478, L63
- (51) Macchetto, F., et al. 1997, ApJ, 489, 579
- (52) Maloney, P. R., Begelman, M. C., & Pringle, J. E. 1996, ApJ, 472, 582
- (53) Merritt, D., & Quinlan, G. A. 1998, ApJ, in press
- (54) Mulchaey, J. S., & Zabludoff, A. I. 1998, ApJ, 496, 73
- (55) Narayan, R., & Yi, I. 1995, ApJ, 452, 710
- (56) Narayan, R., Yi, I., & Mahadevan, R. 1995, Nature, 374, 623
- (57) O’Neil, E. J., et al. 1994, BAAS, 184, 4904
- (58) Owen, F. N., & Laing, R. A. 1989, MNRAS, 238, 357
- (59) Perley, R. A., Bridle, A. H., & Willis, A. G. 1984, ApJS, 54, 291
- (60) Pringle, J. E. 1996, MNRAS, 281, 357
- (61) Ramella, M., Geller, M. J., & Huchra, J. P. 1989, ApJ, 344, 57
- (62) Readhead, A. C. S., Cohen, M. H., & Blandford, R. D. 1978, Nature, 272, 131
- (63) Reynolds, C. S., et al. 1996, MNRAS, 283, L111
- (64) Richstone, D. O., & Tremaine, S. 1985, ApJ, 296, 370
- (65) Sadler, E. M., & Gerhard, O. E. 1985, MNRAS, 214, 177
- (66) Sargent, W. L. W., et al. 1978, ApJ, 221, 731
- (67) Schlegel, D. J., Finkbeiner, D. P., & Davis, M. 1998, ApJ, 500, 525
- (68) SteimanCameron, T. Y., & Durisen, R. 1984, ApJ, 276, 101
- (69) Tohline, J. E., Simonson, G. F., & Caldwell, N. 1982, ApJ, 252, 92
- (70) Toomre, A. 1977, ARA&A, 15, 437
- (71) Turner, T. J., George, I. M., Nandra, K., Mushotzky, R. F. 1997, ApJS, 113, 23
- (72) van Albada, T. S., Kotanyi, C. G., & Schwarzschild, M. 1982, MNRAS, 198, 303
- (73) van der Marel, R. P. 1994, MNRAS, 270, 271
- (74) van der Marel, R. P. & van den Bosch, F. 1998, AJ, submitted (astroph/9804194)
- (75) van Dokkum, P. G., & Franx, M. 1995, AJ, 110, 2027
- (76) Waggett, P. G., Warner, P. J., & Baldwin, J. E. 1977, MNRAS, 181, 465
- (77) Weil, M. L., & Hernquist, L. 1994, ApJ, 431, L79
- (78) Willis, A. G., Wilson, A. S., & Strom, R. G. 1978, A&A, 66, L1
- (79) Worrall, D. M., & Birkinshaw, M. 1994, ApJ, 427, 134
- (80) Young, P. J., Sargent, W. L. W., Kristian, J., & Westphal, J. A. 1979, ApJ, 234, 76
- (81) Young, P. J., et al. 1978, ApJ, 221, 721
- (82) Zabludoff, A. I., & Mulchaey, J. S. 1998, ApJ, 496, 39
- (83) Zheng, W., Sulentic, J., W., & Binette, L. 1990, ApJ, 365, 115
- (84) Zheng, W., Veilleux, S., & Grandi, S. E. 1991, ApJ, 381, 418
- (85)


| RA (h m s, J2000) | Dec (∘ ′ ′′, J2000) | PA(1996.7) aaAll position angles have be precessed to the epoch of the WFPC2 observations, 1996.7 | |
|---|---|---|---|
| Nucleus bbAll coordinates derived from WFPC2 measurements can suffer from a systematic error of up to 1′′, due to errors in the guide stars positions and internal instrumental effects, such as the filter wedge effect (Biretta et al. 1996). Note that because of the filter wedge effect, relative positions of objects measured in different filters (for example the position of the nucleus in V and in I) are accurate only to within a few pixels. However, relative positions within the same image (for example the position of the nucleus and of the center of the disk in the V image) are accurate to within the quoted uncertainty | 16 32 32.154 0.001 | 82 32 16.563 0.009 | |
| Nucleus bbAll coordinates derived from WFPC2 measurements can suffer from a systematic error of up to 1′′, due to errors in the guide stars positions and internal instrumental effects, such as the filter wedge effect (Biretta et al. 1996). Note that because of the filter wedge effect, relative positions of objects measured in different filters (for example the position of the nucleus in V and in I) are accurate only to within a few pixels. However, relative positions within the same image (for example the position of the nucleus and of the center of the disk in the V image) are accurate to within the quoted uncertainty | 16 32 32.158 0.001 | 82 32 16.590 0.009 | |
| Isophotes b,cb,cfootnotemark: | 16 32 32.154 0.001 | 82 32 16.549 0.009 | 20∘.7 1∘.4 |
| Isophotes b,cb,cfootnotemark: | 16 32 32.160 0.001 | 82 32 16.580 0.009 | 20∘.8 1∘.0 |
| Dust Disk bbAll coordinates derived from WFPC2 measurements can suffer from a systematic error of up to 1′′, due to errors in the guide stars positions and internal instrumental effects, such as the filter wedge effect (Biretta et al. 1996). Note that because of the filter wedge effect, relative positions of objects measured in different filters (for example the position of the nucleus in V and in I) are accurate only to within a few pixels. However, relative positions within the same image (for example the position of the nucleus and of the center of the disk in the V image) are accurate to within the quoted uncertainty | 16 32 32.16 0.003 | 82 32 16.68 0.04 | 4∘ 2∘ |
| Dust Disk bbAll coordinates derived from WFPC2 measurements can suffer from a systematic error of up to 1′′, due to errors in the guide stars positions and internal instrumental effects, such as the filter wedge effect (Biretta et al. 1996). Note that because of the filter wedge effect, relative positions of objects measured in different filters (for example the position of the nucleus in V and in I) are accurate only to within a few pixels. However, relative positions within the same image (for example the position of the nucleus and of the center of the disk in the V image) are accurate to within the quoted uncertainty | 16 32 32.16 0.003 | 82 32 16.66 0.04 | 4∘ 2∘ |
| Inner Gas Disk | 16 32 32.153 0.001 | 82 32 16.567 0.018 | 59∘ 10∘ |
| 1665 MHz radio coreddFrom Jones & Wehrle (1994) | 16 32 31.77 | 82 32 16.16 | |
| Radio Jet AxiseeFrom Jones et al. (1986) (mas) | 297∘.1 1∘.4 | ||
| Radio Jet AxiseeFrom Jones et al. (1986) (mas) | 294∘.3 1∘.0 | ||
| Radio Jet AxiseeFrom Jones et al. (1986) (Kpc scale) | 293∘.8 0∘.1 | ||
| Stellar Rotation AxisffFrom Heckman et al. (1985) | 85∘ 28∘ |
| Line | Parameter | Aperture | ||||||
|---|---|---|---|---|---|---|---|---|
| NUC | N | S | W | E | NW | NE | ||
| [OI]6300 | vaaVelocity and FWHM are given in km s-1. The redshift and FWHM of [OI]6364, [NII]6548 and [SII]6731 are constrained to be the same as those for [OI]6300, [NII]6584 and [SII]6717 respectively. Also the redshift and FWHM of the narrow H line is the same as for the NII lines. | 7270 32 | 7467 63 | 7288 252 | 7227 295 | 7501 321 | 7310 382 | 7509 290 |
| ” | FWHMaaVelocity and FWHM are given in km s-1. The redshift and FWHM of [OI]6364, [NII]6548 and [SII]6731 are constrained to be the same as those for [OI]6300, [NII]6584 and [SII]6717 respectively. Also the redshift and FWHM of the narrow H line is the same as for the NII lines. | 2000 101 | 1809 145 | 1847 513 | 1400 409 | 2962 618 | 2800 581 | 1526 223 |
| ” | FluxbbFluxes are given in counts s-1 . The ratio of the fluxes of [NII]6584 and [NII]6548 is constrained to be equal to 3.0. | 3.48 0.21 | 2.46 0.15 | 0.33 0.05 | 0.40 0.07 | 0.51 0.38 | 0.60 0.11 | 0.81 0.11 |
| [OI]6364 | FluxbbFluxes are given in counts s-1 . The ratio of the fluxes of [NII]6584 and [NII]6548 is constrained to be equal to 3.0. | 1.20 0.14 | 1.00 0.11 | 0.04 0.06 | 0.25 0.07 | 0.39 0.11 | 0.40 0.12 | 0.20 0.08 |
| [OII]7325ccThe isophotal center is averaged between 1′′.5 and 4′′.0. | vaaVelocity and FWHM are given in km s-1. The redshift and FWHM of [OI]6364, [NII]6548 and [SII]6731 are constrained to be the same as those for [OI]6300, [NII]6584 and [SII]6717 respectively. Also the redshift and FWHM of the narrow H line is the same as for the NII lines. | 7200 131 | ||||||
| ” | FWHMaaVelocity and FWHM are given in km s-1. The redshift and FWHM of [OI]6364, [NII]6548 and [SII]6731 are constrained to be the same as those for [OI]6300, [NII]6584 and [SII]6717 respectively. Also the redshift and FWHM of the narrow H line is the same as for the NII lines. | 2039 397 | ||||||
| ” | FluxbbFluxes are given in counts s-1 . The ratio of the fluxes of [NII]6584 and [NII]6548 is constrained to be equal to 3.0. | 0.97 0.15 | ||||||
| [NII]6584 | vaaVelocity and FWHM are given in km s-1. The redshift and FWHM of [OI]6364, [NII]6548 and [SII]6731 are constrained to be the same as those for [OI]6300, [NII]6584 and [SII]6717 respectively. Also the redshift and FWHM of the narrow H line is the same as for the NII lines. | 7278 21 | 7455 25 | 7282 39 | 7227 53 | 7501 174 | 7316 46 | 7503 48 |
| ” | FWHMaaVelocity and FWHM are given in km s-1. The redshift and FWHM of [OI]6364, [NII]6548 and [SII]6731 are constrained to be the same as those for [OI]6300, [NII]6584 and [SII]6717 respectively. Also the redshift and FWHM of the narrow H line is the same as for the NII lines. | 1021 78 | 1077 91 | 928 137 | 1103 208 | 1069 262 | 850 114 | 1236 130 |
| ” | FluxbbFluxes are given in counts s-1 . The ratio of the fluxes of [NII]6584 and [NII]6548 is constrained to be equal to 3.0. | 5.74 0.28 | 5.36 0.32 | 0.79 0.08 | 0.84 0.11 | 0.88 0.21 | 0.80 0.10 | 1.82 0.21 |
| ” | SkewddThe skew parameter is constrained to be the same for all narrow emission lines. In addition, at positions S, W, E, NW and NE the skew parameter is set equal to the value measured at NUC, 0.98. | 0.98 0.12 | 0.93 0.12 | |||||
| H narrow | FluxbbFluxes are given in counts s-1 . The ratio of the fluxes of [NII]6584 and [NII]6548 is constrained to be equal to 3.0. | 1.53 0.22 | 1.20 0.22 | 0.41 0.07 | 0.16 0.10 | 0.30 0.13 | 0.18 0.07 | 0.36 0.16 |
| H broadeeThe central wavelength, FWHM and skew parameter for the broad H component at positions S, W, E, NW and NE are set equal to the nuclear values. | vaaVelocity and FWHM are given in km s-1. The redshift and FWHM of [OI]6364, [NII]6548 and [SII]6731 are constrained to be the same as those for [OI]6300, [NII]6584 and [SII]6717 respectively. Also the redshift and FWHM of the narrow H line is the same as for the NII lines. | 6392 356 | 6450 420 | |||||
| ” | FWHMaaVelocity and FWHM are given in km s-1. The redshift and FWHM of [OI]6364, [NII]6548 and [SII]6731 are constrained to be the same as those for [OI]6300, [NII]6584 and [SII]6717 respectively. Also the redshift and FWHM of the narrow H line is the same as for the NII lines. | 3656 450 | 3450 561 | |||||
| ” | FluxbbFluxes are given in counts s-1 . The ratio of the fluxes of [NII]6584 and [NII]6548 is constrained to be equal to 3.0. | 6.31 0.47 | 4.03 0.36 | 0.60 0.40 | 0.52 0.40 | 0.50 0.32 | 0.83 0.19 | 1.21 0.30 |
| ” | Skew | 2.2 0.5 | 2.1 0.3 | |||||
| [SII]6717 | vaaVelocity and FWHM are given in km s-1. The redshift and FWHM of [OI]6364, [NII]6548 and [SII]6731 are constrained to be the same as those for [OI]6300, [NII]6584 and [SII]6717 respectively. Also the redshift and FWHM of the narrow H line is the same as for the NII lines. | 7281 312 | 7450 378 | 7280 412 | 7284 450 | 7503 395 | 7314 432 | 7516 441 |
| ” | FWHMaaVelocity and FWHM are given in km s-1. The redshift and FWHM of [OI]6364, [NII]6548 and [SII]6731 are constrained to be the same as those for [OI]6300, [NII]6584 and [SII]6717 respectively. Also the redshift and FWHM of the narrow H line is the same as for the NII lines. | 1399 224 | 1159 355 | 500 357 | 800 376 | 871 327 | 800 353 | 800 374 |
| ” | FluxbbFluxes are given in counts s-1 . The ratio of the fluxes of [NII]6584 and [NII]6548 is constrained to be equal to 3.0. | 0.92 2.02 | 0.84 1.07 | 0.10 0.04 | 0.20 0.03 | 0.23 0.10 | 0.18 0.05 | 0.35 0.09 |
| [SII]6731 | FluxbbFluxes are given in counts s-1 . The ratio of the fluxes of [NII]6584 and [NII]6548 is constrained to be equal to 3.0. | 1.25 2.08 | 1.23 1.16 | 0.14 0.04 | 0.20 0.03 | 0.11 0.09 | 0.12 0.02 | 0.35 0.12 |
| Double Exponential | Hernquist | |
|---|---|---|
| Stellar Model | Stellar Model | |
| InclinationaaPredicted angle between the normal to the disk and the line of sight (§4.1). | 32∘ 15∘ | 39∘ 15∘ |
| Position AnglebbPredicted position angle of the major axis of the disk (§4.1). | 62∘ 10∘ | 57∘ 10∘ |
| RAcc[OII]7325 is not detected at positions other than NUC. | 0′′.00 0′′.018 | 0′′.00 0′′.018 |
| DecccPredicted displacements, in RA and Dec, of the central FOS aperture with respect to the center of the disk (§4.1). | 0′′.054 0′′.018 | 0′′.054 0′′.018 |
| ddPredicted central mass concentration (in M⊙, §4.1). | ||
| Systemic VelocityeePredicted systemic velocity (in km s-1, §4.1). The ZCAT systemic velocity is 7400 22 km s-1. | 7370 13 | 7368 13 |